This weekend I did my regular global macro review. This is when I go country by country analyzing the weekly and daily charts of all of the stock markets around the world. Each chart includes a momentum study (14-period RSI) and a 200 period moving average that we use to help with trend recognition. I trade indexes all over the world, simply because I can. Why wouldn’t I? [Read more…]
Video: #SB50Charts Best 50 Charts In The World
In honor of Superbowl 50, we created a countdown of what we consider to be the most important 50 charts in the world. These include U.S. Stocks and Sectors, International Indexes, Currencies, Commodities, Interest Rate Markets and Global Intermarket relationships. Some of these are more actionable than others, but collectively I think they truly tell the story of global market risk, or risk aversion for that matter.
Members of All Star Charts get access to all of this information 24/7, so we would like to invite you to start a 30-Day Risk Free Trial and Join us to see if our community is right for you. We have received incredible feedback from our members and will continue to improve the platform.
Discount Offer & Risk Free Trial: https://allstarcharts.com/superbowl/
Here is the video in full (audio begins immediately, video gets going after 30 seconds)…..Enjoy! [Read more…]
[Premium] Weekly Open Letter About The Current Market Environment
In this week’s members-only letter we discuss the following topics:
- How Much Further Can U.S. Stocks Rally
- What Is The Best Way To Profit From Higher Oil Prices?
- Which Emerging Markets Will Do The Best This Month?
- Why “no one” Saw This Yen Rally Coming, But We did?
- How Low Are Interest Rates Going and How Can We Benefit?
- Structural vs Tactical – How to Make Money In This Environment
[Premium] Why Global Markets Are Signaling A Squeeze Higher
Going country by country all over the world is one of the best tools that we have as market participants. The value that I’ve gotten over the years from looking at the behavior of all of the countries, instead of just the U.S. is a huge factor in why I am such a top/down weight-of-the-evidence guy. There are signs of strength and weakness that we see from international markets that might not be so obvious in the S&P500, for example.
Last September, I promise you that the reason I got bullish tactically was not because of what I was seeing in the United States, but what was happening around the world. There were simply too many bullish momentum divergences and downside objective achieved internationally to ignore. Something was up, and in fact, the counter-trend rally that we got in the U.S. actually exceeded my expectations.
[PREMIUM] An Open Letter About Today’s Market Environment 12-8-15
Dear Readers,
We have to trade and invest in the market that we have in front of us, not the one that we want. Therefore we have to be able to approach the market from a completely unbiased perspective. We don’t care if the market doubles in price or if it gets cut in half. We want to try to take advantage of moves in both directions. This is America after all.
I know it’s not sexy, but since October 23rd, we have wanted to approach the major U.S. stock market averages from a more neutral perspective. This is the day that both the S&P500 and the Dow Jones Industrial Average first got above what was then, and still is, a flat 200 day simple moving average. Securities in that sort of environment create headaches, for both the bulls and the bears. The reason is because [Read more…]
An Open Letter About Today’s Market Environment
November 18, 2015
Dear Readers,
We are just about 6 weeks away from finishing up 2015 and as usual there are a lot of questions left unanswered. Now is as good of a time as any to look back at how we got here so we can take a weight-of-the-evidence approach and put together a thesis of what we should expect going forward. At AllStarCharts, we prefer to incorporate a global top/down approach focusing our attention on various liquid asset classes with exposure both domestically and outside of the United States. With our long/short mentality, we look for opportunities to profit from both good and bad markets striving for absolute returns regardless of the economic environment.
Today we’ll start with the U.S. Stock Market which is relatively flat year-to-date. In large-caps, the S&P500 and Dow Jones Industrial Average have gone nowhere this year, while the leader has been the Nasdaq100 (up 10% YTD) and the laggard is obviously the Dow Jones Transportation Average (down over 10% YTD). With the tremendous amount of dislocation between Transports and the Tech-heavy Nasdaq, we’ll call that a wash and chalk this year up as flat, at least for now. The problem is, that the indexes don’t tell the whole story. Even before the August sell-off, the amount of stocks still making new highs was an embarrassment as only a small percentage of them were still rallying. The Consumer Discretionary space and the Dow Jones Internet Index were two standouts without much company. Looking at things today, and over the past few weeks, even fewer names are participating. The Nasdaq100 was the only index to make new highs this month as the rest rolled over putting in lower highs across the board.
The word “Distribution” really explains what is going on here in the U.S. Stock market. We can see a massive topping pattern forming in the S&P500 right at the 161.8% extension of the entire 2007-2009 decline. We don’t look at this as a coincidence. This distribution is also taking place at exactly the March 2000 highs for both the Nasdaq Composite and the Nasdaq100. Again, not something we consider to be a coincidence. The question we want to ask going forward is simple: with very few sectors and stocks in the market left participating to the upside, is this the tell before a much bigger sell-off, or will certain sectors take leadership and carry this market higher going forward? In the S&P500 alone, almost 70% of stocks have corrected over 10% and close to 40% of them have fallen over 20%. Will this “market of stocks” collectively stabilize, rotate leadership and head higher? I would argue that no, this is definitely the lower probability outcome and in all likelihood we are heading much lower. From a risk vs reward standpoint, this still very much favors the bears. My levels are 114.40 for $QQQ AND 2080 for the S&P500. We only want to be short these averages if prices are below them and neutral if we are above.
Within the U.S. stock market, since we have a negative bias, we want to focus our attention on the laggards. With the Dow Jones Transportation Average easily the worst of the bunch, I think Airlines are the ones we want to short. Looking specifically at the Amex Airlines Index, we are seeing the exact opposite of what we saw in March 2009. If you recall, while the market as a group was putting in lower lows in the first quarter of 2009, the Airlines held in showing the relative strength at the time to spark a 330% rally, which by far and away outperformed the S&P500 and other indexes. Today, it is the relative weakness that is standing out as this index has been making lower lows all year in an environment where the other indexes continued higher into the Summer. The uptrend line from the 2009 lows in the Amex Airlines Index has now been broken and over the past few weeks have successfully retested it and rolled over. Momentum is in a strong bearish range and prices are trending below a downward sloping 200 day moving average. Bad things tend to happen in this type of environment. We want to be aggressively short a basket of these airlines as long as prices remain below the broken uptrend line from the 2009 lows. I would be adding to shorts if we break the lows from this week. Also see the ETF $JETS.
Looking more globally, it is hard to ignore the underperformance out of the New York Stock Exchange Composite. Although considered a local exchange, half of the biggest 100 names in this cap-weighted composite are foreign companies. The relative weakness here is further evidence that the U.S. is still the leader compared with the majority of the international stocks markets. The emerging space is particularly weak as the S&P500 is sitting at or near 11-year highs relative to the MSCI Emerging Markets Index. In the more developed countries, the Japanese Nikkei has held in relatively well compared to the U.S., but is currently in no-man’s land at best. Whether looking at the Nikkei specifically, or the Hedged Japan ETF $DXJ, which we like to use, with prices trading near flat long-term smoothing mechanisms, this is a headache waiting to happen and we want to stay away from it. I would put Germany in a similar neutral category, but leaning on the bearish side on both as we are below broken support which is new overhead supply in the Nikkei and the DAX.
On the long side of the International markets, I think the potential for further mean reversion in Latin America is certainly there, but it’s the probability, or lack thereof, that annoys me. We are focused on the Latin America 40 Index ETF $ILF and specifically within that group, the MSCI Brazil Index ETF $EWZ. Coincidentally, it would take breakouts above $25 in each of these to get me bullish and long for that mean reversion towards 28. But that’s all I’m seeing there.
Crude Oil is likely to have an impact in this space. I’ve been in the camp that Oil has bottomed out, although tactically I see little reason to be long from current levels. I’d like to see more backing and filling to create a base large enough to get this one going. Looking at this from a more structural perspective, the high 30s-low 40s was where Crude Oil prices would peak throughout the 1980s and 90s. Once that range broke out to the upside after the turn of the century, we expect this to be an area where prices bottom out instead. So I think we’re close. We are watching Heating Oil and Unleaded Gasoline futures as the tell. If prices can get and hold above the lows from throughout 2015, which are awfully close, I think that Oil can bottom out. If we start to see new lows holding in these other energy commodities, I think we’re in a lot of trouble in Crude Oil and anything with a positive correlation to the commodity.
Where I would prefer to focus my attention instead within energy is Natural Gas. In September of 2009, Natural Gas bottomed out at $1.92 before rallying above $7 over the next few months. In April 2012 the bottom was $1.83 before rallying over the next 2 years above $7 again. Last month Natural Gas hit $1.94 before reversing higher. This is one we want to own for a 20% rally here back towards $3. This is a tactical trade where for risk management purposes, nimble traders can use 2.40 as the line in the sand. Contracts roll next week, so adjust accordingly ($2.55 in Jan Futures). According to the CFTC, Commercial Hedgers, who we consider “the smart money”, currently have one of their largest long positions of all time. Bigger picture, the Crude Oil:Natural Gas ratio continues to fall. This bubble peaked at over 50:1 in early 2012 and the mean reversion back to the single digits is running its course. Today the ratio sits around 18:1, from a high of over 50:1 with a long-term average near 10:1. Also remember that we are in a reversion beyond the mean business, and not just a reversion to the mean. So an overshoot into the single digits in the ratio is most likely.
Moving over to the precious metals space, it’s hard to find a more beautiful downtrend out there in the world. With prices hitting new 5-year lows this week, sentiment is nowhere near as pessimistic as it has been at prior temporary lows in 2013 and 2014. I think this bullish (less bearish) outlook from the public will be the catalyst to take Gold under $1000 and Silver under $12. The risk/reward today is not as clean as it once was a few weeks back, but the trend here is lower and we want to continue to fade any strength in metals.
The U.S. Dollar should have an impact in this group as it has consolidated its gains from the past few years in one of the healthiest consolidations across the global marketplace. Back in March, we saw the most bullish sentiment towards the Dollar in history. The Commercial Hedgers were selling this thing like if it was going to zero. Anecdotally, the financial media who has never cared what I thought about the U.S. Dollar could not finish a phone call or email with me without asking my thoughts on the Dollar. Since then, however, the sentiment has dissipated and the hedgers have covered a lot of their bearish positions. It’s hard not to like the Dollar here. I think it continues to head higher after the recent breakout. This should have negative implications towards the Euro, which represents close to 60% of the U.S. Dollar Index. I would expect the Euro to continue to fall along with precious metals as we head into the first quarter of next year.
Next we turn to the Bond market. The collective waste of time of arguing about fed hikes or not continues to dominate the airwaves and interwebs. We try and ignore what the Fed has to say as much as we can and even more so Wall Street Economists. There is no group on planet earth that has been more wrong about anything as Wall Street Economists have been about the Fed. We prefer instead to focus on price, which at the end of the day is the only thing that will pay us. First of all, we are talking about a 35 year bear market for rates. Things don’t just turn on a dime. So to blindly short the bond market because “rates can’t go any lower” makes zero sense to us. Now, the short end of the curve and the long end are two different things. The 2-year US Treasury bond yield is highs this week not seen since 2010, but the 30-year yield hit fresh lows earlier this year and has not shown any signs of a major bottom. This dislocation has caused the yield curve to narrow. Note that an inversion of the yield curve (short-term rates exceeding long-term rates) is a heads up of a pending economic recession.
Since we don’t have time to sit around waiting for yield curve inversions, we prefer to focus on the here and now. Looking at the 10-year yield, widely considered the benchmark for U.S. Interest Rates, it’s the 2.4% level that stands out the most. This was the low in rates in 2010 and also twin highs in late 2011 and early 2012. We kissed that this month and quickly rolled over. Going forward, this is our line in the sand. As long as the 10-year is below 2.4%, we want to be buying U.S. Treasury Bonds very aggressively, particularly the 30-year Futures $ZB_F. Equity traders can turn to the iShares 20+ Year Treasury Bond ETF $TLT or $TLT options for non-futures exposure. We are not expecting any rate hikes in 2016 and regardless of any rumors, we want to be buying bonds here.
That’s it for now. Please feel free to write with any questions or comments that you may have.
JC
***
Note: In next week’s letter we will spend time looking at Biotechnology, Palladium, Agricultural commodities and equities and some individual U.S. stocks like Apple, Amazon and Netflix on both the long and the short side.
Tags: $SPY $QQQ $UNG $USO $CL_F $NG_F $GC_F $GLD $SI_F $SLV $UUP $DX_F $EURUSD $FXE $TNX $TLT $ZB_F $HO_F $RB_F $EWG $DAX $NIKK $DXJ $USDJPY $6J_F $FXY $ILF $EWZ $XAL $JETS
Emerging Markets Are Still A Problem
As far as stocks go, it’s hard to find a worse area than Emerging Markets to have been in over the past few years. We’re talking about a group of countries whose stock markets do nothing but underperform the U.S. and most of the other developed nations. More recently, they’ve been crushed on an absolute basis over the past 6 months. Although our initial downside targets were hit in August, I would expect the overhead supply and downside pressure to continue to persist.
In Early August, we took a look at the MSCI Emerging Markets Index ETF suggesting that a downside break was imminent. Below is an updated weekly chart of Emerging Markets breaking down below the lower end of the two converging trendlines defining its consolidation over the past 6 years or so. In addition, prices broke that $37 area that had served as support since 2010. The more times that a level is tested, the higher the likelihood that it breaks. After several tests of support over the past 5 years, that level finally gave way. It was only a matter of time:
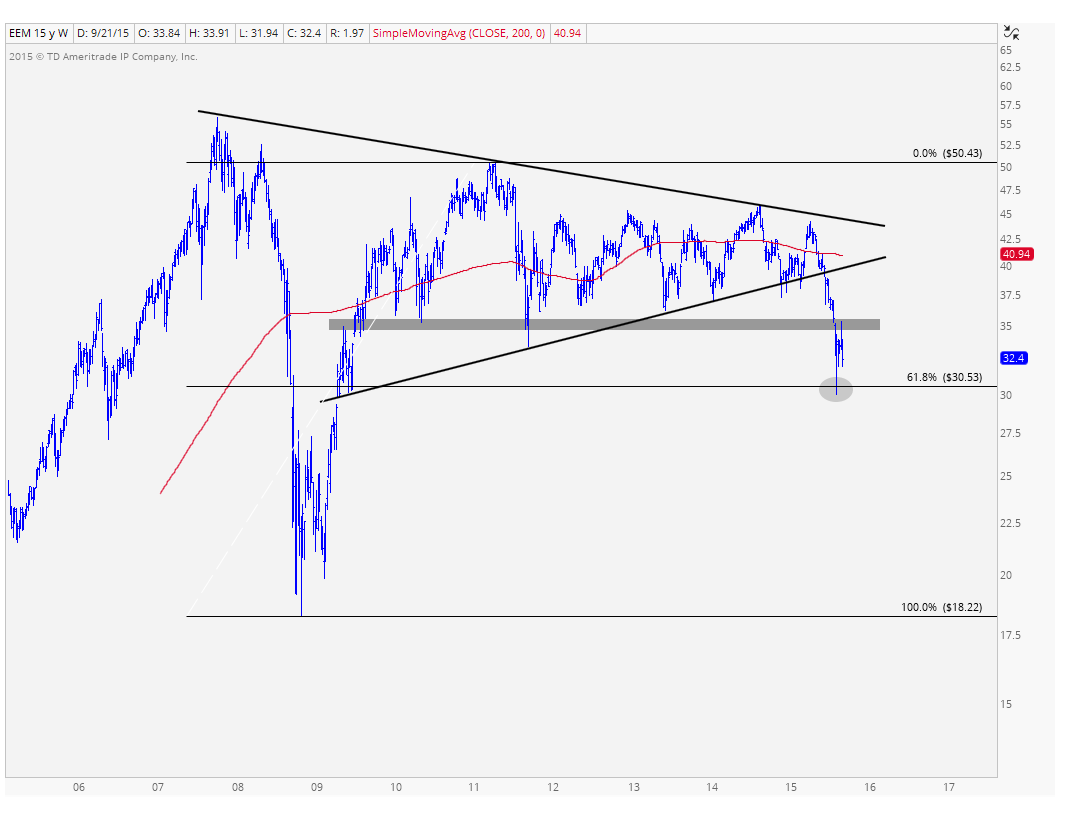
Notice how on that breakdown in August, prices were able to hold on to the 61.8% Fibonacci retracement of the entire 2008-2011 rally. Although finding support near that level was a positive, it’s what we have to worry about going forward that has me concerned. All of that former support that broke over the past few months is now overhead supply. This has been a common theme I’ve been pointing out here in the U.S. stock market. The same problem can be seen in Emerging Markets.
Here is a closer look at the breakdown in EM over the past couple of months. Look at all of that overhead supply that is now going to be a problem going forward. On any strength into that level near $37, the sellers are just sitting there waiting to sell to you. This is the, “Please just get me back to break even” crowd that is holding on to all of this supply. In my opinion, this is simply way too much supply to absorb in the near term and a sustainable rally in Emerging Markets is likely not happening any time soon. This is definitely a ‘sell strength’ market, particularly towards $37.
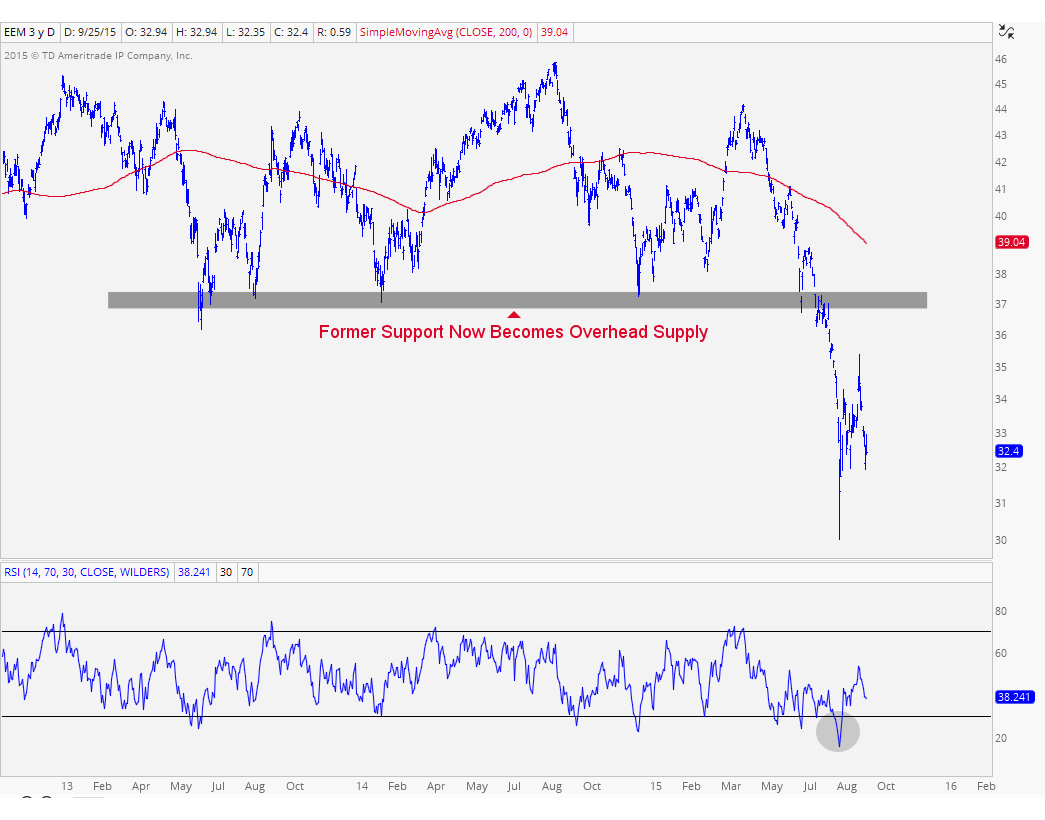
In this chart above I also included a 200 day simple moving average. When prices are trading below these downward sloping smoothing mechanisms, especially one as long as 200 days, we know the intermediate term trend is still down. In addition, look at momentum plotted down below. We are looking at a 14-day RSI hitting oversold conditions. This is characteristic of a downtrend and we haven’t even put any bullish divergences to suggest a sustainable rally could be coming.
I see nothing to like here and all signs are pointing to lower levels. The best way to take advantage of this, in my opinion, is to sell strength, particularly above $36 if we get up there. I’m not suggesting we’re getting a rally to those heights, but if we do, I think it’s a sell. The original shorting opportunity came a few months ago. So I think ‘sell strength’ is the dominant theme here that we want to focus on.
Related Posts:
Overhead Supply in the Dow Components
Overhead Supply in Healthcare & Biotechs
The Problem Now Is Overhead Supply
***
Click Here to receive weekly updates on each of these charts along with 80 charts of foreign stock market ETFs from all over the world, including Japan, China, Europe, Latin America and South Pacific.
Tags: $EEM $SPY $FXI $EWY $RSX $EWZ $ILF $EPI $EWW
Are Emerging Markets In Trouble?
Last week we were focused on Emerging Markets falling to fresh 10-year lows relative to the S&P500. We are now hitting levels not seen since 2004 when you compare the MSCI Emerging Markets Index ETF $EEM with the S&P500 ETF $SPY. We know it’s a disaster, not a secret. But today I want to take a look at emerging markets on their own. We’ve seen this group trading in a sideways frustrating range for almost 6 years while U.S. Equities have exploded higher to all-time highs.
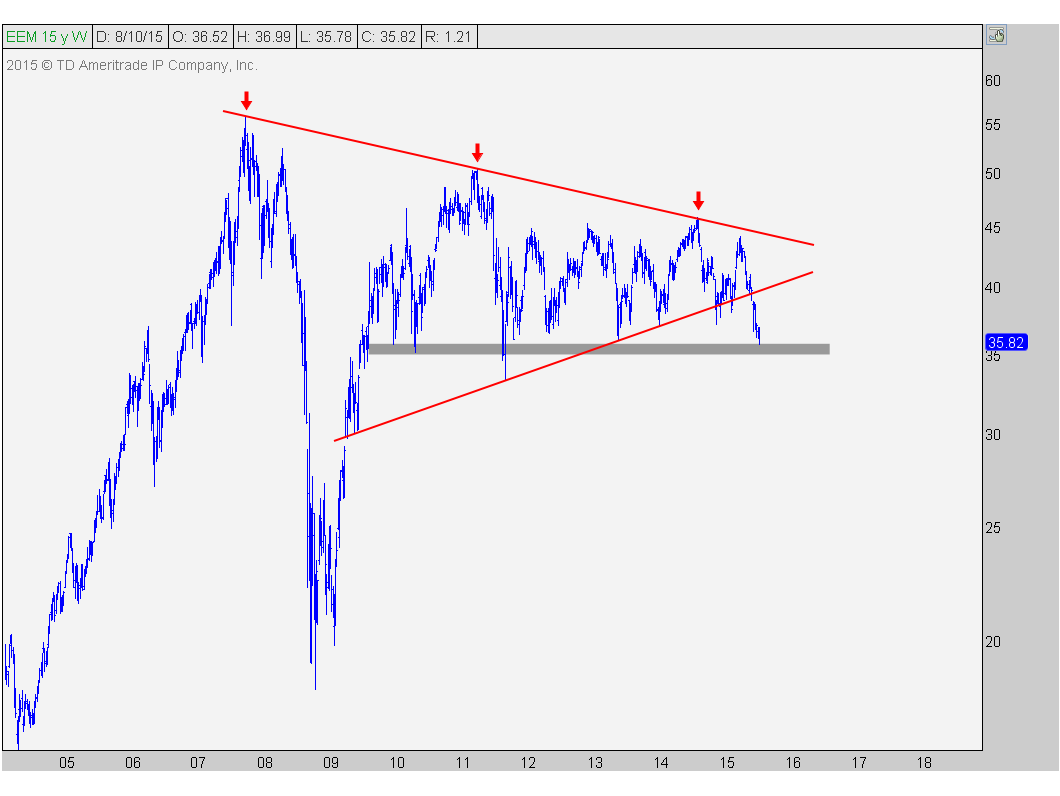
Here is a weekly chart of the MSCI Emerging Markets ETF $EEM breaking down below the lower of these two converging trendlines since 2009 and now testing the key support that has held for the past 5 years. The underperformance relative to the U.S. and the rest of the world, mentioned before, was warning #1. The break of the lower of the two uptrend lines was warning #2. And now we are here at the most important support level we can come up with on this chart:
Bigger picture emerging markets look terrible. It’s hard for me to make an argument against that. So for a more tactical perspective, we turn to the shorter-term charts. Here are the daily candlesticks with a 200 day simple moving average, that we use mostly for trend recognition, and a 14-day relative strength index for momentum readings:
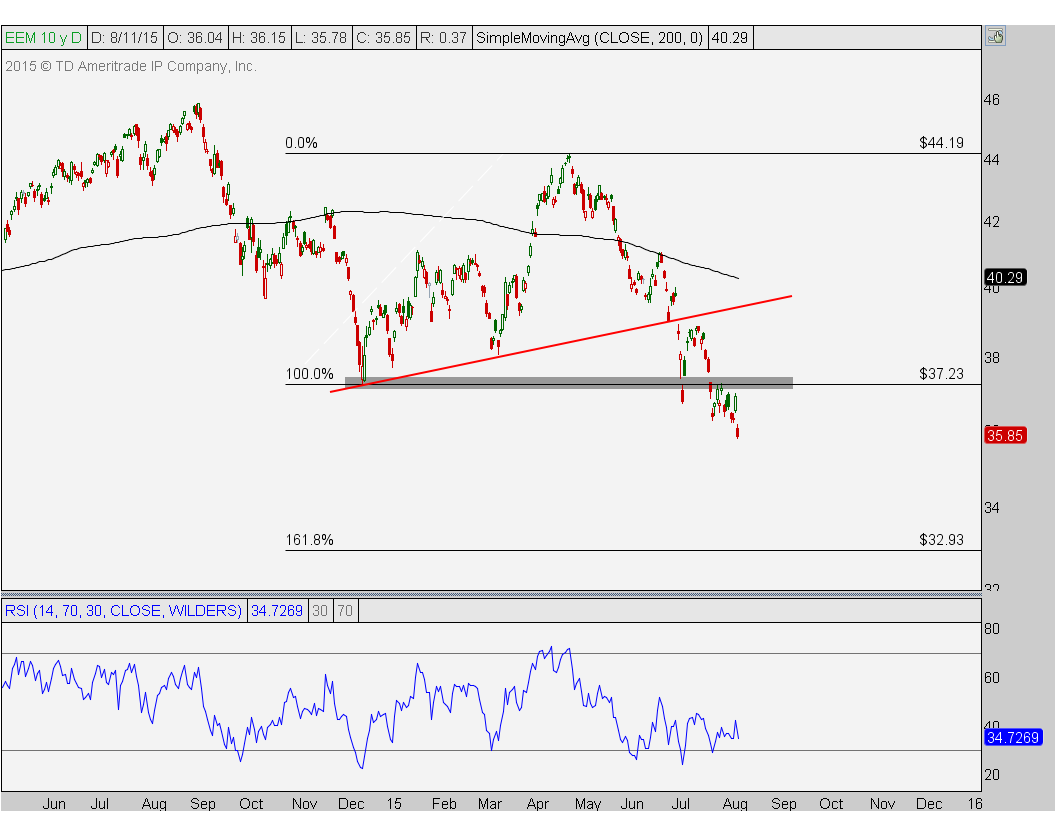
We have broken the uptrend line from the lows in December. Over the past few weeks, prices have now broken support from those December lows. Momentum is hitting oversold conditions which is a characteristic of a downtrend, and therefore confirming everything price is already signaling. Price target-wise, I’m looking at that 33 level which represents the 161.8% Fibonacci extension of that entire December-April rally.
So how do we execute? Well with that downward sloping 200 day moving average and prices breaking all kinds of support levels, I am definitely in a sell any and all strength mode, especially if we somehow get back up towards 38-39, although I doubt we get up there any time soon. I would only want to be short here tactically if we are below the December lows and more neutral above that level. Target-wise, I would be covering tactical shorts under 33, which is still a long way down from here.
This is a messy market, both short-term and long-term. The underperformance really stands out, especially with fresh support levels breaking down.
***
Click Here for more information on our Premium Technical Research Packages

Tags: $EEM $SPY $EWT $EWY $FXI $EWM $RSX $EWZ $EWW $ILF $EPI
- « Previous Page
- 1
- 2
- 3
- 4
- …
- 6
- Next Page »