This weekend I did my regular global macro review. This is when I go country by country analyzing the weekly and daily charts of all of the stock markets around the world. Each chart includes a momentum study (14-period RSI) and a 200 period moving average that we use to help with trend recognition. I trade indexes all over the world, simply because I can. Why wouldn’t I? [Read more…]
[Premium] Why Global Markets Are Signaling A Squeeze Higher
Going country by country all over the world is one of the best tools that we have as market participants. The value that I’ve gotten over the years from looking at the behavior of all of the countries, instead of just the U.S. is a huge factor in why I am such a top/down weight-of-the-evidence guy. There are signs of strength and weakness that we see from international markets that might not be so obvious in the S&P500, for example.
Last September, I promise you that the reason I got bullish tactically was not because of what I was seeing in the United States, but what was happening around the world. There were simply too many bullish momentum divergences and downside objective achieved internationally to ignore. Something was up, and in fact, the counter-trend rally that we got in the U.S. actually exceeded my expectations.
Emerging Markets Are Still A Problem
As far as stocks go, it’s hard to find a worse area than Emerging Markets to have been in over the past few years. We’re talking about a group of countries whose stock markets do nothing but underperform the U.S. and most of the other developed nations. More recently, they’ve been crushed on an absolute basis over the past 6 months. Although our initial downside targets were hit in August, I would expect the overhead supply and downside pressure to continue to persist.
In Early August, we took a look at the MSCI Emerging Markets Index ETF suggesting that a downside break was imminent. Below is an updated weekly chart of Emerging Markets breaking down below the lower end of the two converging trendlines defining its consolidation over the past 6 years or so. In addition, prices broke that $37 area that had served as support since 2010. The more times that a level is tested, the higher the likelihood that it breaks. After several tests of support over the past 5 years, that level finally gave way. It was only a matter of time:
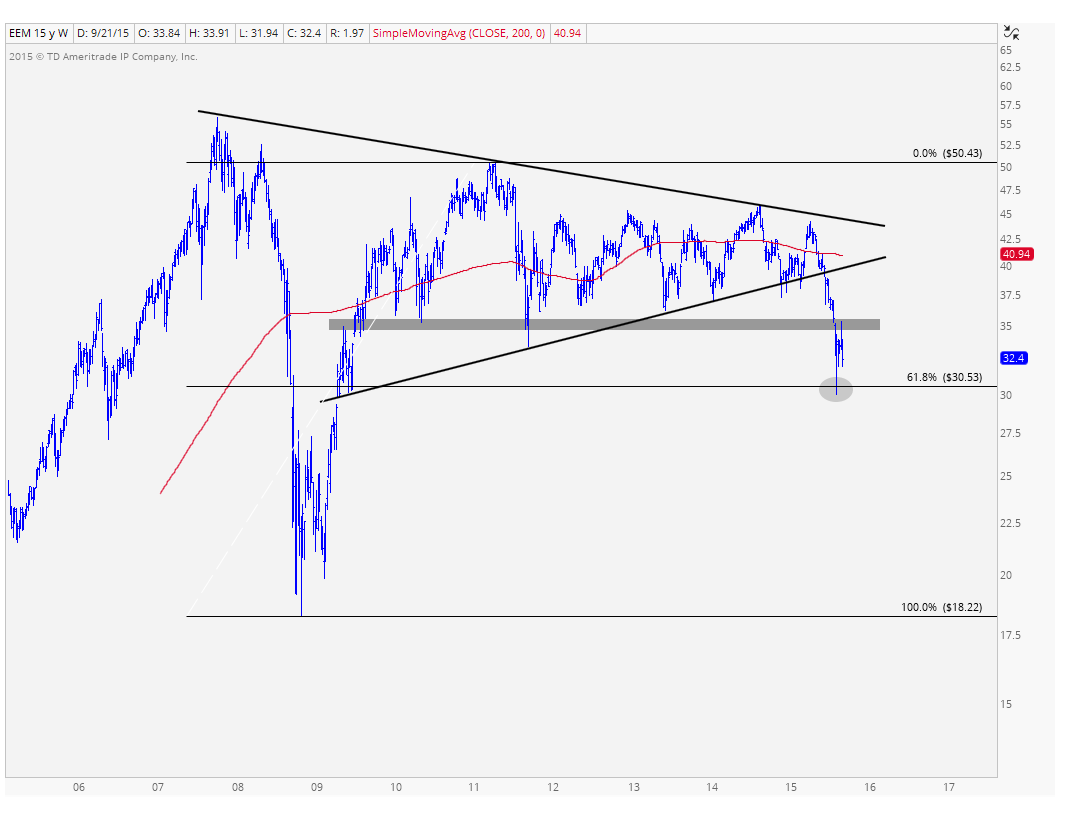
Notice how on that breakdown in August, prices were able to hold on to the 61.8% Fibonacci retracement of the entire 2008-2011 rally. Although finding support near that level was a positive, it’s what we have to worry about going forward that has me concerned. All of that former support that broke over the past few months is now overhead supply. This has been a common theme I’ve been pointing out here in the U.S. stock market. The same problem can be seen in Emerging Markets.
Here is a closer look at the breakdown in EM over the past couple of months. Look at all of that overhead supply that is now going to be a problem going forward. On any strength into that level near $37, the sellers are just sitting there waiting to sell to you. This is the, “Please just get me back to break even” crowd that is holding on to all of this supply. In my opinion, this is simply way too much supply to absorb in the near term and a sustainable rally in Emerging Markets is likely not happening any time soon. This is definitely a ‘sell strength’ market, particularly towards $37.
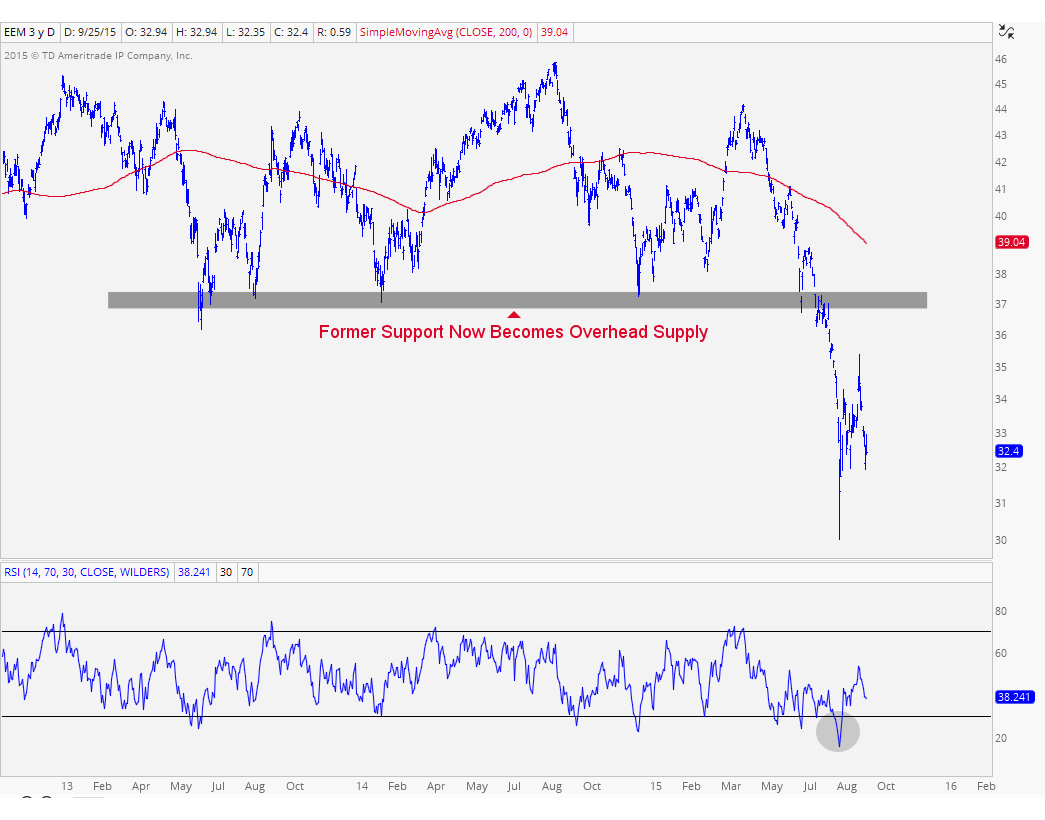
In this chart above I also included a 200 day simple moving average. When prices are trading below these downward sloping smoothing mechanisms, especially one as long as 200 days, we know the intermediate term trend is still down. In addition, look at momentum plotted down below. We are looking at a 14-day RSI hitting oversold conditions. This is characteristic of a downtrend and we haven’t even put any bullish divergences to suggest a sustainable rally could be coming.
I see nothing to like here and all signs are pointing to lower levels. The best way to take advantage of this, in my opinion, is to sell strength, particularly above $36 if we get up there. I’m not suggesting we’re getting a rally to those heights, but if we do, I think it’s a sell. The original shorting opportunity came a few months ago. So I think ‘sell strength’ is the dominant theme here that we want to focus on.
Related Posts:
Overhead Supply in the Dow Components
Overhead Supply in Healthcare & Biotechs
The Problem Now Is Overhead Supply
***
Click Here to receive weekly updates on each of these charts along with 80 charts of foreign stock market ETFs from all over the world, including Japan, China, Europe, Latin America and South Pacific.

Tags: $EEM $SPY $FXI $EWY $RSX $EWZ $ILF $EPI $EWW
Are Emerging Markets In Trouble?
Last week we were focused on Emerging Markets falling to fresh 10-year lows relative to the S&P500. We are now hitting levels not seen since 2004 when you compare the MSCI Emerging Markets Index ETF $EEM with the S&P500 ETF $SPY. We know it’s a disaster, not a secret. But today I want to take a look at emerging markets on their own. We’ve seen this group trading in a sideways frustrating range for almost 6 years while U.S. Equities have exploded higher to all-time highs.
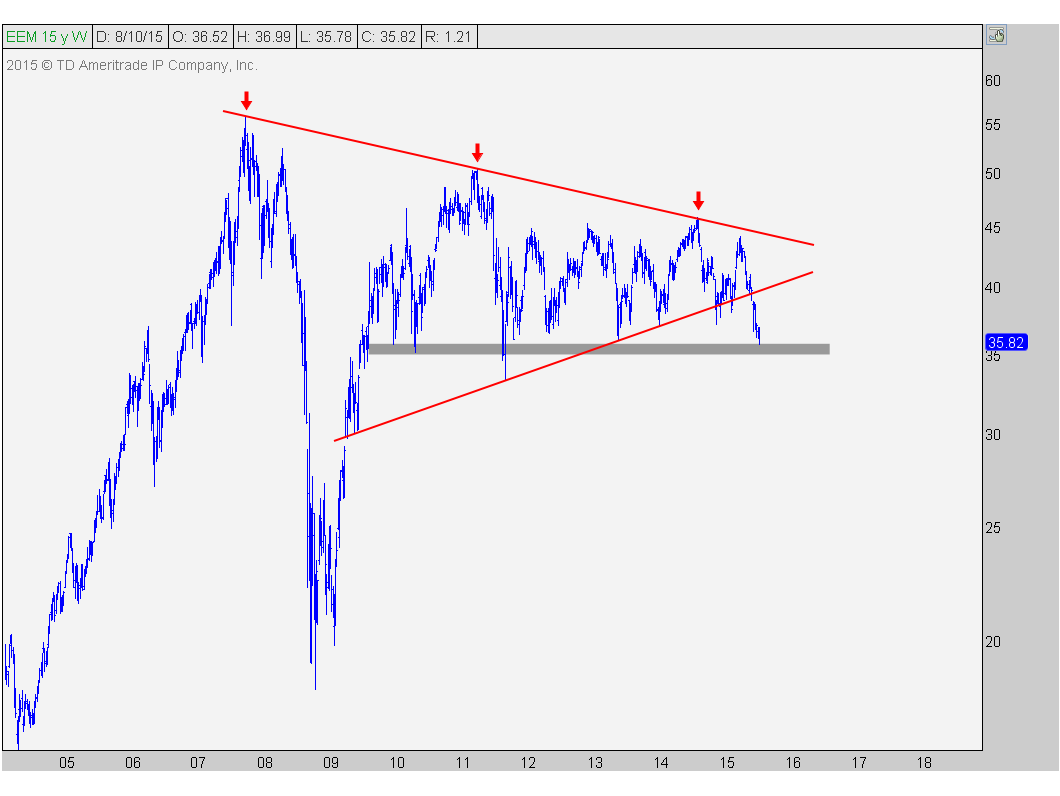
Here is a weekly chart of the MSCI Emerging Markets ETF $EEM breaking down below the lower of these two converging trendlines since 2009 and now testing the key support that has held for the past 5 years. The underperformance relative to the U.S. and the rest of the world, mentioned before, was warning #1. The break of the lower of the two uptrend lines was warning #2. And now we are here at the most important support level we can come up with on this chart:
Bigger picture emerging markets look terrible. It’s hard for me to make an argument against that. So for a more tactical perspective, we turn to the shorter-term charts. Here are the daily candlesticks with a 200 day simple moving average, that we use mostly for trend recognition, and a 14-day relative strength index for momentum readings:
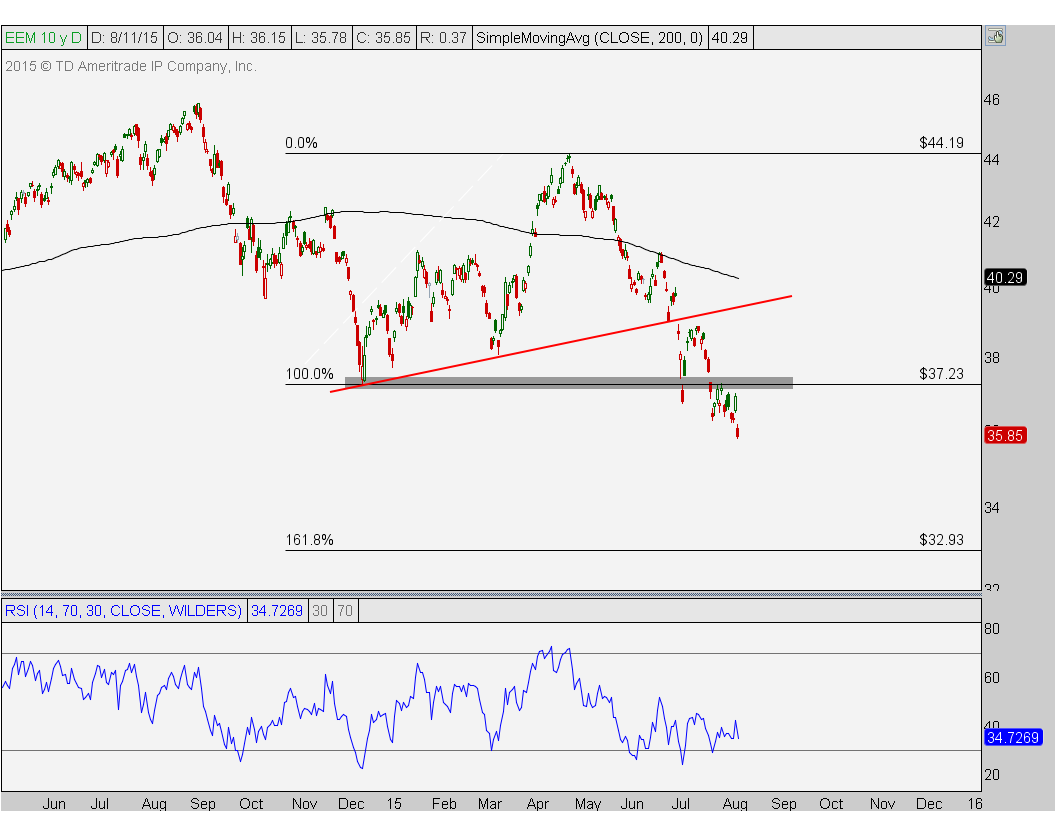
We have broken the uptrend line from the lows in December. Over the past few weeks, prices have now broken support from those December lows. Momentum is hitting oversold conditions which is a characteristic of a downtrend, and therefore confirming everything price is already signaling. Price target-wise, I’m looking at that 33 level which represents the 161.8% Fibonacci extension of that entire December-April rally.
So how do we execute? Well with that downward sloping 200 day moving average and prices breaking all kinds of support levels, I am definitely in a sell any and all strength mode, especially if we somehow get back up towards 38-39, although I doubt we get up there any time soon. I would only want to be short here tactically if we are below the December lows and more neutral above that level. Target-wise, I would be covering tactical shorts under 33, which is still a long way down from here.
This is a messy market, both short-term and long-term. The underperformance really stands out, especially with fresh support levels breaking down.
***
Click Here for more information on our Premium Technical Research Packages

Tags: $EEM $SPY $EWT $EWY $FXI $EWM $RSX $EWZ $EWW $ILF $EPI
Latin America Hits 9-Year Lows vs Emerging Markets
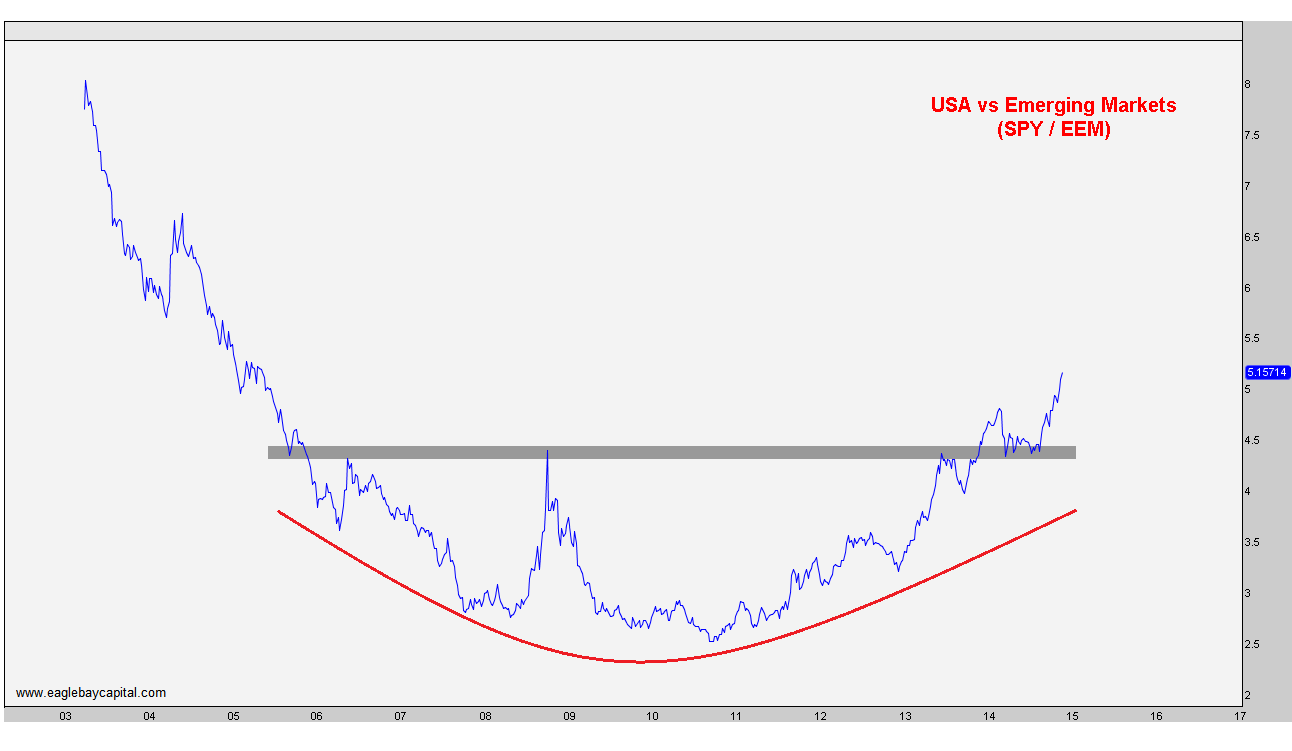
One of the biggest themes for me over the past few years has been the consistent underperformance out of Emerging Markets relative to U.S. Stocks. This is the exact opposite of what had been such a nice trend for so many years. From 2003-2007 Emerging Markets were where you wanted to be, and not the United States. But since then we have seen a tremendous bottoming out of that trend where now it’s the US hitting fresh 9-year highs relative to Emerging Markets and it’s Latin America that is a big part of the reason for this struggle.
First of all, here is a long-term chart of the S&P500 vs Emerging Markets. We are using SPY to represent the U.S. and EEM to represent the MSCI Emerging Markets Index, which consists of 21 Emerging Market countries. These include China, South Korea, Taiwan, India, Brazil etc. Look at the nice bottoming process and structural breakout (and successful retest) earlier this year:
Next, here is the chart of Latin America vs Emerging Markets. We are using ILF which represents the S&P Latin America 40 Index which has 52% Exposure in Brazil, 30% in Mexico and the rest split between Chile, Peru, Colombia etc. Notice how we are currently hitting levels in this spread not seen since 2005:
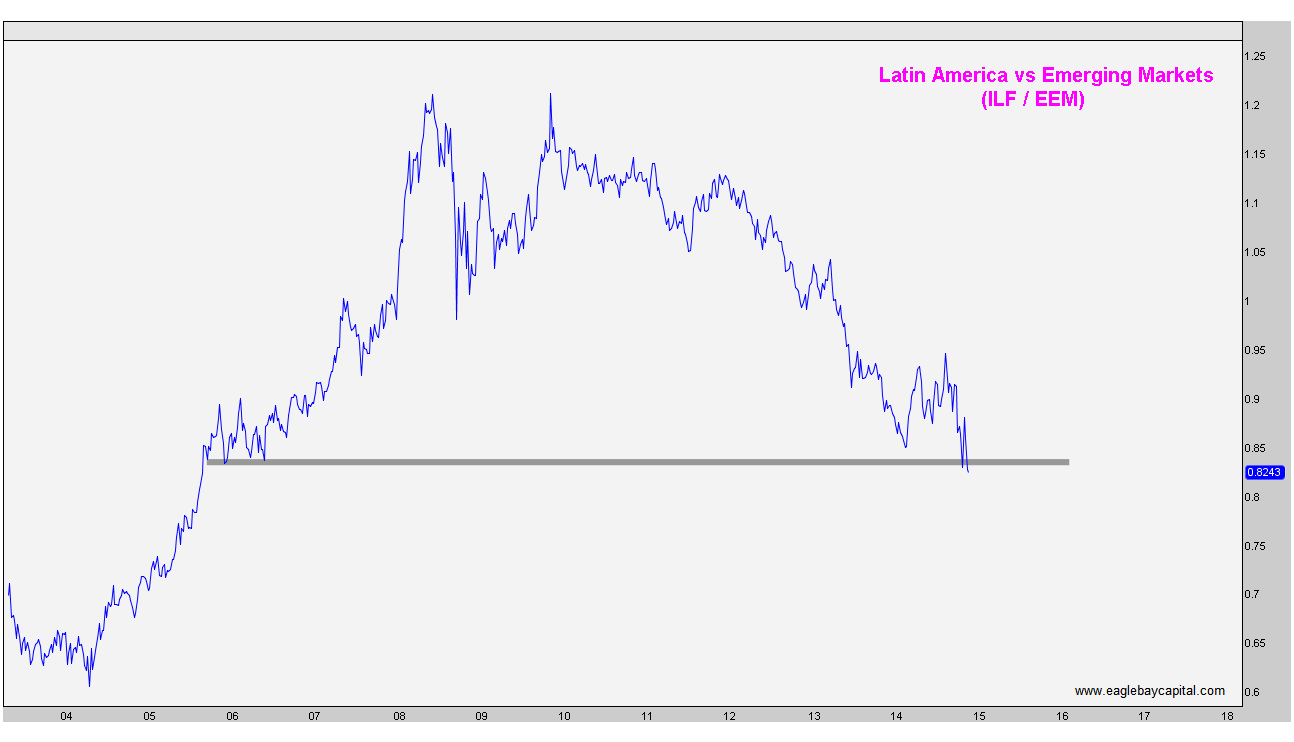
The point of this ratio analysis is for us to get a structural perspective on where money is flowing. I’m not controlling Billions of Dollars (yet), but those that do move markets in trends like these. It takes time for a cruise ship to turn around; it’s a process. Same thing with Billions, or sometimes Trillions, of Dollars. Seeing these shifts in money flow and huge structural reversals like these are evidence of that shift in money flow. I think these trends are likely here to stay for now and see little reason to believe that emerging markets are where we want to be, particularly on a relative basis.
These are some bigger picture trends that I wanted to point out, but Members of Eagle Bay Solutions receive updates on these charts on a weekly basis, which also includes shorter-term tactical analysis. Make sure you’re registered to receive our Weekly Global Reports.

Tags: $SPY $ILF $EEM $EWZ $EWW $FXI $EWY $EWT $EPI
Emerging Markets Break 2014 Uptrend Line
One of the standout losers to start the week has to be Emerging Markets. We’ve been watching this space closely ever since the failed breakout to new 52-week highs earlier this month. Whenever we see those, the opportunities that develop can provide us with very favorable risk/rewards.
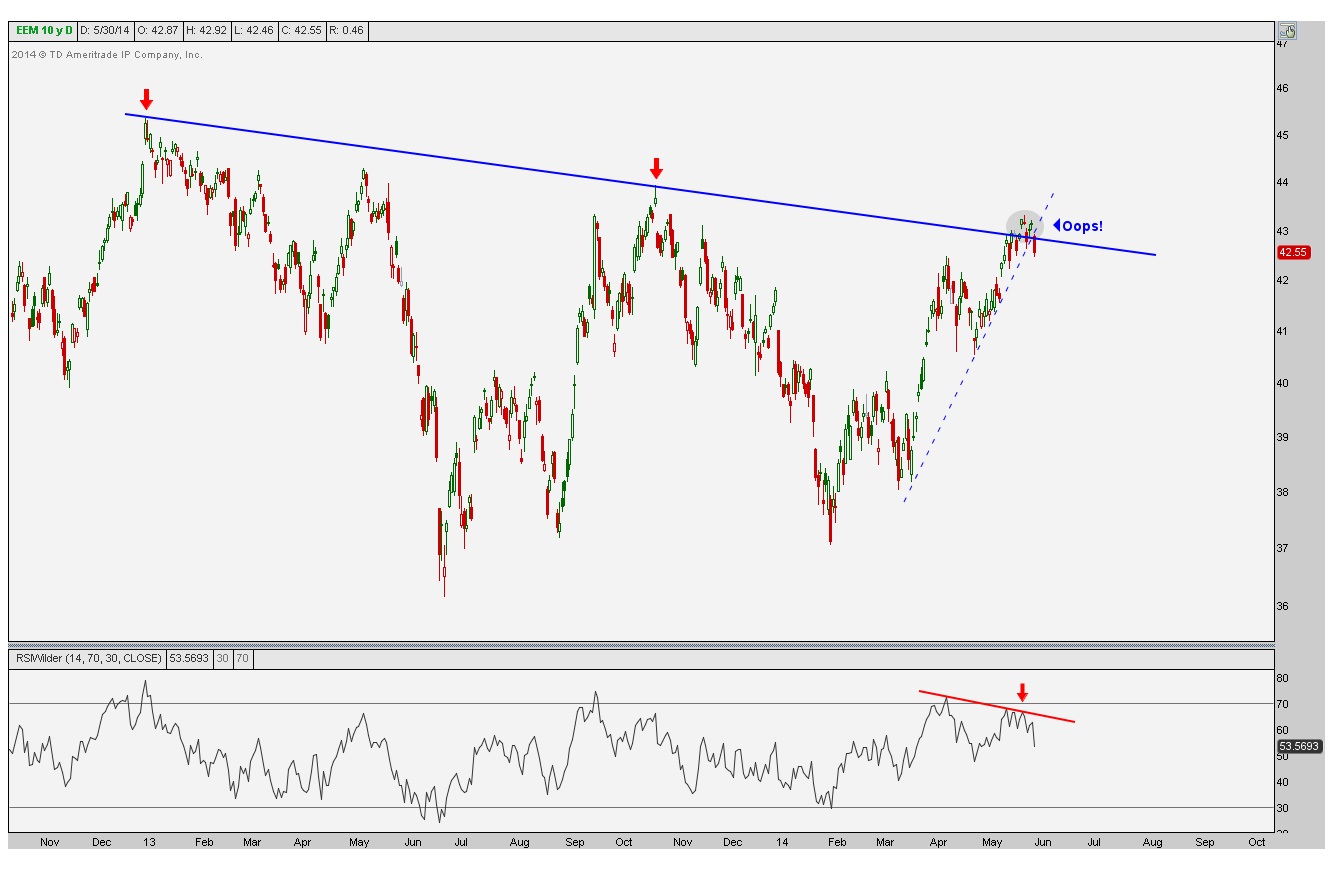
Today we are going to focus on the daily bar chart of $EEM which is the iShares ETF that represents the MSCI Emerging Markets Index. This Index has heavy exposure in China (17%), South Korea (15%) and the rest in places like Taiwan (12%), Brazil (10%), South Africa (7%), India (6%), Russia (5%), Mexico (4%), etc.
Take a look at the failed breakout earlier this month. This is just another one of the million examples of the fast moves that come from failed moves. The problem that I see here is that not only are we entering the week breaking the uptrend line from the 2014 lows, but also key support from the lows in June and August:
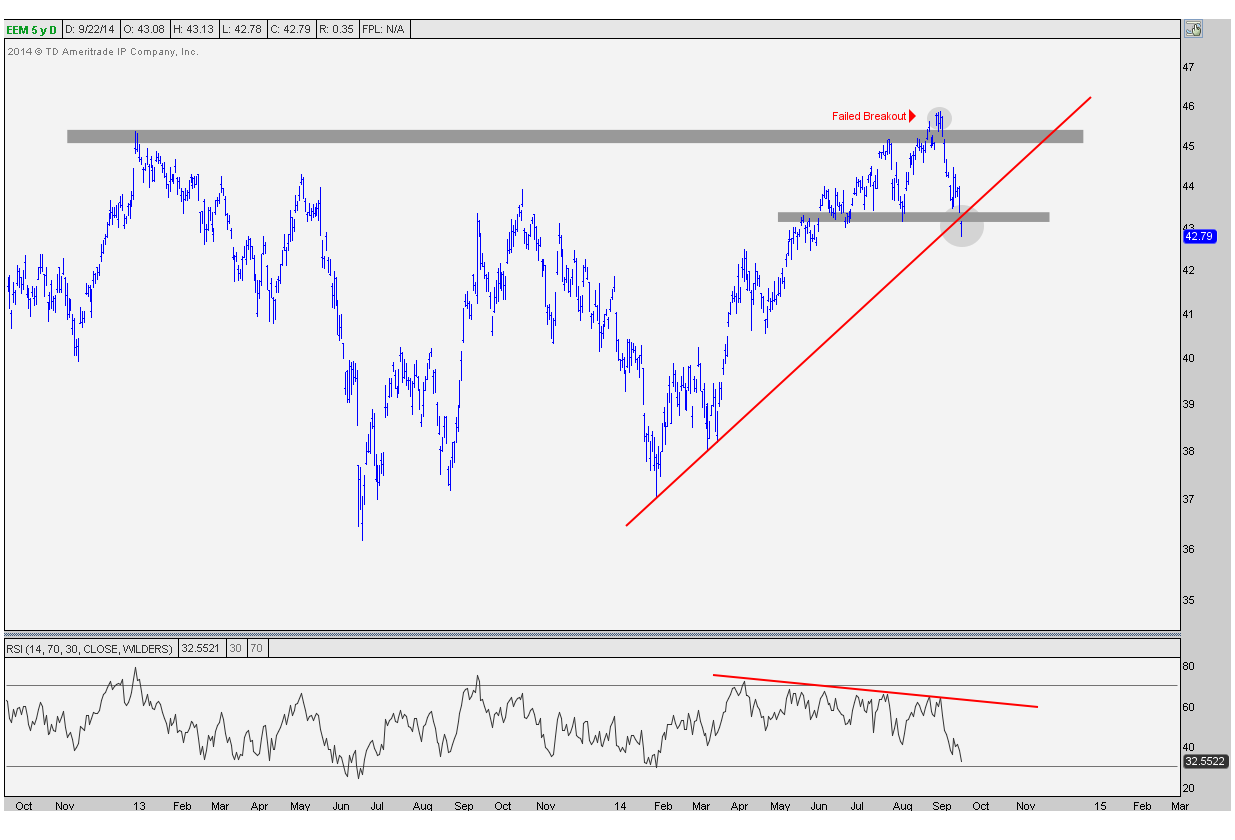
Notice the bearish divergence in momentum as RSI failed to confirm any of the new highs in price throughout the summer. Momentum was warning us of a problem, and prices now seem to be confirming. I would say that to invalidate any of this negative action, I would want to see prices rally back above 43.50 without RSI reaching oversold conditions. But other than that, it looks like lower prices are coming.
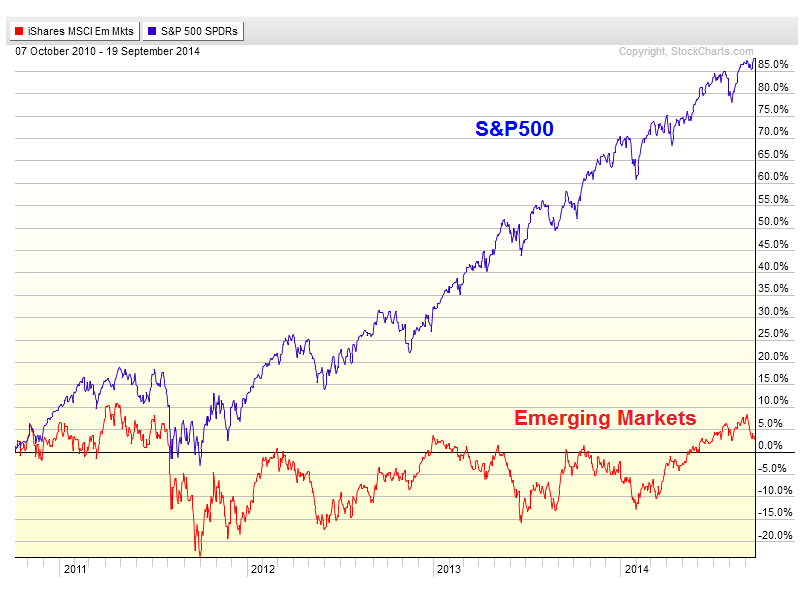
Moving on to Emerging Markets on a relative basis, we are talking about a group of stocks that have been dramatically underperforming the US Stock Market for basically 4 years. Look at the difference in performance since the end of 2010:
Finally, here is a ratio chart of Emerging Markets relative to the S&P500 (EEM/SPY). Look at prices rallying back to former support last year and failing to ever break through. Now we are breaking uptrend lines and former support from throughout 2014. I don’t see anything to like here on a relative basis:
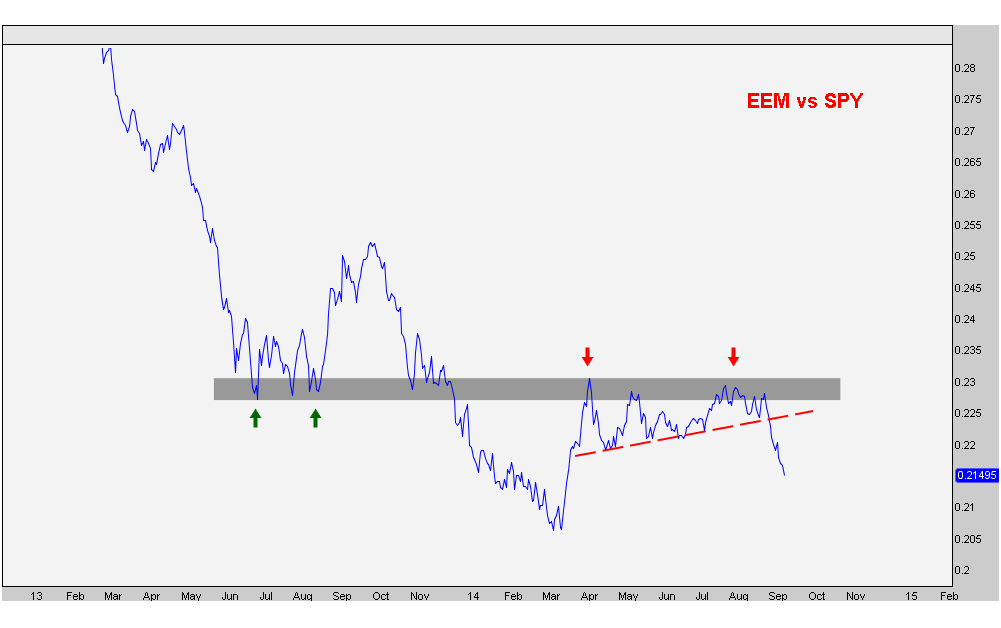
Trends are trending. Emerging markets can’t get out of their own way. I’ve set some parameters that would change my mind and make me more neutral in this space. But I think any of these positive outcomes are the lower probability scenarios. Nevertheless, it is important to recognize all possibilities.
I will continue to view the EM space negatively and will keep selling strength. There are some individual emerging countries that look better than others. But as a group, this is not somewhere we want to be in from the long side.
***
This week we are launching our Global Macro package that includes weekly updates on these charts mentioned above as well as 40 other individual country ETFs on multiple time frames (EWZ, EWG, EPI, EWC, EWA, etc). Email info@eaglebaycapital.com if you are interested in this new package.
![]()
Tags: $EEM $RSX $FXI $EWY $EWT $EWZ $SPY $EWW
Emerging Markets Fail at a Critical Level
We’ve seen an nice little rally in a lot of these emerging markets over the past few months. But let’s remember that this recent strength has come within the context of a 5 year consolidation consisting of lower highs and higher lows since 2009. I would expect that the resolution out of this pattern will lead to an explosive move. But for now, I just want to take a look at what’s happened over the last few weeks.
Here is a daily candlestick chart of the iShares MSCI Emerging Markets ETF $EEM showing prices rallying into this 18-month downtrend line. What bothers me about the recent behavior is the inability to hold above this downtrend line. After attempting to break out, prices fell last Friday back below key levels:
Click Chart to Embiggen
While prices were failing above that broken resistance, momentum was simultaneously putting in a lower high. This bearish divergence at key resistance stands out to me, especially with this potential false move from last week.
From a tactical perspective, short sellers can use 43.30 as the line in the sand. We would not want to be short above that price. For more optimistic participants, a breakout above those levels would be really impressive. Prices would then confirm higher highs above this downtrend line and the bearish divergence would be invalidated.
I think what’s currently going on in this space is a great example of the power of the if/then. Although you constantly hear in the media how there is, “too much uncertainty”, the truth is that there is never any certainty. That’s just a buzz word they like to use to get the viewers’/readers’ attention. As market participants, we know there is never any certainty at all. This is a good example in my view.
Stay tuned. This could get interesting….
Also See:
Not All Emerging Markets Are Created Equal (March 5, 2014)
Tags: $EEM $EWY $FXI $EPI $RSX $EWZ
South Korea Looks Vulnerable
We like to look to all areas of the globe for our equity allocations. In some cases there are markets that look strong, but there are others that look weak and vulnerable for further correction. One area that we’re concerned with is South Korea. After a potential breakout this past December, the index failed hard and peaked on the last trading day of the year.
This is a daily bar chart of the iShares MSCI South Korea Fund ($EWY). It’s easy to notice the false breakout that then led to the uptrend line break to start the 2nd quarter. At this point, it looks like we’re below key support levels in an already broken market. Without a swift recovery right here, I would expect further deterioration in this space in Q2.
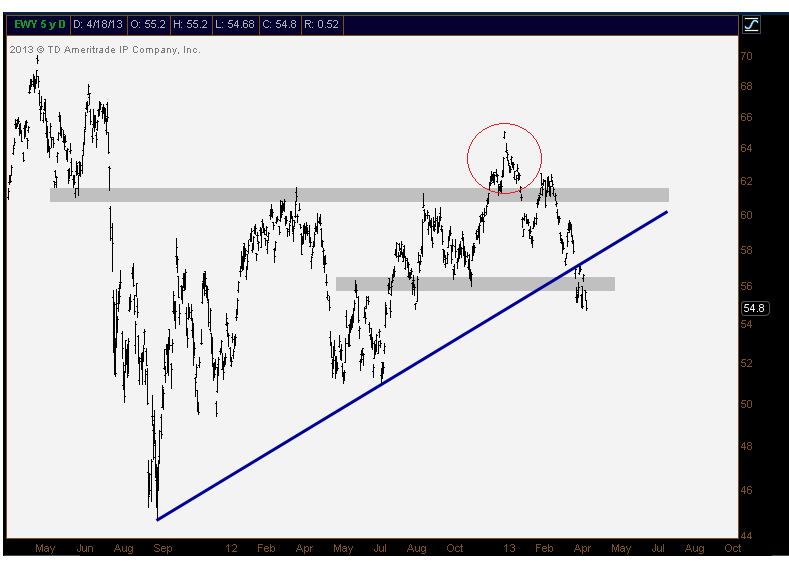
Last Summer’s lows would be the next level of support followed by the Fall of 2011 lows. We will continue to evaluate South Korea going forward, but it is certainly on our “weak and vulnerable” list from around the world. We would have to consolidate right here for some time and/or get back above this broken support for us to even consider it to the long side. But right now, that does not seem like a high probability outcome.
Also, I think it’s important to keep in mind that Samsung Electronics represents almost a quarter of this entire index.
Tags: $SSNLF $EWY