This weekend I did my regular global macro review. This is when I go country by country analyzing the weekly and daily charts of all of the stock markets around the world. Each chart includes a momentum study (14-period RSI) and a 200 period moving average that we use to help with trend recognition. I trade indexes all over the world, simply because I can. Why wouldn’t I? [Read more…]
Pairs, Pairs, They’re Good for Your Heart
Before the 62,197 articles and blog posts get written about this market correction, let me throw a few things out there. First of all, it’s nice to see this market pull back a bit. I bet there are a lot of “traders” turning into “investors” and waiting for their crack stocks to come back. If you’re one of those, you deserve to lose money and let this be a lesson. If you had your stop and got out, knowing your risk tolerance ahead of time, good for you. That’s the way it’s done.
With that said, here is the tweet of the day:
Every successful trader I know decides EXACTLY how much they’re willing to lose BEFORE entering a trade. $STUDY
— DarvasTrader.com (@DarvasTrader) June 5, 2013
It’s not about how much money you make. You can’t control how high a stock you just bought can go up, or how low a stock you shorted can go down. There isn’t any amount of home work you can do, or time you can spend starring at the screen that will help a stock do what you want it to do. It’s out of your control. The only thing you can do is limit the amount of risk that you take. That is literally the only power you have. So before we enter any order, we know almost to the penny, how much money is at stake, worst case scenario.
Alright fine, that’s great and everything, but now what? I mentioned on Friday that if 1635 S&P support was taken out, then I would expect some further consolidation, either through price or though time. I still don’t know which one of those two it will be but I am fairly certain it should be a healthy combination of both. So I think directional bets, both bullish and bearish, aren’t (and haven’t been) worth the risk. Whipsaws in both directions are probably the norm for now.
So the majority of our exposure, as it’s been for a few weeks, is in pairs where we have the same amount of money in a long as we do in a short. Not all of these will work, but they will be much less affected by ups and downs in the S&P500 than an outright long or short. We mentioned a few pairs that have been working in a recent blog post. But some have not been. Last Friday, Phil and I discussed a pair that we started putting on where we went long Biotechs and short Staples against it. As well as that looked closing out the week, it smacked us right in the face and we’ve gotten out and moved on. It happens. And it will happen again. But risk tolerance right? See Paragraph 1.
Outside the US, there are a few pairs around the globe that we’ve put on that have been working so far. And they don’t have any significant correlations with S&Ps either. For example, we’ve been long Poland and Italy, while being short France and Switzerland. Out in the pacific, Malaysia is making new highs against Singapore and New Zealand is making new highs against Australia. And there are other crosses out there working that we don’t have on but are watching closely.
Within the US there is plenty happening as well. But obviously I can’t share everything that we’re doing. And the point of this post isn’t to talk up my book. It’s to point out that when markets get discombobulated (yes that’s a technical term) there are plenty of opportunities out there: outperformances and underperformances to take advantage of. So think of this as, not me telling you what we’re doing, but more as a reminder that the US Dollar doesn’t always have to be your denominator. In other words, there is opportunity risk, as well as market risk (especially in this sort environment) by not have another side to a trade
Just my two cents….
You can go carry on with your “market goes up every tuesday” articles or whatever it is you’re reading these days.
I’m going to go mentally prepare for my NBA Finals Game 1 tomorrow….
Tags: $EPOL $EWI $EWQ $EWL $ENZL $EWA $EWM $EWS $XBI $XLP
Talking Markets With Joe Fahmy
My buddy Joe Fahmy was nice enough to have me over to his office this evening to chat about the markets. Since we have the technology, we figured we should record it. Here’s how the video came out:
Make sure to follow Joe on Stocktwits & Twitter @jfahmy
Also check it his blog The Next Big Move
Tags: $FEZ $EWG $EWQ $EWD $ILF $EWW $EWZ $EPU $GXG $EPOL $DXJ $EPHE $EWM $EIDO $EEM
German DAX Hits 4-month Lows
We shouldn’t be surprised that the relentless selling in Europe has now moved into the “quality” areas of the region. Germany, theoretically the safest place in Europe, had been able to avoid most of the selling taking place in countries like Greece and Italy. But apparently this is no longer the case. Germany is now flirting with some key support levels that should not break if they plan on continuing with this “bull market”.
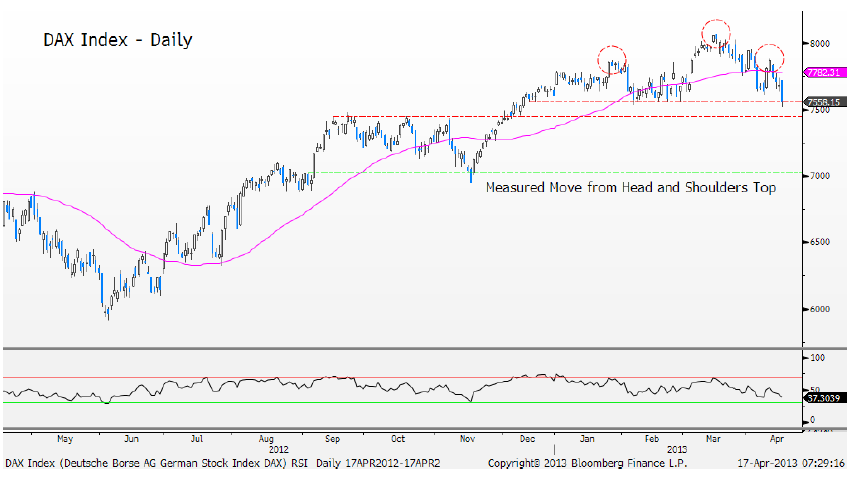
Today’s chart comes from my pal Jonathan Krinsky over at Miller Tabak:
“Arguably the strongest European index, Germany’s DAX, is currently at the lowest level since mid-December 2012. Price is beneath a 50 DMA that is clearly declining, and the case could be made that it is breaking the neckline of a head and shoulders top. There should be good support at the 7450 level, but losing that implies a fulfillment of the measured move down to the 7050 level.”
(click chart to embiggen)
“It doesn’t get much better for France’s CAC index, which is breaking a nearly 1 year uptrend line today. There should be good horizontal support just below at the 3600 level, but the bigger issue appears to be more of a medium-term topping pattern”
I think he brings up some good points. From a structural perspective, it’s important to note that Germany, “the quality”, is now having trouble avoiding the selling taking place out there, and around the world for that matter. We’ll be watching these support levels, but they look really vulnerable if you ask me.
Tags: $DAX $EWG $EWQ $CAC40
Seriously, What’s Europe’s Problem?
I mean, we’re just trying to have a nice little bull market over here in the U.S., minding our own business, and they gotta go underperform and diverge to ruin all the fun. Seriously though, what’s Europe’s problem?
OK just kidding. But not really.
I think I’ve been pretty vocal over the last month or so about the underperformance in Europe. I’m not going to link to posts or tweets or anything, you can go back and find them if you want. That’s not the point of this. Today I want to pull up a very simple chart of the Euro Stoxx 50 Fund to look at, not only how broken it has become, but also how vulnerable its condition was coming into this weekend.
Here is a daily bar chart of “The FEZ” as we like to call it at our shop. I remember the original breakdown like it was yesterday. It was February 4th and I had just woken up in a New Orleans hotel room after a memorable night at the Super Dome. I was extra dehydrated that morning (can’t imagine why). And European averages were getting destroyed. Germany was down 3.6%, France down 4%, Spain down 5.3%, Italy down 5.8%, the entire Euro Stoxx 50 down 4.5%. The list goes on and on. And I said to myself, “this is not bull market behavior”. And it certainly wasn’t. Healthy stocks and assets don’t get smacked in the face like that overnight (yes this all happened overnight). And by the way, Emerging markets were getting smoked that day also, but that’s another discussion for another day. Let’s stick with Europe for now:
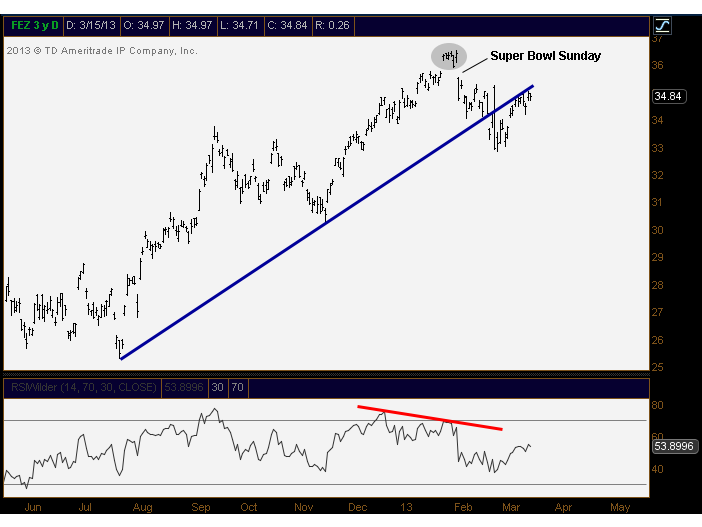
You can see that there was an island reversal of sorts created on that Monday morning breakdown after the Super Bowl. Along with that came a bearish divergence in the Relative Strength Index. As prices made fresh highs into that “island”, if you will, momentum was already rolling over. This is shown clearly in the chart above. Go run through a some of the individual countries and you’ll find similar looking charts.
Then a few weeks ago we had that Monday Italian Election fiasco. That day, confirmed a hard breakdown below the uptrend line from last summer’s lows. Again, stocks and assets in bull markets don’t behave like that. They just don’t get crushed in one day the way these have. Italy down 10% in 6 hours? You don’t need to be a technician to know that isn’t bull market behavior.
Now since then, US Markets have continued to rally into historic territory. Investors waving their hands in the air like they just don’t care. And maybe they still don’t. We’ll see. But European markets are vulnerable. They’ve rallied back up towards that broken uptrend line and retested it this past week.
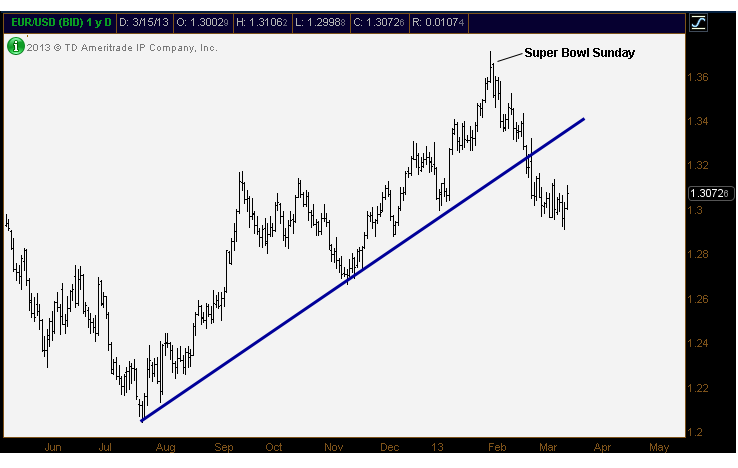
Even the Euro itself peaked on that Super Bowl weekend. Look at $EURUSD Daily bars. You think it’s a coincidence that the currency topped out at the same time that their equities did?
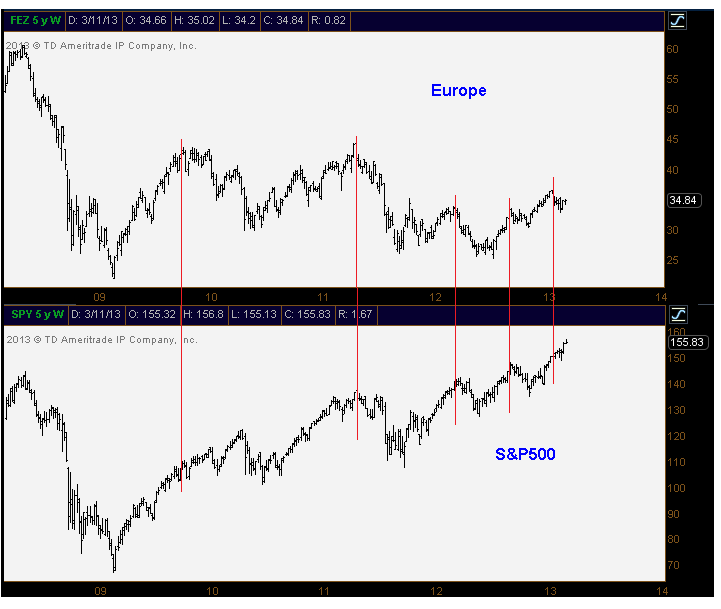
Europe is vulnerable. Not really an opinion, but more of a fact I think. So will the US continue to shrug it off? We haven’t seen the two of them disconnect for this long since 2009. This is a chart comparing the peaks in Europe with those of the US. Typically, Europe tops out first, and then the US gets the memo and rolls over. Well, we’re going on 6 weeks now without the US joining the correction. Will this continue? Or will the US play catch-up?
European stocks better start rallying very soon for none of this to matter technically. And by soon, I mean like right now.
You see what I did there? Didn’t have to mention Cyprus in the entire post.
Tags: $SPY $FEZ $EWP $EWI $EWG $EWQ $EURUSD $FXE
European Underperformance Continues
After a decade of underperformance, I guess we shouldn’t be surprised that European stocks keep struggling when compared to the United States. But I think it is worth noting that even after the monster rally in Europe during the second half of last year, the downtrend relative to the US got going again to start 2013.
With counties like Italy down over 7% year-to-date, Spain flat, Greece down, and the “quality” of Germany and France up barely 1% for the year, it’s no wonder the group is underperforming. Below is a chart of the European Top 100 Stocks vs the S&P500. The decade plus long secular downtrend in this pair seems to be continuing into the new year:
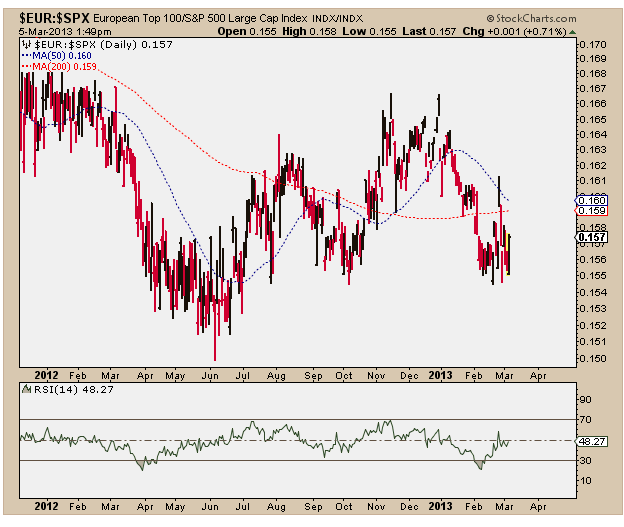
I can’t help but notice how even in the midst of all of that strength in the second half of last year, the relative strength index (RSI) never reached overbought conditions. This is more evidence that the downtrend in European stocks relative to the United States is still intact.
It looks to me like fresh lows are in store here and rallies need to be faded. The weakness in stocks is definitely coming out of Europe.
Tags: $EWG $EWQ $EWI $EWP $GREK $FEZ $SPX
Bearish Divergence Developing in S&Ps
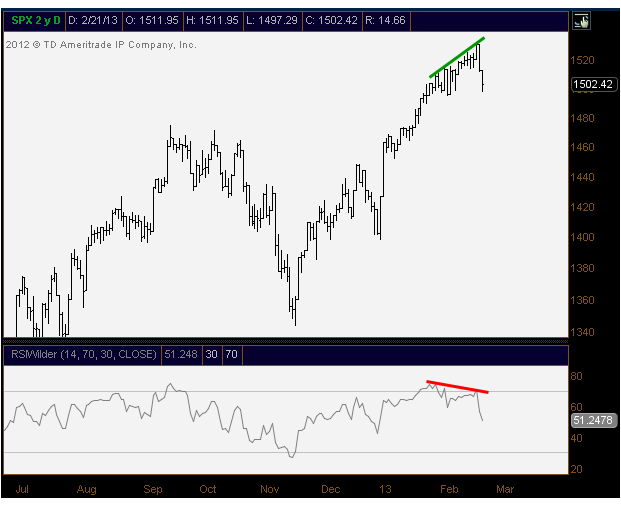
It looks to me like the US Stock market is finally joining this Bearish Divergence party that we’ve seen throughout Europe this year. I think this is a development that is definitely worth paying attention to. You see, when prices in a given asset class make new highs, we also want to see momentum putting in higher highs. When momentum diverges, it’s a heads up that something isn’t right. Think about it, when you throw a tennis ball up in the air, momentum in the speed of the ball is going to slow before it eventually hits its peak and reverses right? Same thing in markets.
In our case, we use the Relative Strength Index (RSI) as our momentum indicator of choice. We saw this oscillator diverge out in Europe throughout January, and we’re currently watching the consequences. The EuroStoxx50 is down over 8% for February. Italy is down over 13% from its January highs, Spain is off more than 10%, and even the “quality”, Germany and France, came off 6% and 7% respectively. All of these following bearish divergences between price and momentum.
Now we’re seeing this develop in the US. Take a look at RSI this week make a much lower high as prices started the week off with fresh highs before rolling over. The divergence is clear and is a major warning sign for us.
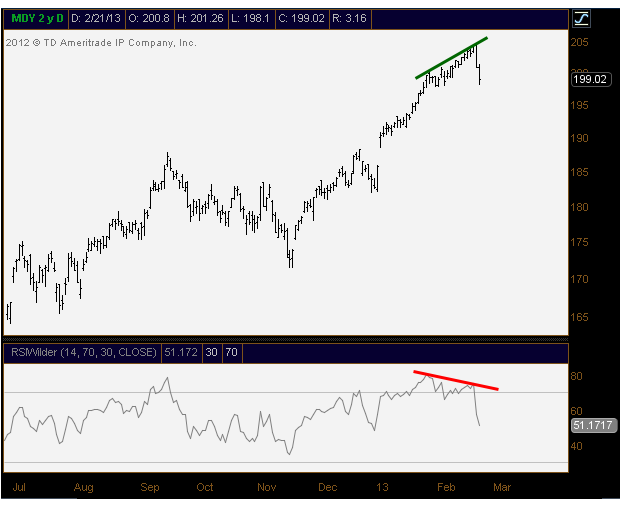
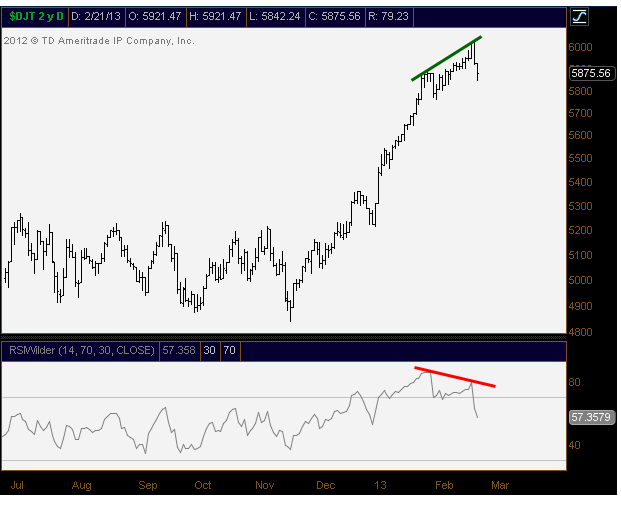
We’re also seeing this development in a few of the other averages. Here are the Midcaps and Transports as two more quick examples:
I think it’s important to point out that this is happening. Last summer we saw the complete opposite occurring. Prices in S&Ps were making new lows into early June while RSI was putting in a higher low. While everyone was worried about Europe splitting up and the S&P500 breaking below the 200 day moving average, momentum was telling us that things were much better than the headlines would represent. In fact, Oil and Precious Metals were putting in Bullish Divergences as well. So I think it’s only fair that we mention the bearish side of it now.
Also see:
Bullish Divergence in Silver (August 14, 2012)
Bullish Divergence in Crude Oil – Bloomberg Radio (June 19, 2012)
Bullish Divergence in Euro, Bearish Divergence in US Dollar (July 17, 2012)
Tags: $MDY $DJT $IYT $SPY $SPX $FEZ $EWG $EWI $EWQ $EWP
Let’s Not Forget About Emerging Europe
As we watch the Germanys and Frances of the world break out to new highs, we wonder how some of the less developed countries are doing out there. Standard and Poors has an Emerging Europe Fund – $GUR with companies like Lukoil from Russia and Turkish Bank Garan. The concept is interesting but the chart is really what screams out.
We’re going on test #5 of this 44.5 – 45.5 level:
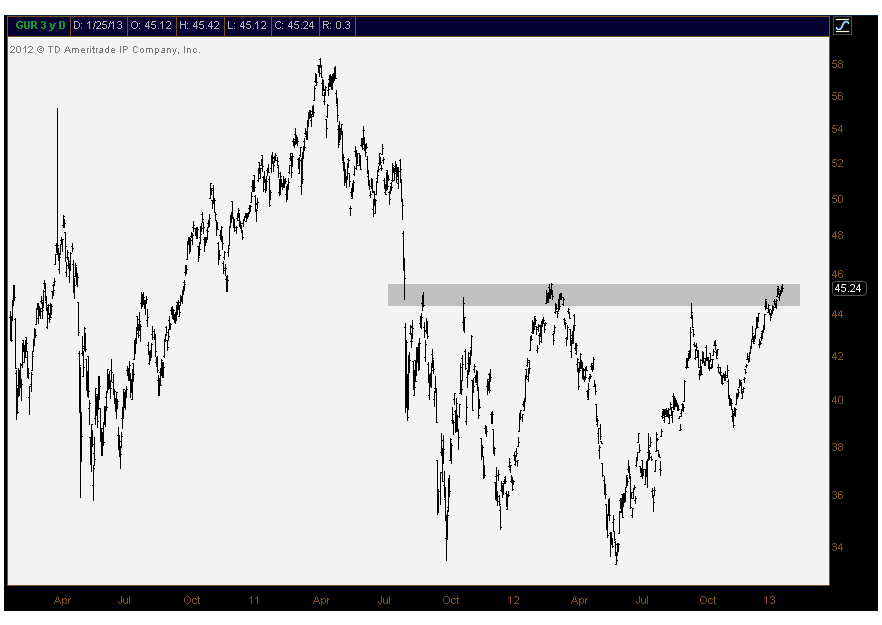
This is basically what Germany and France looked like in early December (see here). So it appears as though inevitably we should see a breakout. The question here is whether they’ve been lagging the others for good reason and will continue to do so? Or whether the emerging areas will be forced to play catch-up and begin to outperform?
Either way, it’s certainly an interesting chart pressing up against some important levels. This is something I don’t think we should ignore.
Tags: $GUR $EWG $EWQ $FEZ