This weekend I did my regular global macro review. This is when I go country by country analyzing the weekly and daily charts of all of the stock markets around the world. Each chart includes a momentum study (14-period RSI) and a 200 period moving average that we use to help with trend recognition. I trade indexes all over the world, simply because I can. Why wouldn’t I? [Read more…]
[Premium] Why Global Markets Are Signaling A Squeeze Higher
Going country by country all over the world is one of the best tools that we have as market participants. The value that I’ve gotten over the years from looking at the behavior of all of the countries, instead of just the U.S. is a huge factor in why I am such a top/down weight-of-the-evidence guy. There are signs of strength and weakness that we see from international markets that might not be so obvious in the S&P500, for example.
Last September, I promise you that the reason I got bullish tactically was not because of what I was seeing in the United States, but what was happening around the world. There were simply too many bullish momentum divergences and downside objective achieved internationally to ignore. Something was up, and in fact, the counter-trend rally that we got in the U.S. actually exceeded my expectations.
Pairs, Pairs, They’re Good for Your Heart
Before the 62,197 articles and blog posts get written about this market correction, let me throw a few things out there. First of all, it’s nice to see this market pull back a bit. I bet there are a lot of “traders” turning into “investors” and waiting for their crack stocks to come back. If you’re one of those, you deserve to lose money and let this be a lesson. If you had your stop and got out, knowing your risk tolerance ahead of time, good for you. That’s the way it’s done.
With that said, here is the tweet of the day:
Every successful trader I know decides EXACTLY how much they’re willing to lose BEFORE entering a trade. $STUDY
— DarvasTrader.com (@DarvasTrader) June 5, 2013
It’s not about how much money you make. You can’t control how high a stock you just bought can go up, or how low a stock you shorted can go down. There isn’t any amount of home work you can do, or time you can spend starring at the screen that will help a stock do what you want it to do. It’s out of your control. The only thing you can do is limit the amount of risk that you take. That is literally the only power you have. So before we enter any order, we know almost to the penny, how much money is at stake, worst case scenario.
Alright fine, that’s great and everything, but now what? I mentioned on Friday that if 1635 S&P support was taken out, then I would expect some further consolidation, either through price or though time. I still don’t know which one of those two it will be but I am fairly certain it should be a healthy combination of both. So I think directional bets, both bullish and bearish, aren’t (and haven’t been) worth the risk. Whipsaws in both directions are probably the norm for now.
So the majority of our exposure, as it’s been for a few weeks, is in pairs where we have the same amount of money in a long as we do in a short. Not all of these will work, but they will be much less affected by ups and downs in the S&P500 than an outright long or short. We mentioned a few pairs that have been working in a recent blog post. But some have not been. Last Friday, Phil and I discussed a pair that we started putting on where we went long Biotechs and short Staples against it. As well as that looked closing out the week, it smacked us right in the face and we’ve gotten out and moved on. It happens. And it will happen again. But risk tolerance right? See Paragraph 1.
Outside the US, there are a few pairs around the globe that we’ve put on that have been working so far. And they don’t have any significant correlations with S&Ps either. For example, we’ve been long Poland and Italy, while being short France and Switzerland. Out in the pacific, Malaysia is making new highs against Singapore and New Zealand is making new highs against Australia. And there are other crosses out there working that we don’t have on but are watching closely.
Within the US there is plenty happening as well. But obviously I can’t share everything that we’re doing. And the point of this post isn’t to talk up my book. It’s to point out that when markets get discombobulated (yes that’s a technical term) there are plenty of opportunities out there: outperformances and underperformances to take advantage of. So think of this as, not me telling you what we’re doing, but more as a reminder that the US Dollar doesn’t always have to be your denominator. In other words, there is opportunity risk, as well as market risk (especially in this sort environment) by not have another side to a trade
Just my two cents….
You can go carry on with your “market goes up every tuesday” articles or whatever it is you’re reading these days.
I’m going to go mentally prepare for my NBA Finals Game 1 tomorrow….
Tags: $EPOL $EWI $EWQ $EWL $ENZL $EWA $EWM $EWS $XBI $XLP
BNN Appearance: Looking at all Markets
I went down to the Nasdaq this morning to talk stocks, bonds and commodities on Business News Network. Check it out:
Source:
Technical Tuesday: A Take on the Trade (BNN)
Tags: $EWS $IDX $EIDO $EPHE $TLT $TNX $IEF TYX $NG_F $CL_F $UNG $USO
Is Singapore the Next One To Go?
In addition to the United States, it’s really been the Asia Pacific region that’s been leading global equities. Obviously Japan has been ripping all year long. But Indonesia, Malaysia, Philippines, and Thailand have been rocking all year as well. Singapore, on the other hand, has just been consolidating sideways for almost 5 months. Until last week.
We’ve been waiting patiently for this one. In early February we were hoping it was time for the breakout. But with European and emerging markets getting slaughtered after the Super Bowl, there just weren’t enough buyers to let her rip. But that was potentially a blessing in disguise. All that it created was an even bigger base, which could lead to an even bigger breakout.
As we discussed in our end of week video, the iShares Singapore ETF finally took out that 14 level and then held it for the rest of the week. This was our line in the sand and continues to be. Here is a daily bar chart of Singapore. As long as we’re above 14, this is an area we want to be involved in.
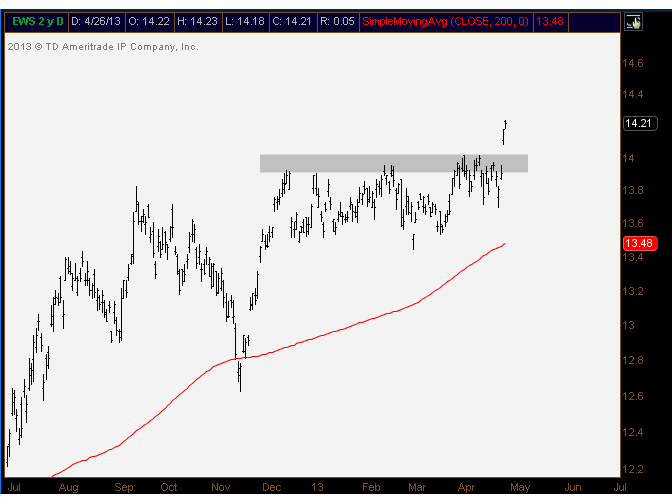
As they say, “the bigger the base, the higher in space”. And this one is coming off a major consolidation. The dividend adjusted chart (it pays a 3.8% yield) is making all-time highs. This area of the world is hot and I think that Singapore is now trying to play catch up.
Tags: $EWS $IDX $EIDO $EWM $DXJ $EWJ $THD $EPHE
End of Week Market Chat
Phil and I did a quick video about the markets after the close Friday. We touched on S&Ps, the continued strength in US Treasuries, and a fresh breakout in Singapore. Check it out:
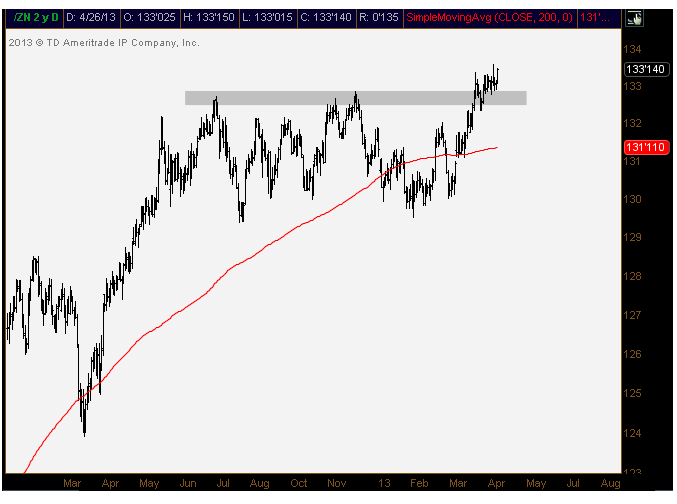
10-year US Treasury futures went out at new highs
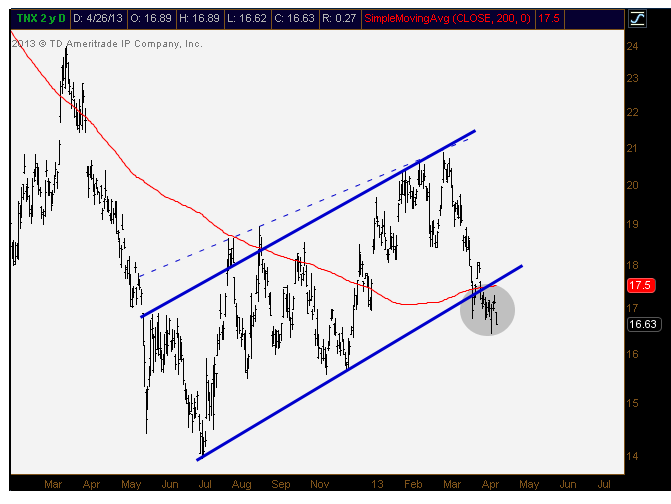
10-year yields at new closing lows for the year
Singapore breaking out
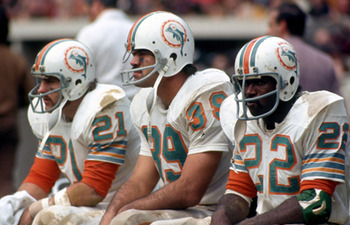
JNJ is now up 17 weeks in a row. Reminded Phil of the Miami Dolphins in 1972 who went 17-0
Tags: $TNX $TLT $IEF $ZN_F $EWS $SPY $JNJ