I went down to the Nasdaq this morning to talk stocks, bonds and commodities on Business News Network. Check it out:
Source:
Technical Tuesday: A Take on the Trade (BNN)
Tags: $EWS $IDX $EIDO $EPHE $TLT $TNX $IEF TYX $NG_F $CL_F $UNG $USO
Expert technical analysis of financial markets by JC Parets
I went down to the Nasdaq this morning to talk stocks, bonds and commodities on Business News Network. Check it out:
Source:
Technical Tuesday: A Take on the Trade (BNN)
Tags: $EWS $IDX $EIDO $EPHE $TLT $TNX $IEF TYX $NG_F $CL_F $UNG $USO
In addition to the United States, it’s really been the Asia Pacific region that’s been leading global equities. Obviously Japan has been ripping all year long. But Indonesia, Malaysia, Philippines, and Thailand have been rocking all year as well. Singapore, on the other hand, has just been consolidating sideways for almost 5 months. Until last week.
We’ve been waiting patiently for this one. In early February we were hoping it was time for the breakout. But with European and emerging markets getting slaughtered after the Super Bowl, there just weren’t enough buyers to let her rip. But that was potentially a blessing in disguise. All that it created was an even bigger base, which could lead to an even bigger breakout.
As we discussed in our end of week video, the iShares Singapore ETF finally took out that 14 level and then held it for the rest of the week. This was our line in the sand and continues to be. Here is a daily bar chart of Singapore. As long as we’re above 14, this is an area we want to be involved in.
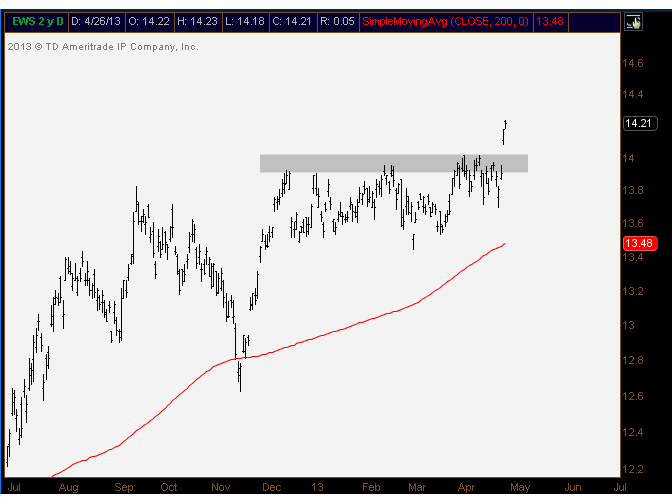
As they say, “the bigger the base, the higher in space”. And this one is coming off a major consolidation. The dividend adjusted chart (it pays a 3.8% yield) is making all-time highs. This area of the world is hot and I think that Singapore is now trying to play catch up.
Tags: $EWS $IDX $EIDO $EWM $DXJ $EWJ $THD $EPHE
There are some important breakdowns taking place that I think are worth nothing. Two areas that I consistently look to for direction, Copper and US Treasury Bond Yields aren’t looking too hot these days. I don’t think it’s a secret as Copper has been selling off relentlessly since Super Bowl Sunday. But treasury yields are now vulnerable too, adding to the divergence between risk assets and US Stocks.
My pal Chris Kimble sent this to me Sunday night:
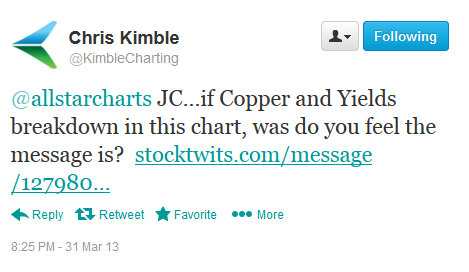
Here are the charts he sent along with his message. As you can see, both Copper and Treasury bond yields (30 & 10 yr) appear extremely vulnerable (click charts to embiggen):
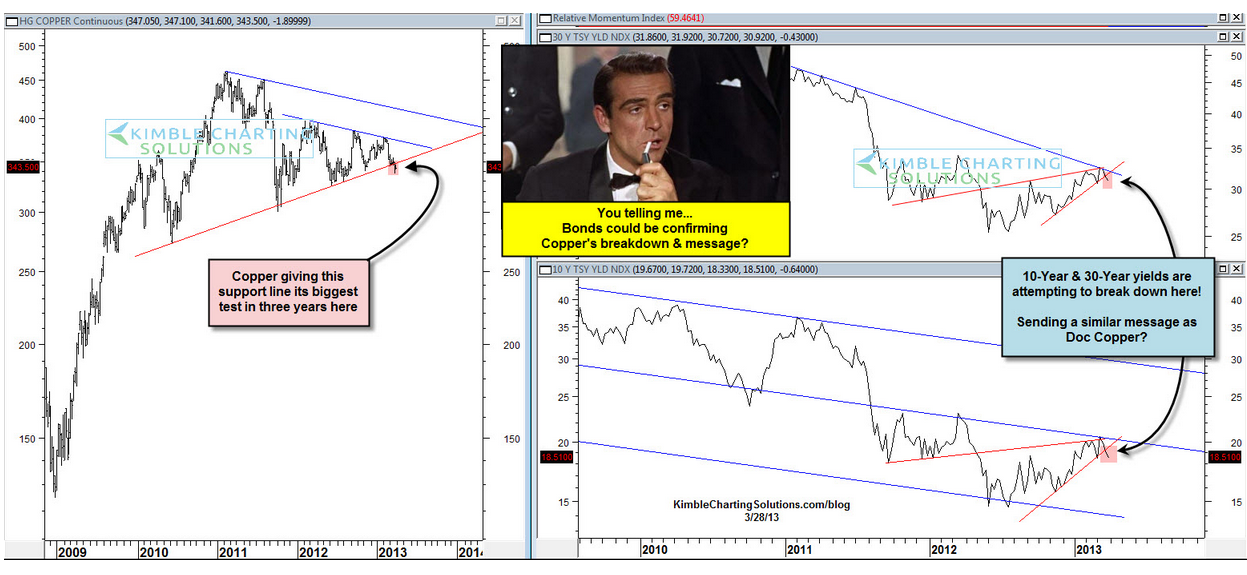
And my answer to his question – What do I feel the message is? – I think it’s telling us to be careful. Very careful.
When it comes to US Stocks, I certainly have been over the past month. And US Stocks keep roaring higher telling me that I should have been leveraged long $SPY instead of picking and choosing where to be. And I’m okay with that. If my biggest mistake in the portfolio is erring on the side of caution, I’m okay with that. There are times to be crazy aggressive long (see here), and there are times to be extra careful. And right or wrong, I think this is one of those times.
So for now, we’ll stick with what we’re doing: selling any strength in Europe and most emerging markets, and picking and choosing where to be in the US. There are also other areas around the world doing well (like Indonesia) and areas acting poorly like Latin America. So sure, the message from bonds and Dr. Copper is to be extra careful. So we’re listening. And I think we all should.
*Make sure you’re following Chris Kimble on Stocktwits and Twitter @KimbleCharting – excellent technician. Been reading his stuff for a long time. Here’s a link to his blog: Kimble Charting Solutions.
Tags: $HG_F $JJC $ZB_F $TLT $TNX $IDX
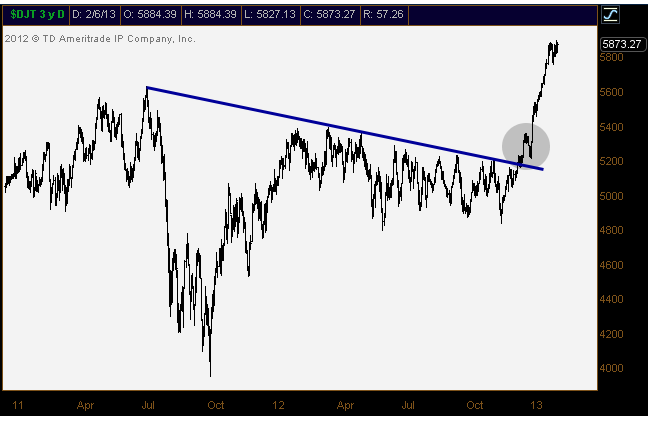
There are certain patterns in markets that get me pumped up. One of them is definitely the long consolidation that fails to breakout in either direction for a sustained period of time. The way I look at it, when something trades in a prolonged, tight range, it’s building momentum for a potentially ultra-powerful move. The breakout in the Dow Jones Transportation Average these past few months is the perfect example. I wrote about the setup in late November for MarketWatch and Transports are up a hefty 18% very quickly. The size of the move is great and everything, but it’s the relentless manner in which it rallied that really proves the point.
On a shorter time frame, Indonesia looks like it might be able to do something similar. I can’t help but notice so many of the similarities between the two setups. The first chart shows what the Dow Jones Transportation Average looked like, and then what it did. Look at the long base that it developed as other markets were already soaring to new highs. Transports had been forgotten about by the time November came around:
The result was great. But more importantly, it is the psychology behind that pattern that I want to emphasize. Now take a look at what Indonesia looks like on a little bit of a shorter term time frame. This is a daily chart of the Market Vectors Indonesia Index:
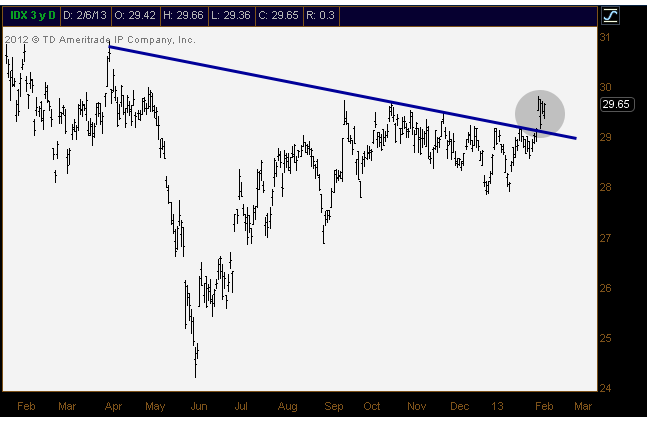
To me it’s the same setup. Maybe $IDX doesn’t have the violent move higher that the Transports just put in. But the potential is certainly there. Indonesia represents one of the top 7 emerging markets behind the BRICs and Mexico, so it should be interesting to see how this one behaves relative to the rest of the group.
I thought this was a cool comparison.
Tags: $IDX $DJT $IYT $EWW $EEM $EIDO