This is the video recording of the September 2nd Town Hall Meeting w/ Willie Delwiche & JC Parets
09/02/21 2PM ET [Read more…]
Expert technical analysis of financial markets by JC Parets
This is the video recording of the September 2nd Town Hall Meeting w/ Willie Delwiche & JC Parets
09/02/21 2PM ET [Read more…]
From the desk of Steve Strazza @sstrazza and Grant Hawkridge @granthawkridge
Last week, we pointed out that some US stocks are going up, but most are not.
The S&P 500 and the other US large-cap indexes have continued to grind to new highs all year, completely unphased by any of the deterioration in breadth beneath the surface.
But, when looking at the global stage, things are different…
From the desk of Willie Delwiche.
According to Charles Darwin, you cannot make observations without some kind of underlying theory. And if you have any theories about financial markets, you understand thinking about what could or should happen with your investments.
These concepts can be useful if they help us prepare for what is happening in the markets. But they can also impede or obscure reality.
We can observe and project all we want — so long as we don’t get distracted by the what could and what should that we lose sight of what is.
I don’t see this as an argument in favor of always being bullish or a warning about the risks of needing to be proven right. Instead, it’s an encouragement to agnostically acknowledge and operate within the market as it is rather than as we wish it would be.
It’s about pursuing the opportunities that are before us even when they are unexpected.
Especially when they are unexpected.
From the desk of Steve Strazza @sstrazza and Louis Sykes @haumicharts
Welcome to our latest RPP Report, where we publish return tables for various asset classes and categories, along with commentary on each.
Looking at the past helps put the future into context. In this post, we review the absolute and relative trends at play and preview some of the things we’re watching to profit in the weeks and months ahead.
We consider this our weekly state of the union address as we break down and reiterate both our tactical and structural outlook on various asset classes and discuss the most important themes and developments currently playing out in markets all around the world.
In our last report, we discussed all the whipsaws we had been witnessing in recent weeks and noted that the next major piece of information would be the velocity of the reactions these charts made in the opposite direction.
Fast forward to today and the bulls got all the follow-through they could want as many risk assets reclaimed all their damage and more. These were true failed breakdowns, and we’re still seeing those fast moves carry on higher today.
But today is a special occasion. We just got new monthly candles. So that’s going to be the focus in this week’s report.
Long story short, we have a lot of failed breakdowns bouncing aggressively off support in the weakest areas. More on that to come in a post soon. At the same time, we have a ton of new highs from the strongest areas.
Let’s talk about some of them now. [Read more…]
From the desk of Steven Strazza @Sstrazza
Check out our latest Mystery Chart!
What we do here is take a chart that’s captured our attention, and remove the x and y-axes as well as any other labels that could help identify it.
This chart can be any security, in any asset class, on any timeframe. Sometimes, it’s an absolute price chart. Other times, it’s on a relative basis.
It might be a ratio, a custom index, or maybe the price is inverted. It could be all three!
The point is, when we aren’t able to recognize what’s in front of us, we put aside any biases we may have and scrutinize the price behavior objectively.
While you can try to guess the chart, the point is to make a decision…
So let us know what it is… Buy, Sell, or Do Nothing?
On September 1st, Sean and JC hopped on a Twitter Live Stream to discuss a recent trade idea for All Star Charts Options Members.
Here’s the play:
“I like an $AMZN February 3800/3900 Bull Call Spread for an approximately $29.00 – $30.00 debit. This means we’ll be long the 3800 strike call and short an equal amount of 3900 strike calls.”
To learn more about the trade and the thinking behind it, click below to watch a replay of the Live Stream. [Read more…]
From the desk of Steve Strazza @Sstrazza
Welcome to the 2 to 100 Club.
As many of you know, something we’ve been working on internally is using various bottom-up tools and scans to complement our top-down approach. It’s really been working for us!
One way we’re doing this is by identifying the strongest growth stocks as they climb the market-cap ladder from small- to mid- to large- and, ultimately, to mega-cap status (over $200B).
Once they graduate from small-cap to mid-cap status (over $2B), they come on our radar. Likewise, when they surpass the roughly $30B mark, they roll off our list.
But the scan doesn’t just end there. We only want to look at the strongest growth industries in the market, as that is typically where these potential 50-baggers come from.
Some of the best performers in recent decades – stocks like Priceline, Amazon, Netflix, Salesforce, and myriad others – would have been on this list at some point during their journey to becoming the market behemoths they are today.
When you look at the stocks in our table, you’ll notice we’re only focused on Technology and Growth industry groups such as Software, Semiconductors, Online Retail, Solar, etc.
Then, like any good technician, we filter the list down to those that are closest to new highs. This allows the cream of these strong groups to rise to the top and helps streamline our mission to identify technical breakouts in the top-performing stocks.
From the desk of Willie Delwiche.
Key Takeaway: Investors continue to favor stocks as money relentlessly pours into equity ETFs. It’s no wonder, given that the main stock indexes are printing new record highs. Yet, a depressed risk appetite and an unsupportive breadth backdrop accompany the persistent push higher in equities. Though these suspect undercurrents aren’t apparent at the index level, we see signs that short-term attitudes are shifting. Bears are on the rise, with the average of the II and AAII bears trending higher. However, pessimism remains relatively mooted and optimism is still elevated when viewed through either a cyclical or strategic lens. The current environment suggests there is more risk than opportunity for equities from a sentiment perspective.
Sentiment Report Chart of the Week: Feel the Flow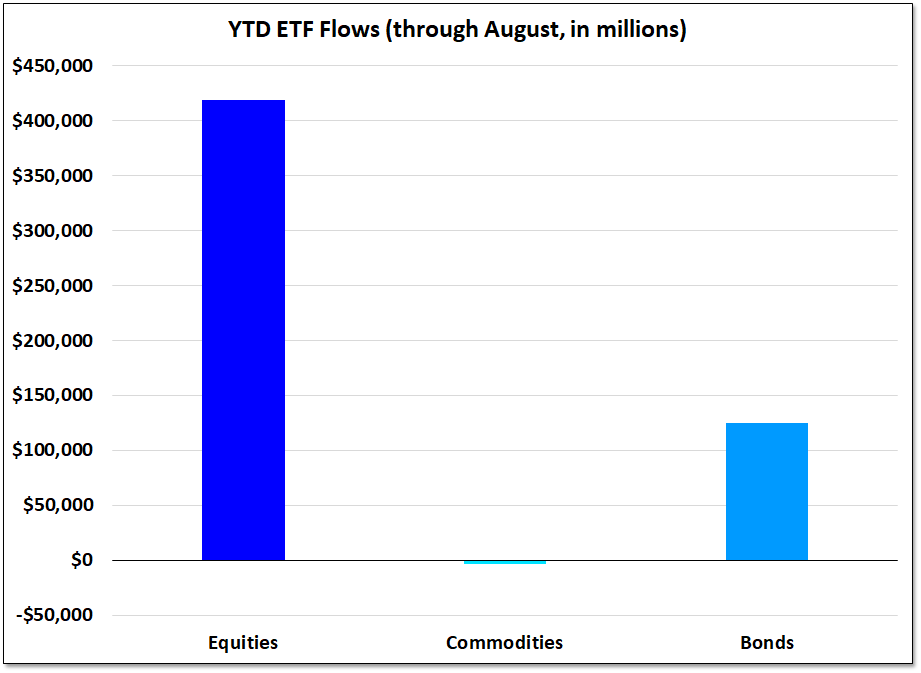
Equity ETFs saw another $50 billion of inflows in August, bringing the YTD total to more than $400 billion. This was the 15th consecutive month of inflows for equities (for a total in that time period of more than $600 billion). Commodity ETFs experienced outflows for the second consecutive month in August. Despite YTD gains that surpass stocks (DBC vs SPY), commodities have experienced net outflows in 2021. It’s true that this is driven by flows out of gold (GLD), but that alone speaks to how unloved commodities remain from an asset allocation perspective.