For this week’s trade, buying $XLI January 130 calls for 35 cents or cheaper.
Get the full details, risk management procedures and targets for this trade here:
Expert technical analysis of financial markets by JC Parets
For this week’s trade, buying $XLI January 130 calls for 35 cents or cheaper.
Get the full details, risk management procedures and targets for this trade here:
From the desk of Willie Delwiche.
Key Takeaway: That investors are in a dour mood is not in doubt. We just saw the fewest bulls on the AAII survey since 1992 and the University of Michigan Consumer Sentiment Index is about as low as it has ever been. This week has brought news that US equity ETF’s have had outflows in three of the past four weeks. If this is just a pause in what some have called the persistent bid fueled by a move toward index investing, then this too is a bullish development. If, on the other hand, it represents the early stages of passive equity investors becoming disgruntled and looking for other options, then consider it a meaningful increase in equity market risk. Time will tell, but price and breadth improvements would help assuage these concerns. Either way, pessimism is a condition that needs a catalyst to spark a rally. It’s a pile of firewood, but for now it remains unlit.
Sentiment Report Chart of the Week: Conditions Need Catalysts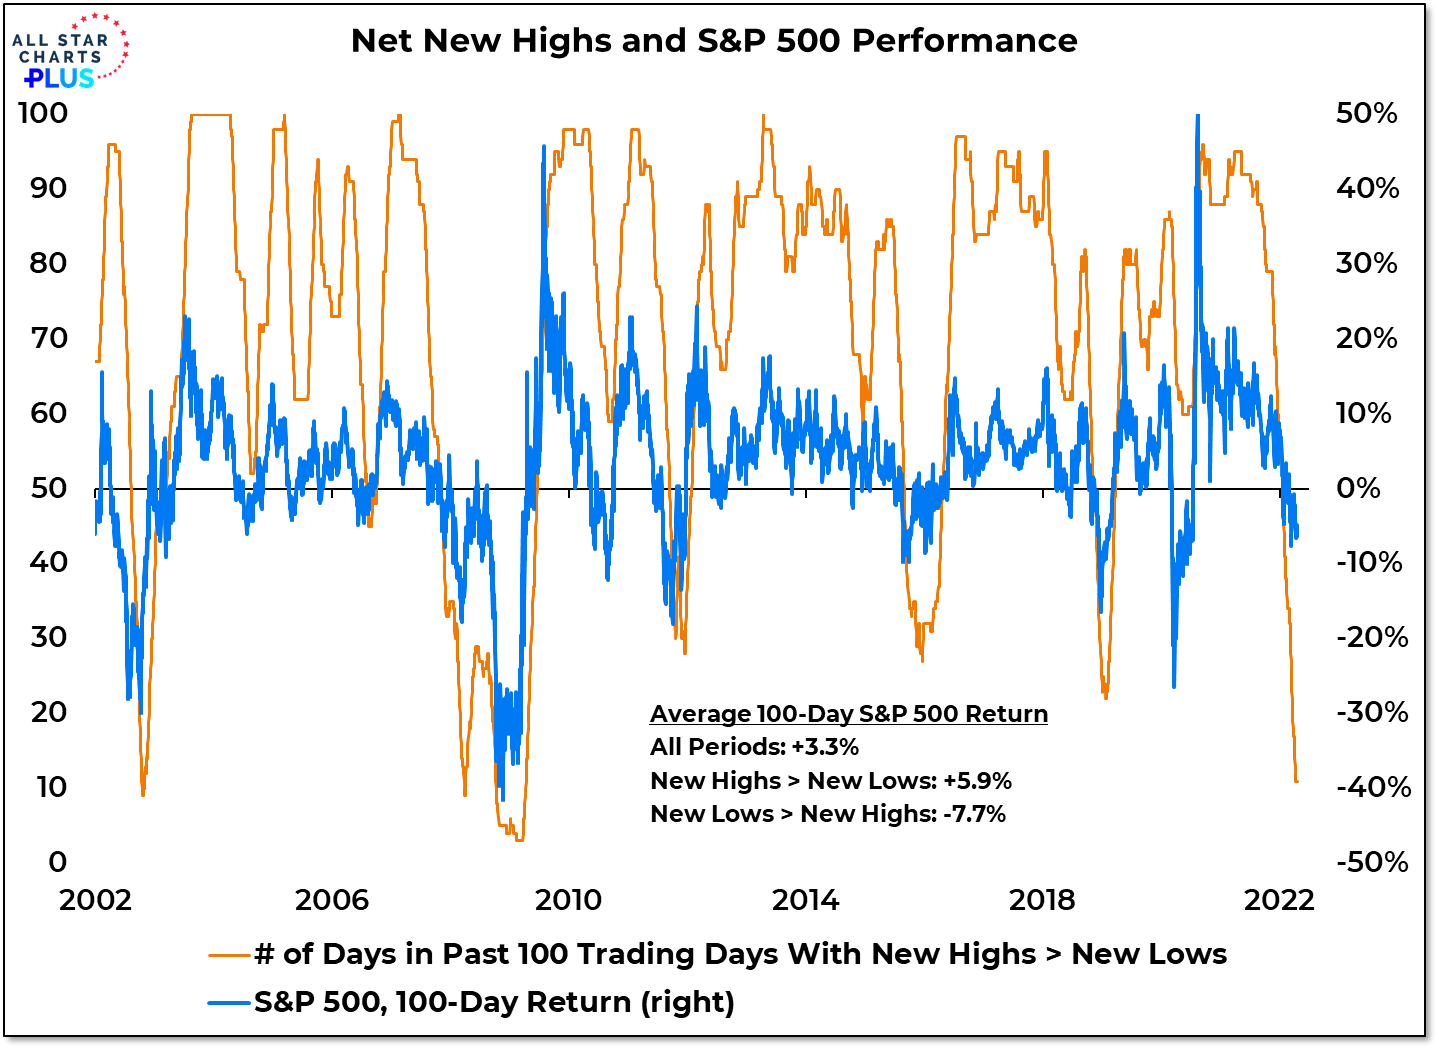
A pile of wood does not alone make a campfire. You still need a spark and dry tinder to get it going. In the same way, excessive pessimism is a market condition that needs a catalyst if it is going to fuel a rally. Whatever sparks a rally attempt, it is unlikely to gain enough strength to take advantage of the fuel on the sidelines as long as more stocks are making new lows than new highs. When that pattern changes, the odds of a small fire growing into a blazing rally increase.
Investor sentiment is bad. Historically bad.
Don’t take my word for it. Check it out for yourself.
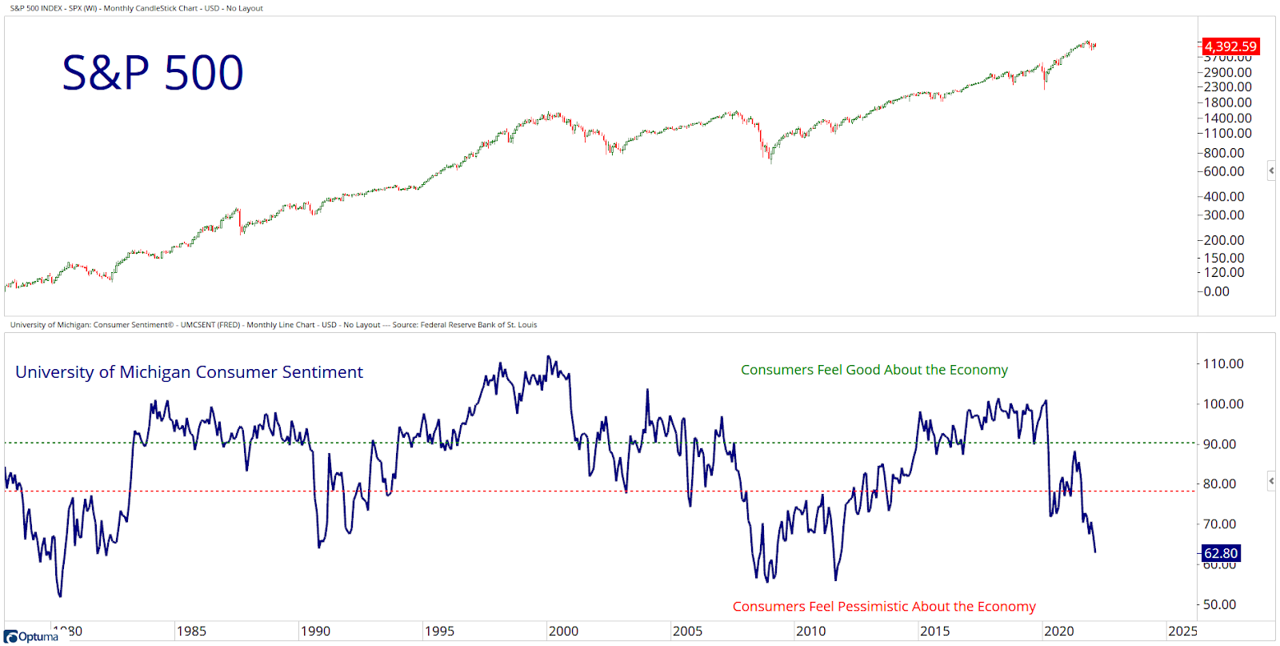
Sentiment has only been this bearish four times over the last 40 years: Coming out of rampant 1970’s inflation, the Savings & Loan crisis of the early 90’s, the Great Financial Crisis of 2008-09, and the “Fiscal Cliff” circa 2012.
Do you remember those times?
And you see what happened in the S&P 500 after, right?
Is history going to repeat itself? And if so, how do we protect ourselves and our portfolios from the “risk” of being underinvested if that happens? [Read more…]
From the desk of Steven Strazza @Sstrazza and Ian Culley @IanCulley
The US Dollar Index $DXY resumes its relentless march higher.
But the full story surrounding the dollar’s dominance is a bit more complicated.
Lately, we’ve been pounding the table about the narrow scope of the DXY, as 83% of its weightings come from just three currencies – the yen, the pound, and the euro.
All three continue to lose ground versus the dollar, and this is exactly what’s driving the rally at the index level.
On the other hand, the USD has not performed as well against other currencies – especially emerging markets and commodity-centric ones.
While this remains the case, we’re starting to see USD strength expand beyond the major components of the DXY. We’re also seeing some nice long-term patterns materialize that favor the US dollar.
A great example is the rounding bottom in the US dollar-Korean won cross – USD/KRW.
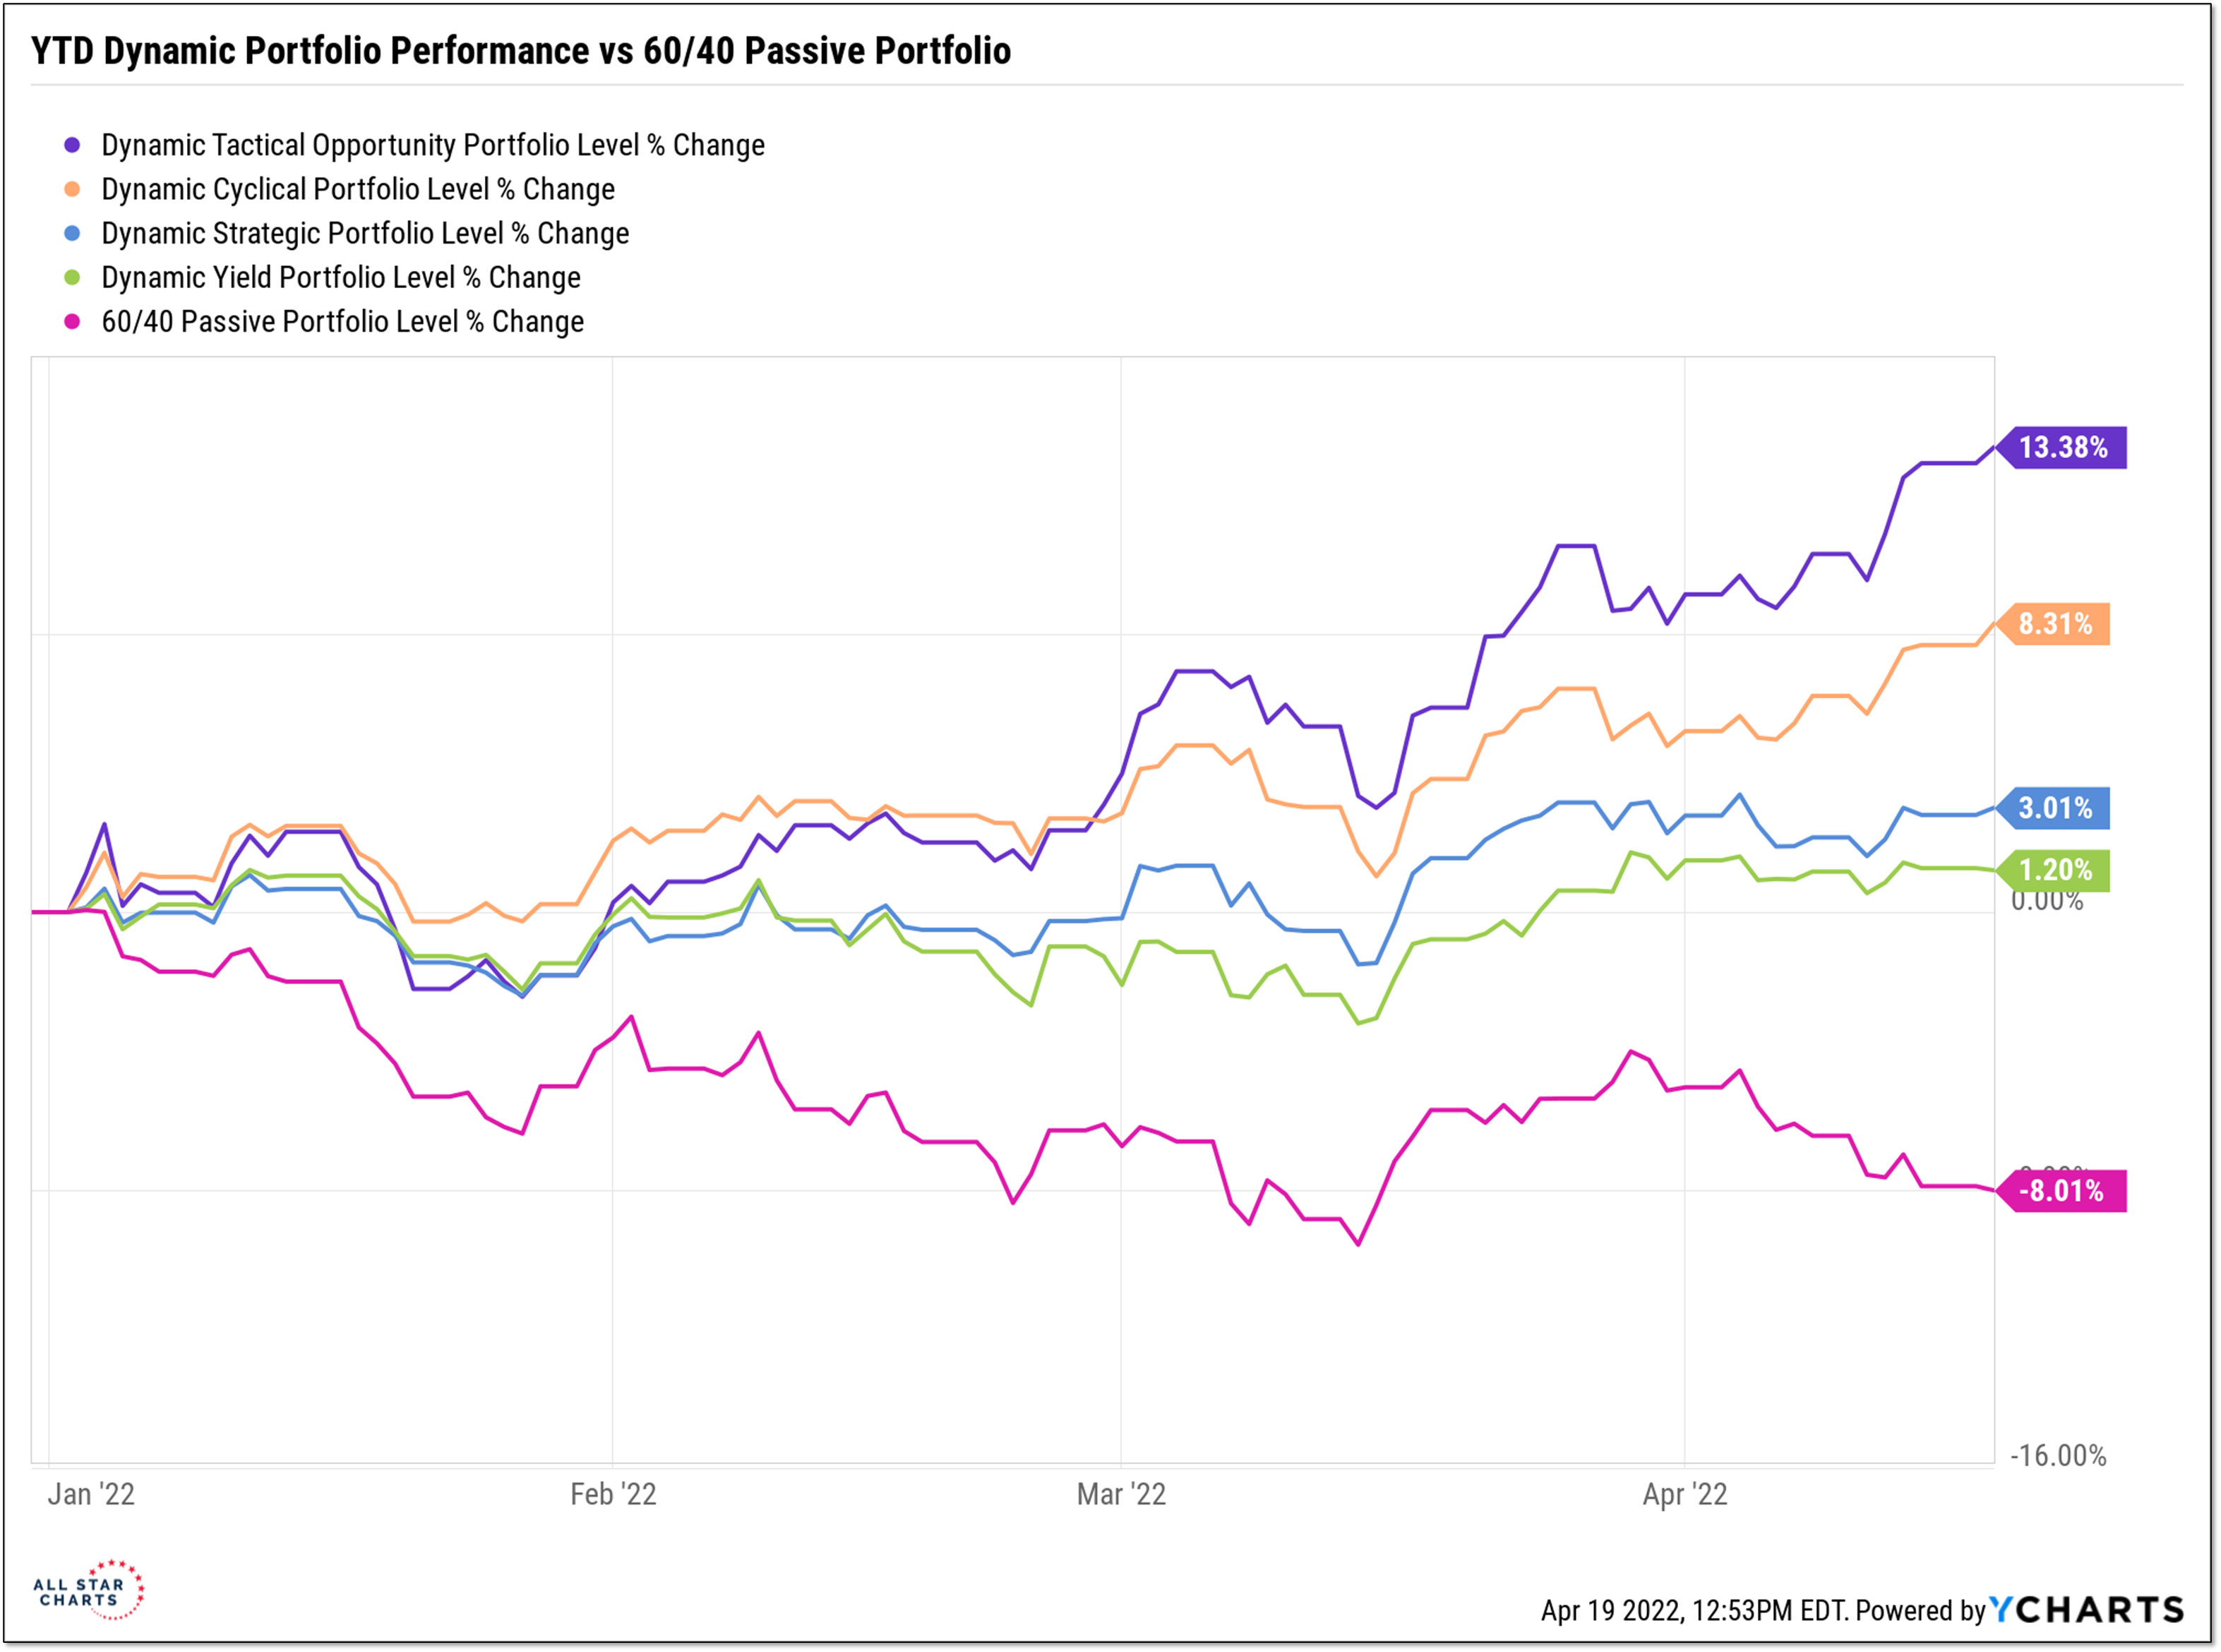
Participating in strength so far in 2022 provides us with some operational flexibility in our Dynamic Portfolios. But in a market with relatively narrow participation, it can be challenging to find ways to move from strength to strength without becoming too concentrated. That said, we are reducing exposure to some of the strongest areas of the market – taking gains more than expecting weakness. We are finding opportunities to maintain our current exposure to the market, increase our diversification and remain consistent with the message of caution coming from our risk indicators and the weight of the evidence. This remains an environment that favors a dynamic over passive approach and one in which being tactical and cyclical enhance strategic exposure.
From the desk of Steve Strazza @Sstrazza.
Welcome back to our latest Under the Hood column, where we’ll cover all the action for the week ended April 15, 2022. This report is published bi-weekly and rotated with our Minor Leaguers column.
What we do here is analyze the most popular stocks during the week and find opportunities to either join in and ride these momentum names higher, or fade the crowd and bet against them.
We use a variety of sources to generate the list of most popular names.
There are so many new data sources available that all we need to do is organize and curate them in a way that shows us exactly what we want: a list of stocks that are seeing an unusual increase in investor interest.
Watch this video for a behind-the-scenes look at our process.
Whether we’re measuring increasing interest based on large institutional purchases, unusual options activity, or simply our proprietary lists of trending tickers, there’s a lot of overlap.
From the desk of Steve Strazza @sstrazza
This is one of our favorite bottom-up scans: Follow the Flow.
In this note, we simply create a universe of stocks that experienced the most unusual options activity — either bullish or bearish… but NOT both.
We utilize options experts, both internally and through our partnership with The TradeXchange. Then, we dig through the level 2 details and do all the work upfront for our clients.
Our goal is to isolate only those options market splashes that represent levered and high-conviction, directional bets.
 We also weed out hedging activity and ensure there are no offsetting trades that either neutralize or cap the risk on these unusual options trades.
What remains is a list of stocks that large financial institutions are putting big money behind.
They’re doing so for one reason only: because they think the stock is about to move in their direction and make them a pretty penny.
Then we flip through our list of stocks flashing unusual activity and pick the best setups using many of the same technical filters we do for our other scans.
And, just like that, we’ll follow the money flow and fatten our own pockets along with some of the world’s most powerful financial institutions.