Key Takeaway:
- Bear market story playing out beneath the surface.
- Contrarian play is in bonds not stocks.
- Challenges ahead, but commodity trends remain robust.
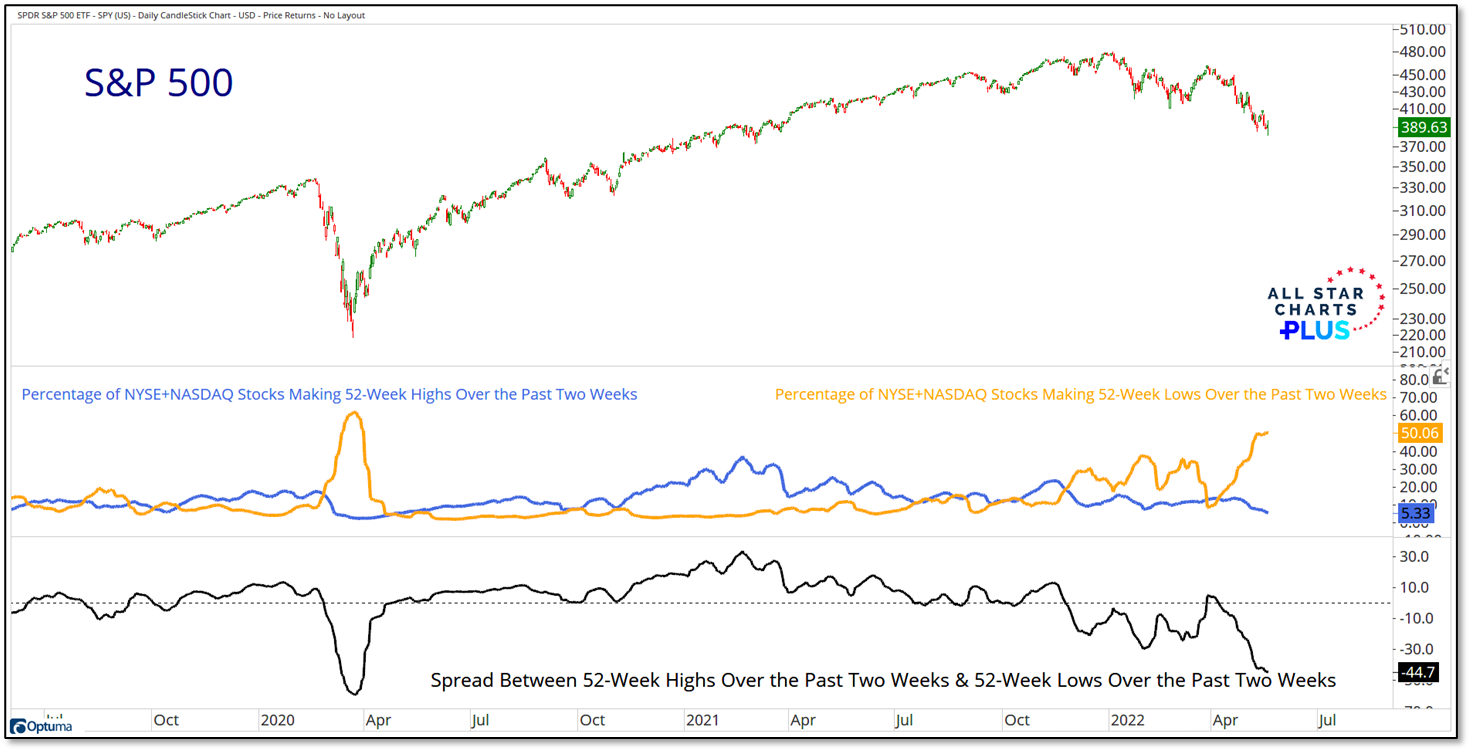
Expert technical analysis of financial markets by JC Parets
by Peter
Key Takeaway:
by JC
The average stock listed on the NYSE is down over 34% off its highs.
The new 52-week highs list peaked in February of last year – that was over 15 months ago!
We’ve now seen more stocks hitting new lows than new highs for the most consecutive weeks since the Great Financial Crisis.
The Technology, Communications and Consumer Discretionary sectors combined make up almost half of the stocks in the entire S&P500. They’re each now down 26%, 33% and 35%, respectively.
In fact, almost half the stocks on the Nasdaq have seen their prices get cut in half.
And people keep asking me if we’re going into a bear market?
What the hell do you call that?
If you define all that as a bull market, then I think you need to check yourself into a mental hospital. [Read more…]
by JC
This is the weekly post that aggregates all the charts we put together throughout the week and organizes them all into one, easy to flip through deck.
by Ian Culley
From the desk of Steven Strazza @Sstrazza and Ian Culley @Ianculley
Markets trend. Trends persist.
Those crucial Dow Theory tenets form the foundational premises of technical analysis.
As technicians, identifying trends is a central component of our work.
But, most of the time, markets remain range-bound, as we experienced during the choppy mess that dominated the stock market and so many risk assets last year.
However, during that time, commodities continued to rip higher.
Now that the rally in raw materials is reaching significant areas of overhead supply, it would make sense for this leadership space to follow stocks and enter a corrective period.
In other words, the uptrend in commodities that has persisted since 2020 is likely to take a breather and turn into a sideways trend.
Let’s talk about it.
From the desk of Steve Strazza @Sstrazza
Our Hall of Famers list is composed of the 150 largest US-based stocks.
These stocks range from the mega-cap growth behemoths like Apple and Microsoft – with market caps in excess of $2T – to some of the new-age large-cap disruptors such as Moderna, Square, and Snap.
It has all the big names and more.
It doesn’t include ADRs or any stock not domiciled in the US. But don’t worry; we developed a separate universe for that, which you can check out here.
The Hall of Famers is simple.
We take our list of 150 names and then apply our technical filters so the strongest stocks with the most momentum rise to the top.
Let’s dive right in and check out what these big boys are up to.
by Peter
From the desk of Willie Delwiche.
The S&P 500 has now declined for seven consecutive weeks and on Friday passed the 20% pullback threshold (and on cue “Bear Market” headlines sprouted like dandelions in Spring). This is the index and its so-called “generals” (the mega-cap stocks that have the greatest weighting) catching down to what has been happening beneath the surface for months. Coming into this week, the average NYSE stock was down over 30% from its high, with the average NASDAQ stock down more than 45%. This week brings us to 26 consecutive weeks of more stocks making new lows than new highs.
The mega-cap S&P 100 (OEF) is making new lows while the small-cap S&P 600 (IJR) is not. Even more dramatic is the ratio between IJR and OEF (small-caps / mega-caps). Here, the May low was above the April low, which in turn was above the February low. The pattern of higher lows is established and the ratio is testing its March highs. While the headlines are about weakness in the index, the story is that relative strength is being established beneath the surface.
by JC
This is the video recording of the May 2022 Mid-month Conference Call.
We discussed:
by Ian Culley
From the desk of Steven Strazza @Sstrazza and Ian Culley @Ianculley
Bonds are digging in at some familiar levels.
For years now, we’ve pounded the table about the importance of the 2018 highs for various risk assets.
That’s because those former highs marked significant peaks for both the stock market and certain procyclical commodities and currencies during the last cycle.
As far as the bond market is concerned, 2018 was also when yields peaked. Benchmark rates in the US are testing these old highs.
As such, it’s not the 2018 highs but the 2018 lows that we’re paying attention to when analyzing the prices of Treasuries.
A handful of bonds and bond funds are trying to find a bottom at these key former lows right now.
Let’s take a look. [Read more…]