Do you have any exposure to Energy?
Then this is the chart for you!
It’s Crude Oil stuck between 76 and 66: [Read more…]
Expert technical analysis of financial markets by JC Parets
On August 11th, Sean and JC hopped on a Twitter Live Stream to discuss a recent trade idea for All Star Charts Options Members.
Here’s the play:
“We’re buying a $AEO Sept/Jan 35 Call Calendar Spread for around a $2.10 debit. This means we’ll be short the September 35 calls and long the January 35 calls.”
To learn more about the trade and the thinking behind it, click below to watch a replay of the Live Stream.
Whenever Frances calls to chat about the market, she knows she’s getting a yes!
Frances Horodelski and I have been doing this for about a decade, through multiple cycles. It’s always fun!
She was hosting a commodities-focused show today so we discussed Metals and Energy.
I think there is a lot going on in this space and it’s setting up for a big move.
We couldn’t help but talk Financials and Crypto, but it was mostly Commodities.
Hope you enjoy!
The latest Follow the Flow report is out, and as always there is a play therein that caught my attention.
It’s a bullish idea, but I’m going to play this one in a unique way in order to hedge myself a bit in a tape that feels a little sluggish at the moment. I want to get paid to wait out the slow times we’re likely to “enjoy” from now until Labor Day weekend, and possibly beyond. So this will involve a calendar spread, but with a twist…
From the desk of Steve Strazza @sstrazza
Welcome to our latest RPP Report, where we publish return tables for a variety of different asset classes and categories along with commentary on each.
Looking at the past helps put the future into context. In this post, we review the absolute and relative trends at play and preview some of the things we’re watching to profit in the weeks and months ahead.
We consider this our weekly state of the union address as we break down and reiterate both our tactical and structural outlook on various asset classes and discuss the most important themes and developments currently playing out in markets all around the world.
We’ve been pretty obnoxious about our position that markets are a total mess these days. While this remains the case, we’ve seen some positive developments play out lately… particularly the renewed strength from cyclicals and offensive assets.
We’ve covered the best evidence from both the bulls and bears camp in recent months, and even played devil’s advocate with the data we have. We continue to track and point out the most important upside and downside resolutions across global markets. And we keep pounding the table on two major themes (among others):
As market participants, we have to keep an open mind and remain nimble as new data comes in.
There’s nothing wrong with flipping our approach as the weight of the evidence shifts. In fact, we pride ourselves on never being dogmatic and always keeping an objective lens on the market.
Sometimes it’s irresponsible to not be aggressive in our positioning, while at others, there’s nothing wrong with sitting on our hands and waiting for new data to come in.
And that’s precisely where we stand with Bitcoin right now.
With prices pushing up against support from February and April, we’re anticipating some form corrective action from this impressive rally at this pretty logical level of overhead supply.
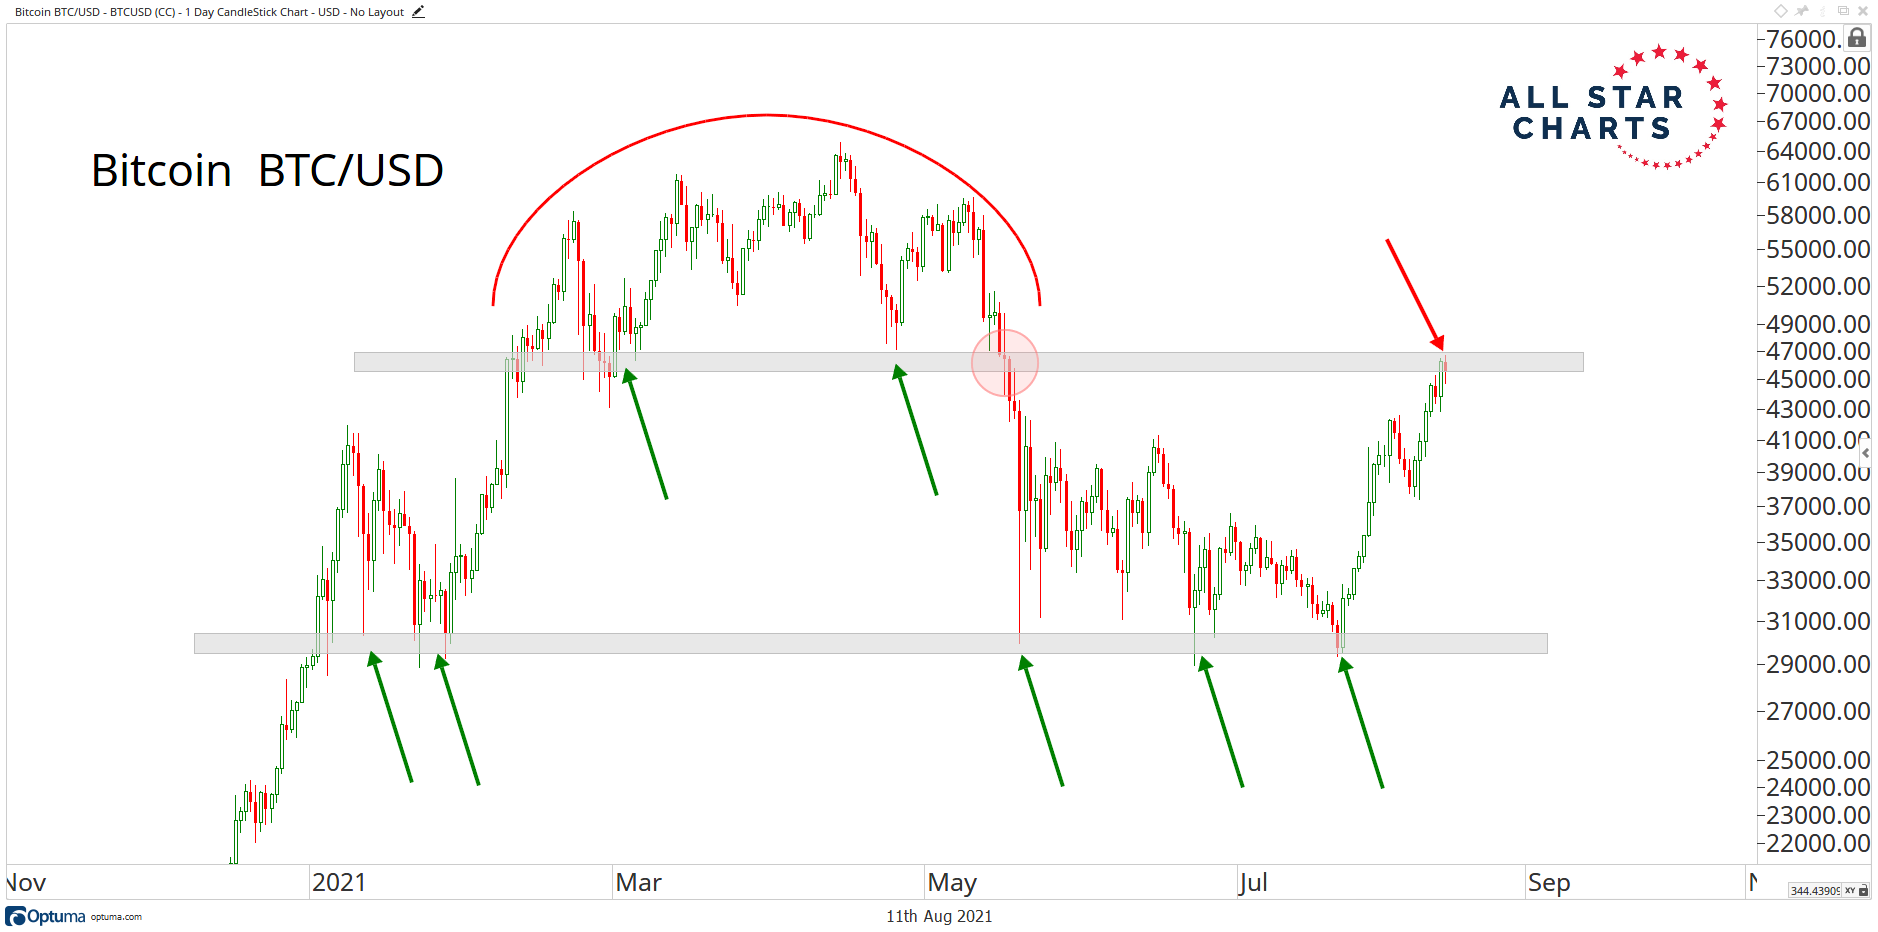
How long will this former support act as resistance?
From the desk of Steve Strazza @Sstrazza and Ian Culley @Ianculley
The US Dollar Index $DXY has been a good reminder that price doesn’t always move in a straight line.
Paul Tudor Jones has been quoted saying “markets only trend about 15% of the time.” The textbooks will tell you it’s somewhere between 20% and 30%. But it all comes down to how you’re measuring it.
We think it’s fair to say most markets trend about 25% of the time on a structural basis.
And the present year two market conditions have been a great illustration of what they look like the other 75% of the time… range-bound… sideways… a hot mess.
Speaking of which, last week, we pointed out that Dollar strength had stalled and that things were beginning to look messy on shorter time frames.
Many of the long USD trade setups we laid out in late June have yet to break out and are currently testing their respective risk levels, with the lone exception of the AUD/USD.
Mixed signals and indecision remain the case for the Dollar as DXY attempts to find its footing and take out the upper bounds of its year-to-date range… again.
Given the far-reaching impact the Dollar can have on risk assets around the globe, let’s take a step back, discuss the recent price action, and identify some critical levels of interest.