This is the video recording of our April 5th Monthly Charts Live Strategy Session
[PLUS] Weekly Sentiment Report
From the desk of Willie Delwiche.
Key Takeaway: Price action has a way of changing sentiment, and the recent bout of strength has brought signs of hope. Optimism is on the rise with an uptick in bulls, a rebound in both the II and AAII bull-bear spreads, and an increase in exposure by active equity managers. Yet, bears linger and the drop in put/call ratios is driven by decreasing put activity. This speaks to less of a risk-off tone rather than a definitive sign of risk-on behavior. Though optimism is in the air, it’s going to take further improvements in trend, momentum, and breadth for bears to change their tune in support of a sustained rally.
Sentiment Report Chart of the Week: Breadth Backdrop Improving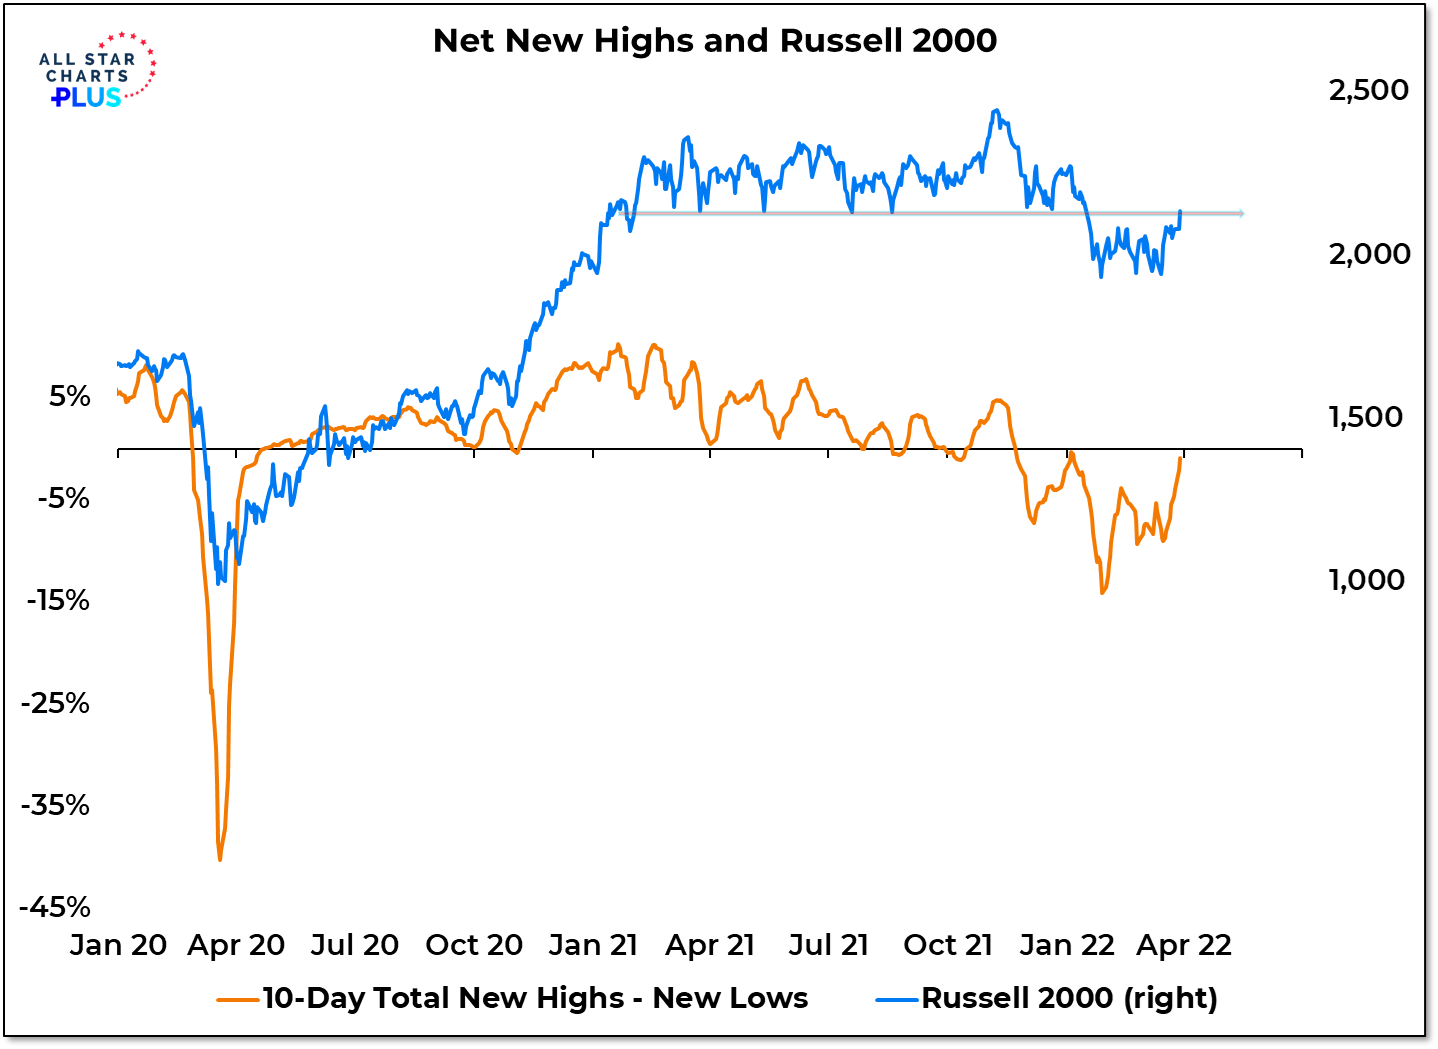
The rally off of the mid-March stock market lows has investors feeling better (or at least less bad). This improved mood (and the rebound in price that helped fuel it) will likely have more staying power if it’s accompanied by a better breadth backdrop. We are heading in that direction, but there is still work to be done. This week we finally had a day with more new highs than new lows (for the first time since the second trading session of the year). Building on that and getting the 10-day net new high number back in positive territory could help small-caps get back in gear. We’ve also had nearly 50% of S&P 500 stocks close at new 20-day highs. Getting above 55% would fire the first breadth thrust in our work since June 2020 and move the market into a bullish breadth thrust regime. The caveat: close but no cigar works in horseshoes and hand grenades but not breadth thrusts. A failure to build on recent strength could be met with disappointment from a price (and then sentiment) perspective.
[PLUS] Weekly Sentiment Report
From the desk of Willie Delwiche.
Key Takeaway: Investors are identifying with fear and pessimism as bears dominate the surveys. But we have yet to see the type of pessimism that drives market participants to do something about it. The disconnect between what investors are saying and what they are actually doing is evident in the juxtaposition of bearish surveys and elevated stock allocations. This speaks to an underlying confidence that remains unbroken and a lingering optimism susceptible to further unwind. Combined this with lackluster breadth readings, our global trend indicators nearing new lows, and a general lack of risk appetite and it’s difficult to claim the unwind in sentiment is complete.
Sentiment Report Chart of the Week: Unwind Complete When Appetite Returns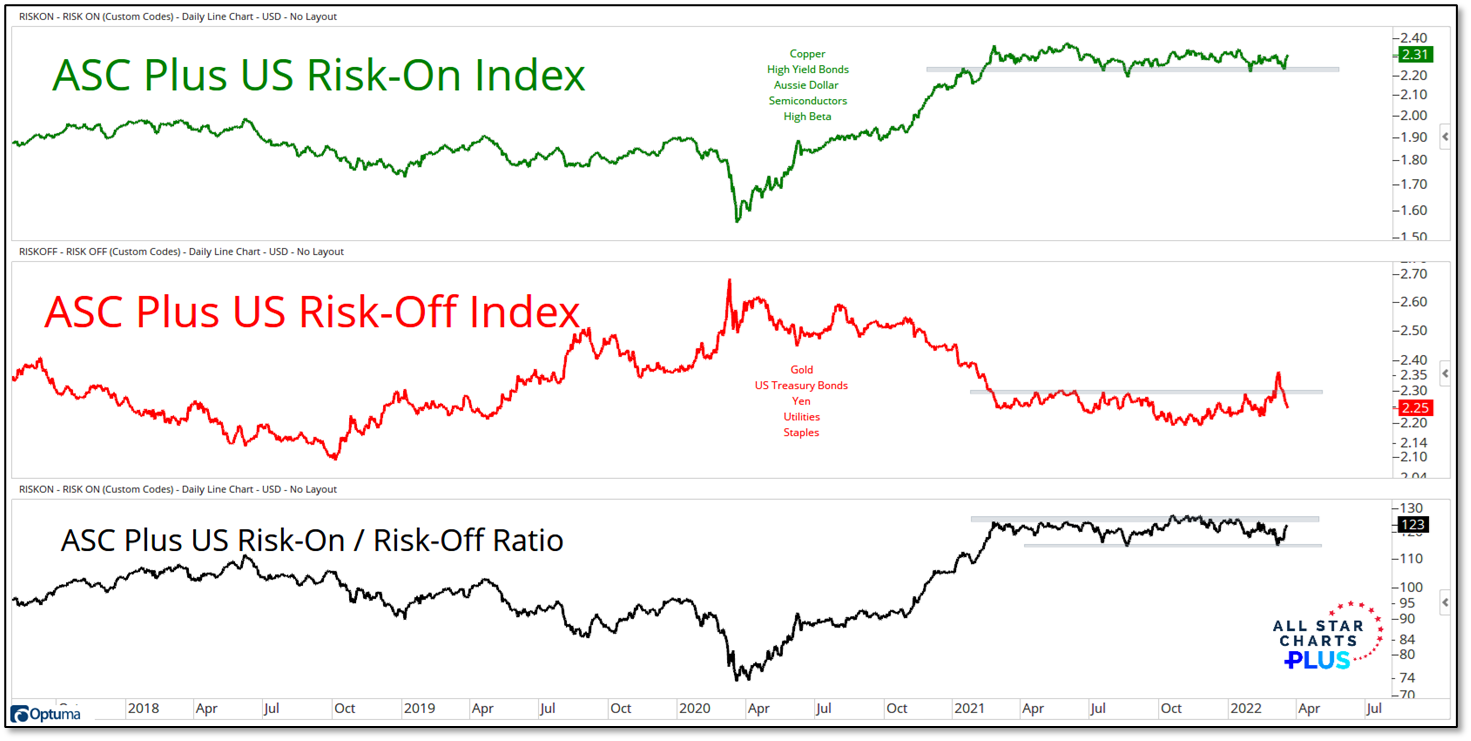
Even with historical context, identifying real-time sentiment extremes is a challenge. It is said, “nothing changes sentiment like price,” and I would add the caveat that price does not always persist. Seeing evidence that a price move can be sustained can add conviction that a durable sentiment turn has occurred. In that regard, our risk on & risk off indicators will be important guideposts. If we see evidence that risk appetite is returning, the sentiment conversation can more easily turn from unwinding to rebuilding optimism. The headfake from the risk off index is encouraging, but for now our risk-on/risk-off ratio continues its year-long sideways chop.
[PLUS] Weekly Sentiment Report
From the desk of Willie Delwiche.
Key Takeaway: There is abundant focus on weekly and monthly surveys showing evidence of investor pessimism with regard to equities. This is at odds with the strategic positioning indicators showing that stocks are expensive and households are historically over-exposed to equities (relative to bonds, but also relative to bonds plus cash). The last two times that II bears exceeded bulls (in 2019 and 2020), household asset allocation data showed only 53% exposure to equities. As of the end of 2021, it was at 62%, an all-time high. So while investors may be identifying themselves as bearish, there is little evidence that investable cash is on the sidelines. With the Fed now raising rates and the market re-considering valuation levels, this lack of available firepower could weigh on equities. Whether today’s pessimism represents a cyclical extreme remains to be seen.
Sentiment Report Chart of the Week: Household Equity Exposure Hits New High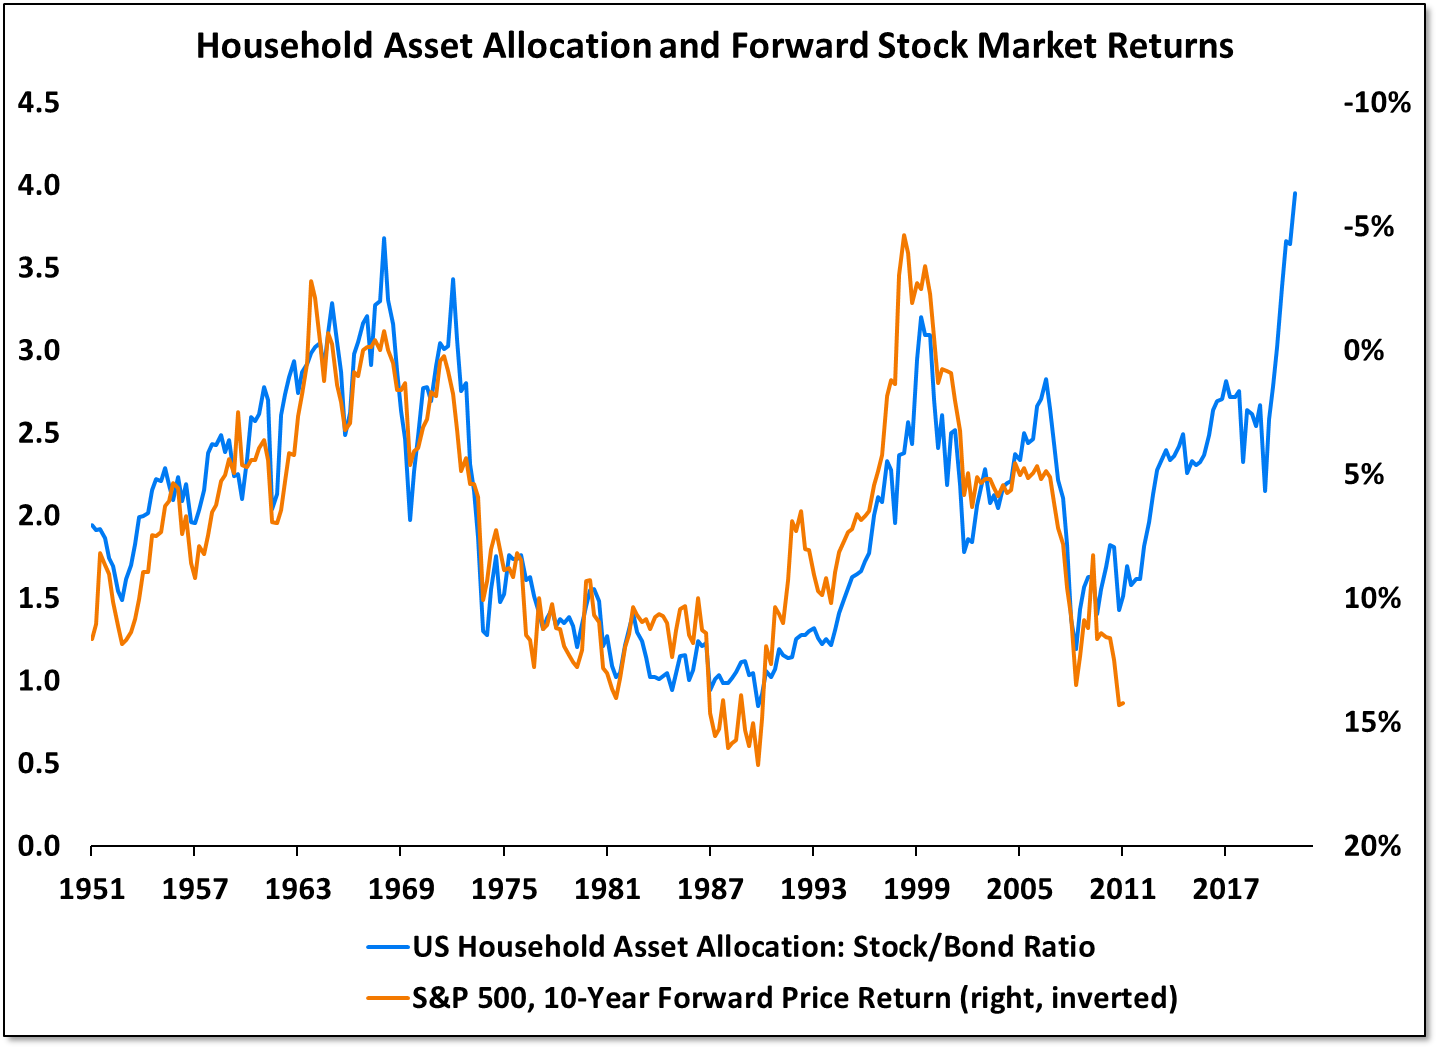
US households finished 2021 with their highest level of equity exposure on record. Households had 62% exposure to stocks, 16% exposure to bonds and 22% exposure to cash.This is quarterly data, meaning it doesn’t reflect changes in market value or fund flows that have occurred this year. Nonetheless, there is a strong inverse relationship between equity market exposure (relative to bonds) and forward returns for the S&P 500 that goes back to the 1950s. If this relationship holds going forward, stock market returns could be disappointing for an investing public that has gone all in for equities.
Cash Levels Near Multi-Decade Highs
[PLUS] Weekly Sentiment Report
From the desk of Willie Delwiche.
Key Takeaway: Put/call ratios are high, there are more bulls than bears on both the AAII and II surveys (a rarity over the past decade) and active investment managers have slashed equity exposure. If the conditions that have been in place since the Financial Crisis lows (which occurred this week in 2009) are still in place, it is hard to argue that sentiment is not a meaningful tailwind for equities and is fuel for a rally. Two cautions: Sentiment is a condition, but rarely a catalyst. This means price action needs to improve to bring bulls back on board. But more significantly, there is still evidence that the speculative unwind that began last year is still ongoing and strategic positioning indicators show little improvement that would indicate longer-term risks are subsiding. Those get exacerbated as the Fed starts to raise interest rates and withdraw liquidity.
Sentiment Report Chart of the Week: Liquidity-Fueled Speculation Now Unwinding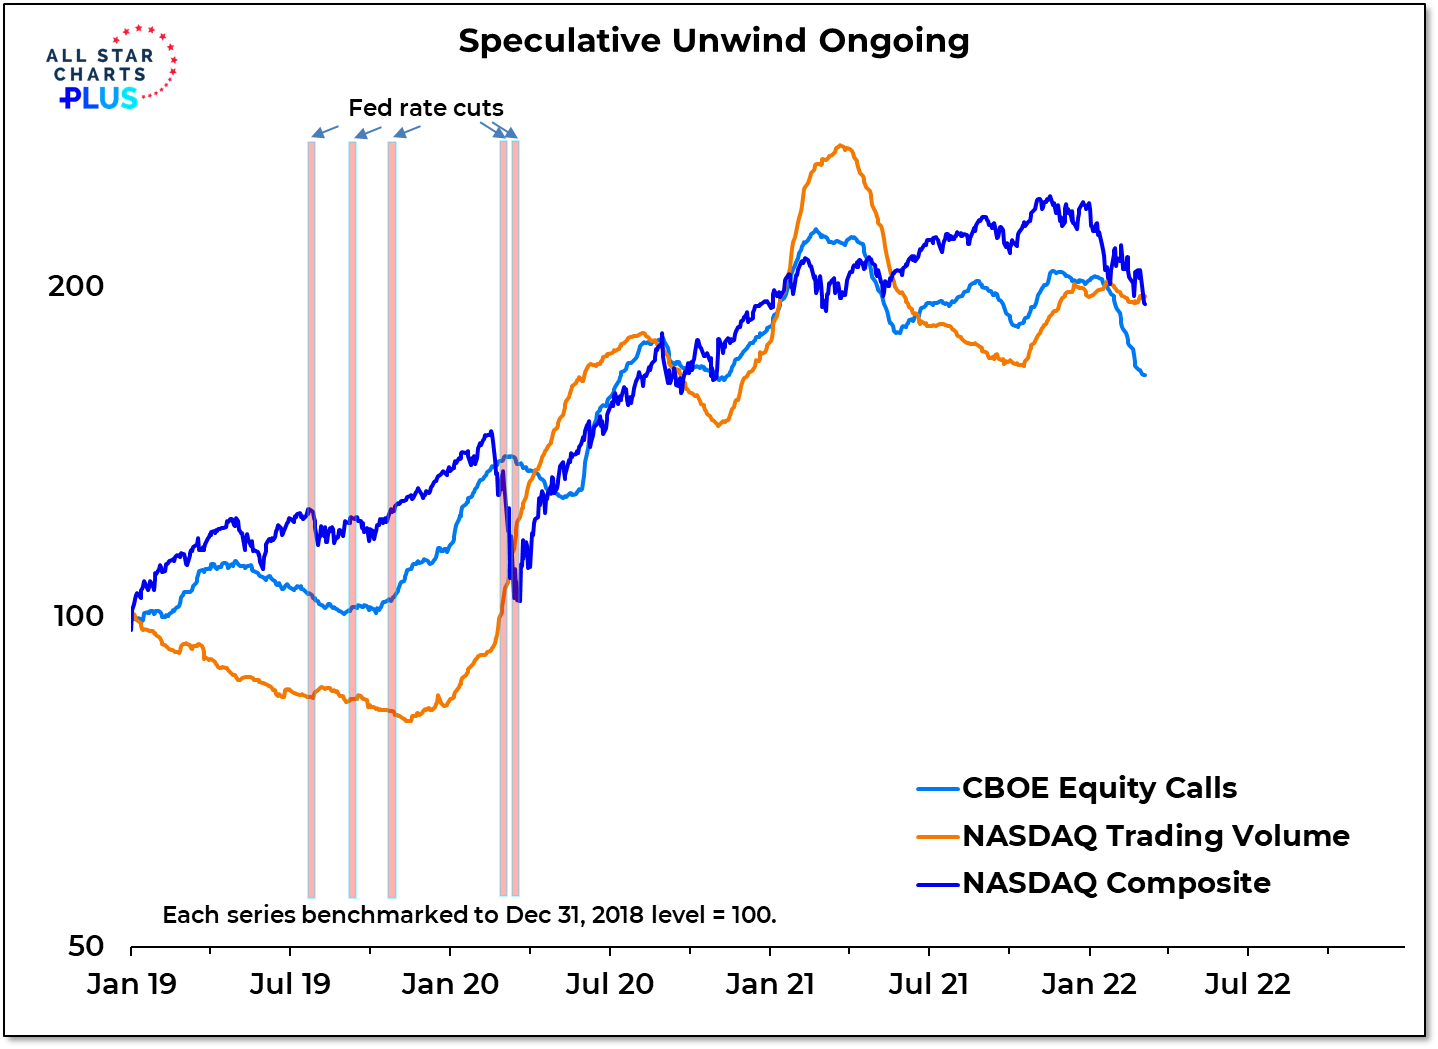
Fed rate cuts in 2019 primed the pump for a surge in speculative activity and the flood of liquidity that was provided in response to COVID was fuel for the fire. While investors and advisors are turning pessimistic, there is evidence that the unwind in speculative activity is still ongoing. Equity call options and NASDAQ trading volume peaked a year ago but are still well above levels from just a couple of years ago. The Fed made its final QE purchases today and is poised to raise rates next week. With liquidity tightening, I expect further unwind in speculative activity going forward.
Stocks: More Bears Than Bulls
[PLUS] Weekly Sentiment Report
From the desk of Willie Delwiche.
Key Takeaway: Optimism wanes, and pessimism builds as the II bull-bear spread narrowed last week to just 1.2%, down more than 4% from the previous week. That brings the spread to its smallest difference since early April 2020. But it’s not until bears outnumber the bulls that we reach levels associated with significant market bottoms. Nevertheless, a surge in pessimism could become reality with active equity managers continuing to reduce exposure, consensus bulls dropping, and major equity indexes testing their respective January lows. Whether sentiment has completely unwound or is still in the process of unwinding is yet to be determined.
Sentiment Report Chart of the Week: Unwound or Unwinding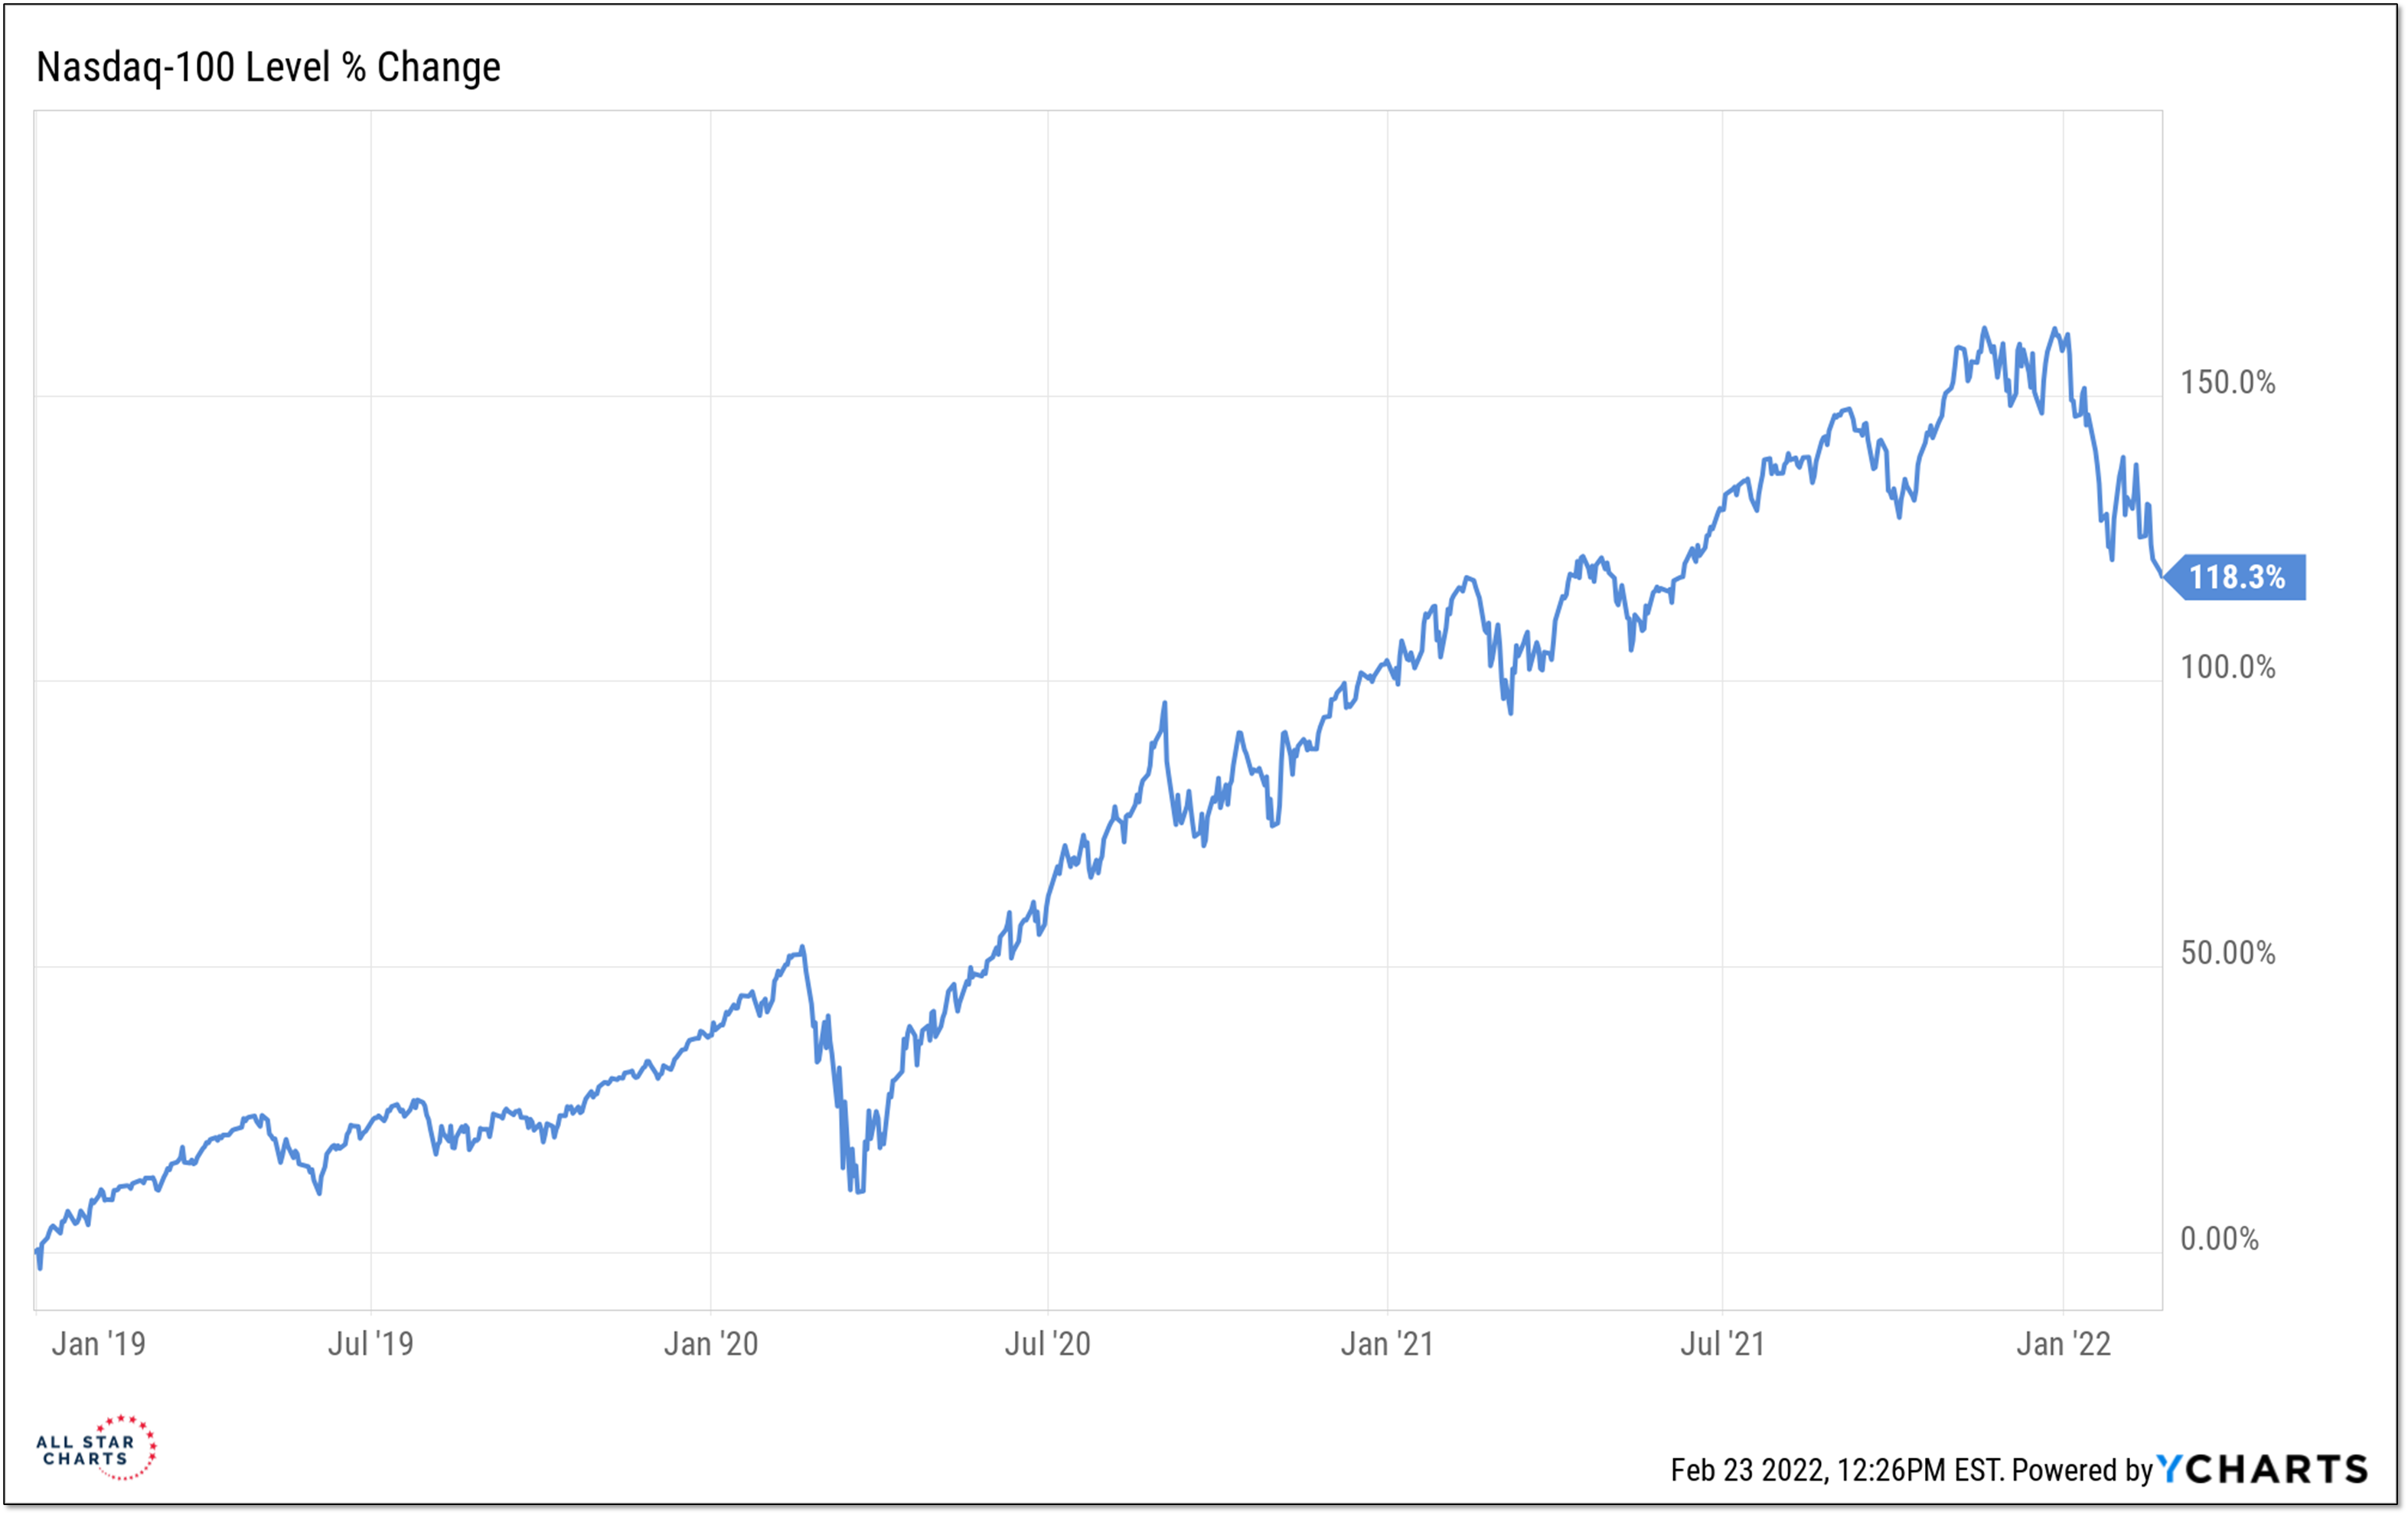
The NASDAQ is getting plenty of attention for the carnage that is occurring beneath the surface. The stat that really sticks out for me is that 95% of the trading days over the past three months have seen more new lows than new highs. That weakness is now hitting the index and while the NASDAQ 100 is making new YTD lows it’s still more than twice as high as it was at the start of 2019. So while we are seeing evidence of fear and pessimism in the sentiment data, the question I wrestle with from a price perspective is whether we have unwound or are still unwinding. If it’s the former, we should soon find support and start seeing more new highs than new lows. If it’s the latter (which is the direction I am leaning), then there is room for pessimism to continue to rise and the NASDAQ 100 could soon be in the red on a year-over-year basis.
- « Previous Page
- 1
- …
- 13
- 14
- 15
- 16
- 17
- …
- 24
- Next Page »