It’s the weekly bond edition of What the FICC?
The Silicon Valley Bank $SIVB collapse dominates the week’s headlines.
While risks appear isolated for now, unlike in 2008, the next chart reveals a storm brewing beneath the surface…
Expert technical analysis of financial markets by JC Parets
It’s the weekly bond edition of What the FICC?
The Silicon Valley Bank $SIVB collapse dominates the week’s headlines.
While risks appear isolated for now, unlike in 2008, the next chart reveals a storm brewing beneath the surface…
From the Desk of Ian Culley @IanCulley
US bank stocks big and small took a beating Thursday, with the Bank ETF $KBE posting its largest single-day decline since 2020.
The steep sell-off came on the heels of Silicon Valley Bank’s $SIVB Wednesday announcement of a $1.8B loss, mainly due to accepting unrealized losses in US Treasuries.
Based on SIVB’s acute exposure to the tech industry, you can argue larger banks with more diversified portfolios and clients don’t carry the same risk. And they don’t.
Regardless, the next chart reveals a storm brewing beneath the surface…
From the Desk of Steve Strazza @Sstrazza
Dividend Aristocrats are easily some of the most desirable investments on Wall Street. These are the names that have increased dividends for at least 25 years, providing steadily increasing income to long-term-minded shareholders.
As you can imagine, the companies making up this prestigious list are some of the most recognizable brands in the world. Coca-Cola, Walmart, and Johnson & Johnson are just a few of the household names making the cut.
Here at All Star Charts, we like to stay ahead of the curve. That’s why we’re turning our attention to the future aristocrats. In an effort to seek out the next generation of the cream-of-the-crop dividend plays, we’re curating a list of stocks that have raised their payouts every year for five to nine years.
We call them the Young Aristocrats, and the idea is that these are “stocks that pay you to make money.” Imagine if years of consistent dividend growth and high momentum and relative strength had a baby, leaving you with the best of the emerging dividend giants that are outperforming the averages.
By adding our technical analysis to the mix, the Young Aristocrat setups give you the opportunity to own the best of the market’s future blue-chip winners before they become must-own household names.
Oftentimes, the strongest performers in this universe and even the Aristocrats themselves pay relatively small dividends. This is usually because the stock appreciation makes it tough to keep up with the payout — even for companies that consistently grow their yield in the double-digits! For this reason, we don’t have a minimum threshold for the dividend. What we’re really doing here is creating a list of quality stocks based on their ability to persistently grow their shareholder return.
And maybe the best part? This list is not just designed for long-term investors. Any kind of investor or trader can use this list as it helps generate ideas across all timeframes, even the short term. Remember, some of the most important filters we use for this list are momentum, relative strength, and proximity to new highs.
From the Desk of Steve Strazza @Sstrazza
When investing in the stock market, we always want to approach it as “a market of stocks.”
Regardless of the environment, there are always stocks showing leadership and trending higher.
We may have to look harder to identify them depending on current market conditions. But there are always stocks that are going up.
The same can be said for weak stocks. Regardless of the environment, there are always stocks that are going down, too.
We already have multiple scans focusing on stocks making all-time highs, such as Hall of Famers, Minor Leaguers, and the 2 to 100 Club.
We filter these universes for stocks that are exhibiting the best momentum and relative strength characteristics.
Clearly, we spend a lot of time identifying and writing about leading stocks every week, via multiple reports.
Now, we’re also highlighting lagging stocks on a recurring basis.
From the Desk of Willie Delwiche
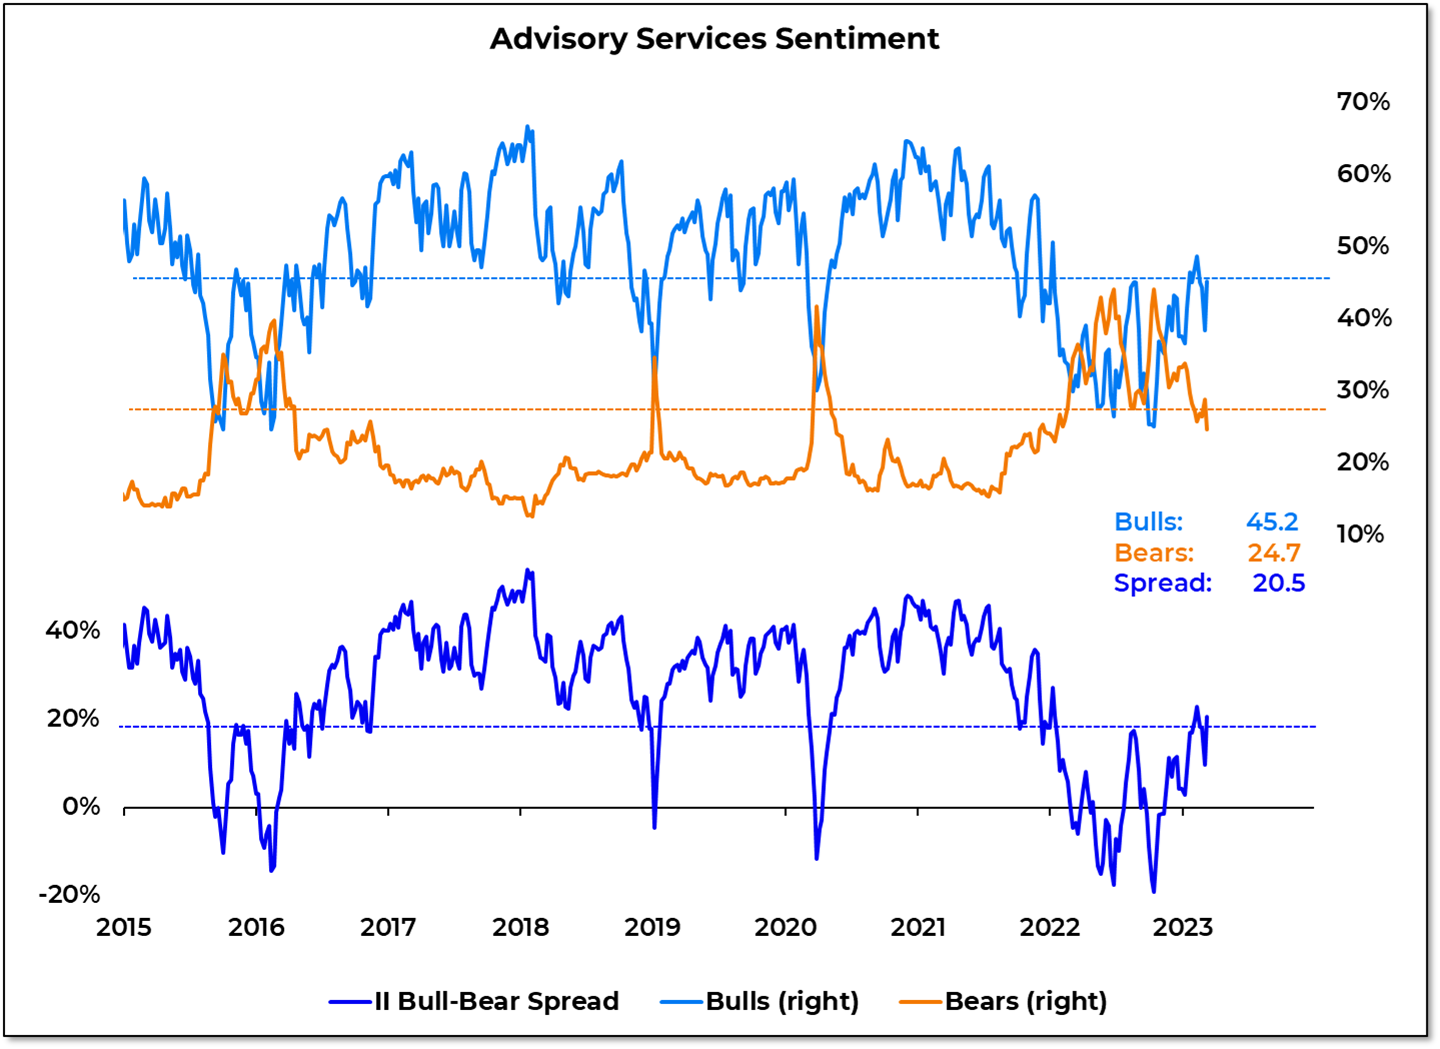
Investors had second thoughts about stocks last week, with sentiment dropping across the board. This week’s Investors Intelligence survey shows a healthy return to optimism as bears dropped to their lowest level in over a year and the bull-bear spread moved back above its August high.
Why It Matters: Stocks tend to do well when persistent pessimism fades. In such an environment increasing investor optimism is a bullish tailwind for stocks. The shift from pessimism to optimism is not always a one-way street. Consolidation along the way is to be expected but a return to ex excessive pessimism would not be a healthy development. The latest II data suggests last week’s sentiment shift was the former rather than the later. We will look to the AAII & NAAIM (released later this week) for confirmation that investors were just catching their breath.
In this week’s Sentiment Report we look at how investors are responding to the recent price volatility and how that volatility may work against the emergence of a bull market.
Today’s trade is going to leverage the rising volatilities introduced into the stock market this week thanks to testimony from the Federal Reserve Chairman (I’ve been told).
When markets get dicey and volatility rises, I like to look at my universe of Sector ETFs and choose one that is both displaying higher relative options prices than its peers and looks set up for rangebound trading action over the next 3-5 weeks.
An ETF near the top of my list is the Materials sector ETF $XLB. We’re going to bet on the recent sloppy trading action to continue sideways for a bit, and we’re going to sell a delta-neutral spread to collect premium and position ourselves to earn the decay.
From the desk of Steve Strazza @Sstrazza
We held our March Monthly Strategy Session on Monday night. Premium Members can access and rewatch it here.
Non-members can get a quick recap of the call simply by reading this post each month.
By focusing on long-term, monthly charts, the idea is to take a step back and put things into the context of their structural trends. This is easily one of our most valuable exercises as it forces us to put aside the day-to-day noise and simply examine markets from a “big-picture” point of view.
With that as our backdrop, let’s dive right in and discuss three of the most important charts and/or themes from this month’s call.