This is the video recording of the February 16th, 2023, Weekly Town Hall w/ Willie Delwiche.
2/16/23 2:00 PM ET [Read more…]
Expert technical analysis of financial markets by JC Parets
This is the video recording of the February 16th, 2023, Weekly Town Hall w/ Willie Delwiche.
2/16/23 2:00 PM ET [Read more…]
From the Desk of Willie Delwiche
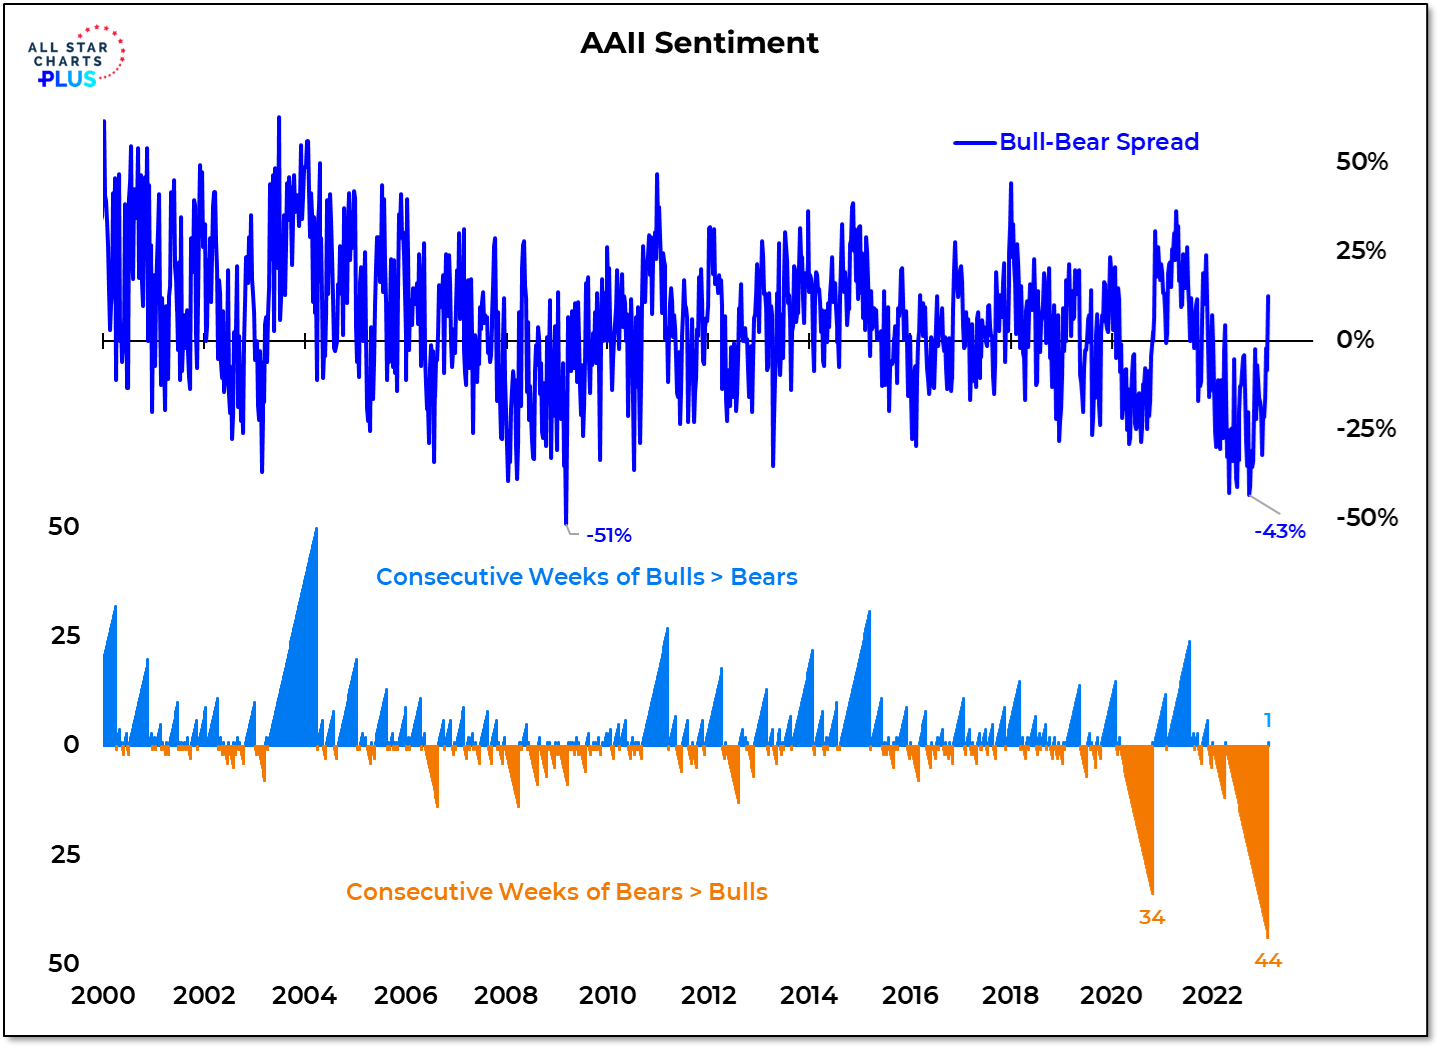
Last week was the first time in 45 weeks that the weekly AAII survey showed more bulls than bears. The most recent stretch of pessimism did not eclipse the Financial Crisis in terms of intensity (the bull-bear spread bottomed last year at -43%, versus -51% in March 2009). But it did set the record for persistence.
Why It Matters: This newfound optimism is leading to some concern that the rally off of last year’s lows has run its course. This is based on the idea sentiment is always best used as a contrarian indicator. Leaning against sentiment tends to be most successful after it has reversed at extremes. The path higher for stocks becomes more clear as bulls replace bears. Rallies that are accompanied by rising optimism tend to be more sustainable. Optimism becomes a headwind after it becomes excessive and begins to fade. While on the watch for excesses, mostly we are seeing investors finally beginning to embrace stock market strength. At this point in the cycle, strength fuels optimism and optimism fuels strength. Increasing optimism after persistent pessimism is a welcome sight.
In this week’s Sentiment Report we take a closer look at how we need bulls to have a bull market and where to look for early signs that optimism could be getting excessive.
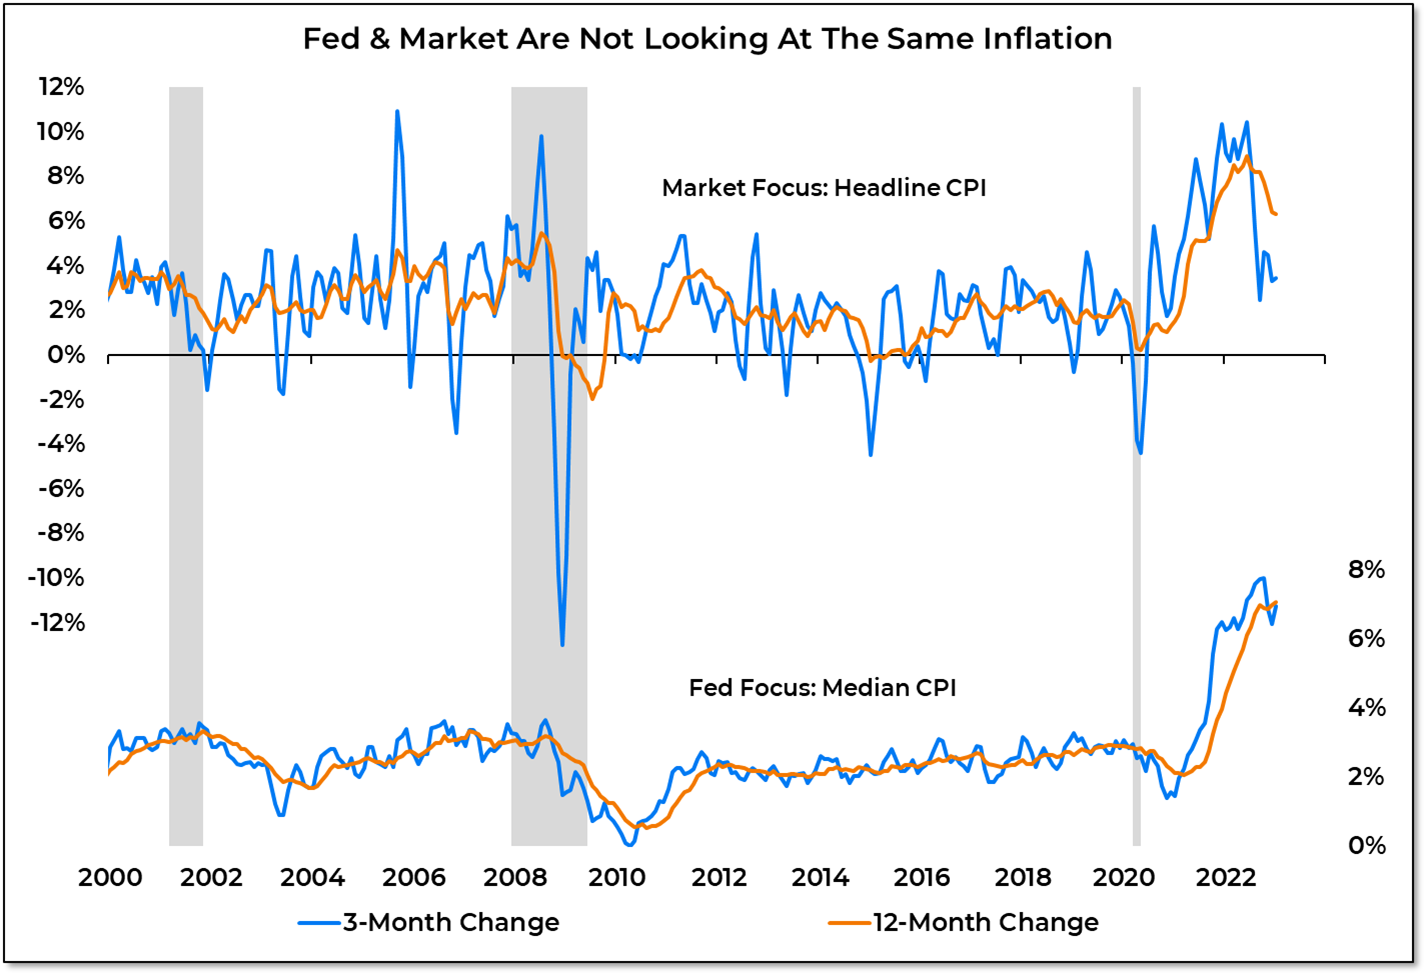
The market has been focused on the headline CPI and eager to declare the inflation battle won. The Fed is less concerned with changes that are fueled by outliers and focuses more on the central tendency and underlying trend in inflation. The median CPI in January posted its third largest 1-month change on record and the 12-month change climbed to a new high. So long peak inflation – we hardly knew you.
Why It Matters: With the market focused on the pullback in headline inflation, bond yields pulled back from their recent highs expectations of rate cuts later this year became more widespread. As it has become clear that the Fed is focused on still-persistent underlying inflation, the market has had to play catch-up. Fed funds futures now match the Fed’s expectations that rates will finish this year above 5% and today for the first time in 15 years we have Treasury yields with a 5-handle. While inflation expectations are on the rise and the underlying trend in yields remains higher, we are not seeing signs of macro-related stress. That keeps the path of least resistance for the Fed and bond yields higher.
Inside we take a Deeper Look at what continues to fuel inflation, how the market is getting on the same page as the Fed and what that all means for bonds going forward.
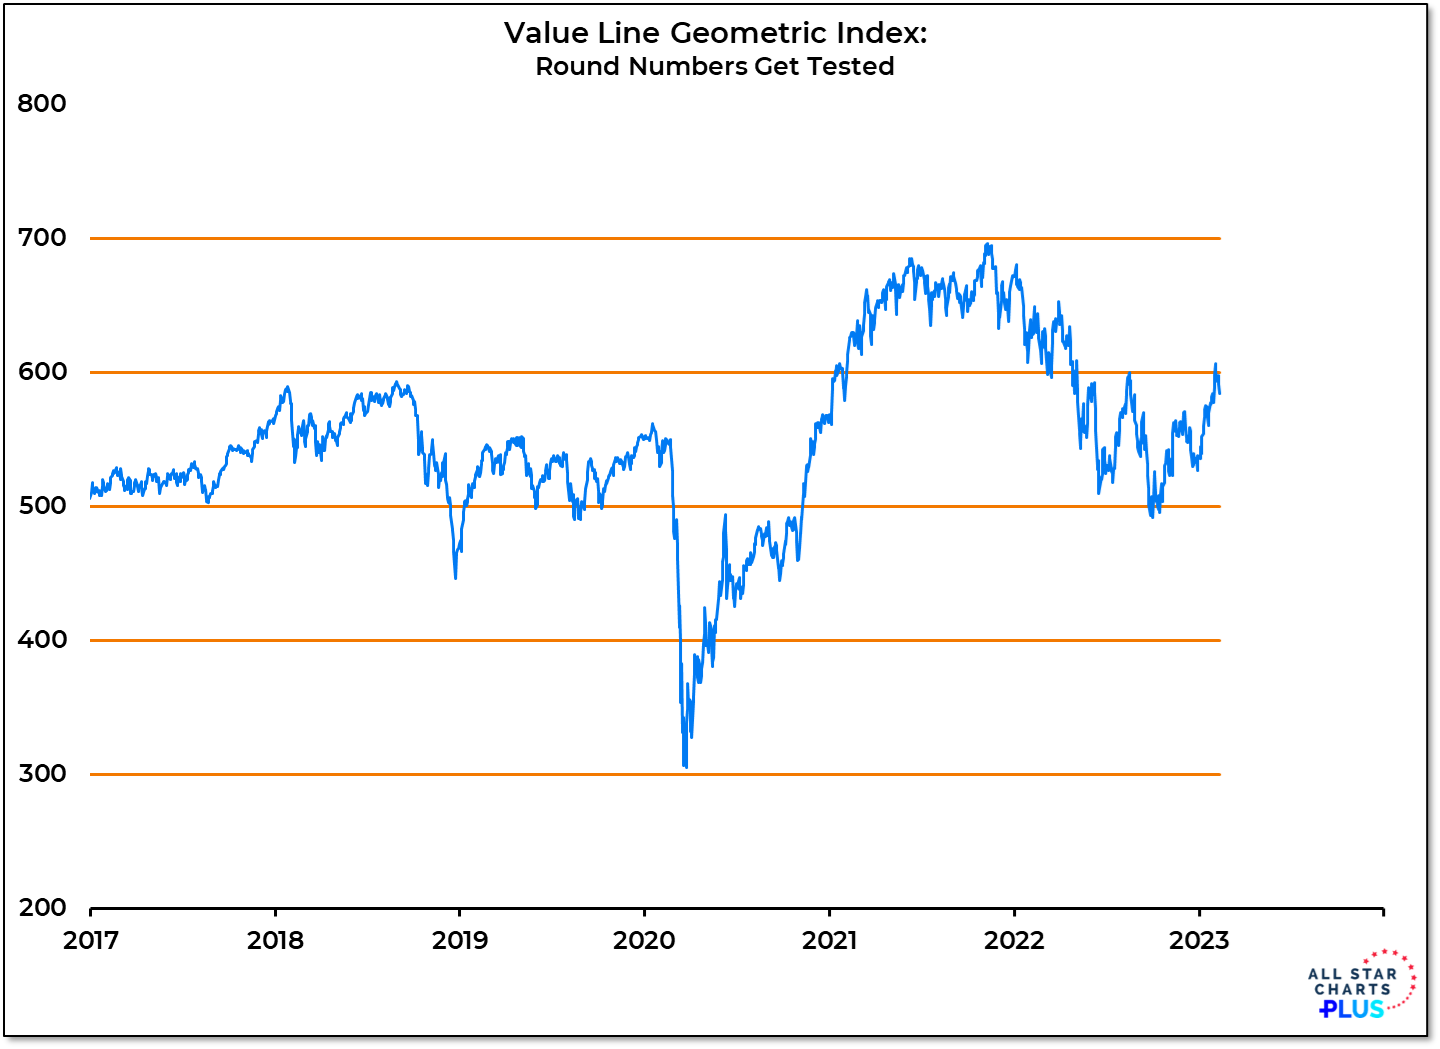
The Value Line Geometric Index peeked above its August high but it continues to struggle with sustaining strength. We don’t have evidence at this point of that being a meaningful peak but for now this proxy for the performance of the median US stock is trodding across well-traveled ground.
More Context: The Value Line Geometric index has a penchant for living between round numbers. In the years prior to COVID, it moved up from 500 to 600 and back down to 500. During 2020, it dropped to 300 before recovering and settling in beneath 500. A break above that level led to a quick test of 600, Further strength carried it to 700 in late 2021. It paused at 600 before spending most of last year moving back and forth between 500 and 600. After a strong start to the year for stocks, some near-term consolidation (especially in the US) would not be surprising. If recent patterns hold, that could mean the Value Line Geometric Index moving back toward 500. If that scenario is going to play out, we are likely to see more broad market weakness than is currently being observed. Right now we are in the midst of the longest stretch of more stocks making new highs than new lows (28 days and counting) since July 2021.
In our Market Notes, we look across time frames at evidence that the rally off of the Q4 lows may be due for pause and what that means for asset allocation decisions going forward.
From the Desk of Willie Delwiche.
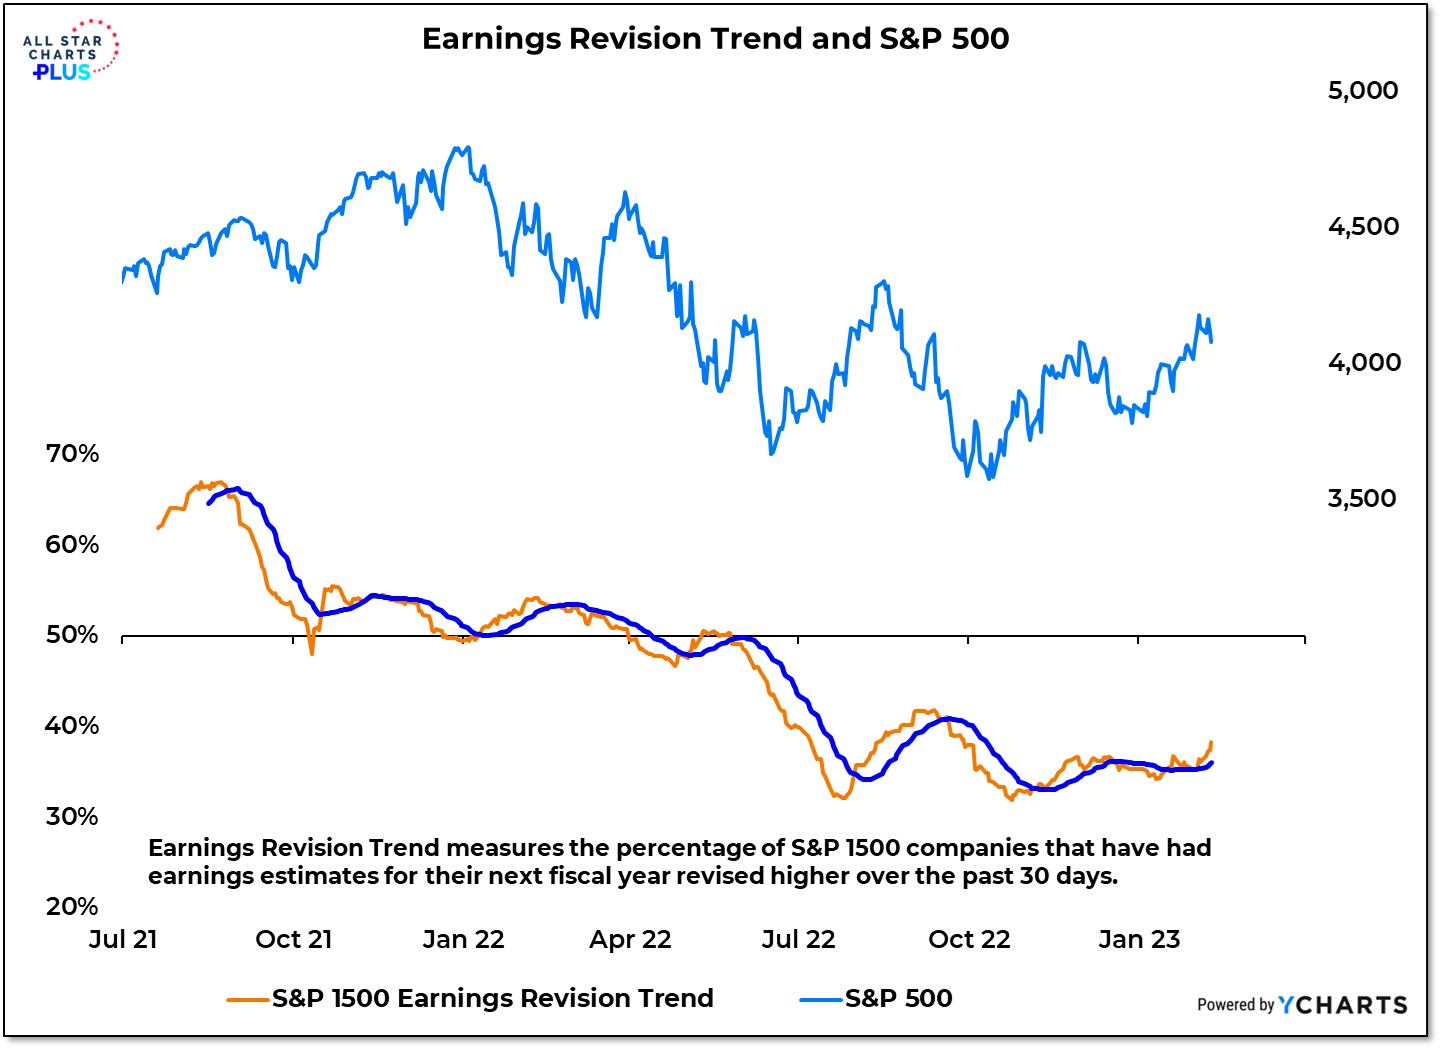
Nearly three-quarters of the way through Q4 earnings season, two things stand out: stocks that have reported earnings misses have been less severely punished than in the past and an increasing number of companies are having their earnings estimates for the coming year revised higher.
Why It Matters: This earnings season has hardly been spectacular and the percentage of companies beating estimates has been below average. Aggregate earnings numbers may (or may not) need to be revised lower as we move through 2023. But at this point, the worst case scenarios are not playing out and that has left plenty of folks offsides. Investors have moved to embrace the strength we have seen so far in 2023 and analysts are running higher numbers through their models. After seeing fewer and fewer upward revisions to earnings estimates in H2 2021 and H1 2022, the trend stabilized over the second half of last year and for now is ticking higher. The market doesn’t tend to get into too much trouble when analysts have gotten too pessimistic.
This is the video recording of the February 9th, 2023, Weekly Town Hall w/ Willie Delwiche.
2/9/23 2:00 PM ET [Read more…]
From the desk of Willie Delwiche.

Bulls on the Investors Intelligence survey continued to climb while bears fell for the fifth week in a row. The bull-bear spread has now decisively cleared its August high as investors move to embrace the stock market rally.
Why It Matters: One of the missing ingredients for sustained stock market strength last year was the embrace of investors. To be fair, investors did not abandon equities from a positioning perspective and, in fact, during the record stretch of more bears than bulls on the AAII survey, equity ETFs have still seen nearly a quarter-trillion dollars of inflows. Nonetheless, rally attempts last year brought neither broad market strength (in the form of new highs > new lows) nor a meaningful expansion in optimism. In 2023, investors are seeing strength and believing that it can persist. That can become a self-fulfilling prophecy (at least for a while). Almost all of the net gains in the S&P 500 since 2015 have come with the bull-bear spread above 18.
In this week’s Sentiment Report we take a closer look at how investors are updating their views in light of the strength that has been seen in the early going of 2023.
From the desk of Willie Delwiche.

The macro factors are all bearish and the market factors are all bullish. It is true that after a bottom market conditions will tend to improve ahead of macro conditions. But it is also true (and we had ample evidence of this last year) that market conditions are subject to false starts. In those situations embracing unsustainable strength can penalize investors. This a trust but verify environment in which indicators of sustained trend have more weighting than one-off signals of opportunity. With the weight of the evidence balanced between risk and opportunity, this may be a time to move toward benchmark exposure, while focusing on areas of relative leadership and absolute strength.
Our Weight of the Evidence Dashboard fills in the details and includes a few charts that have our attention heading into February.