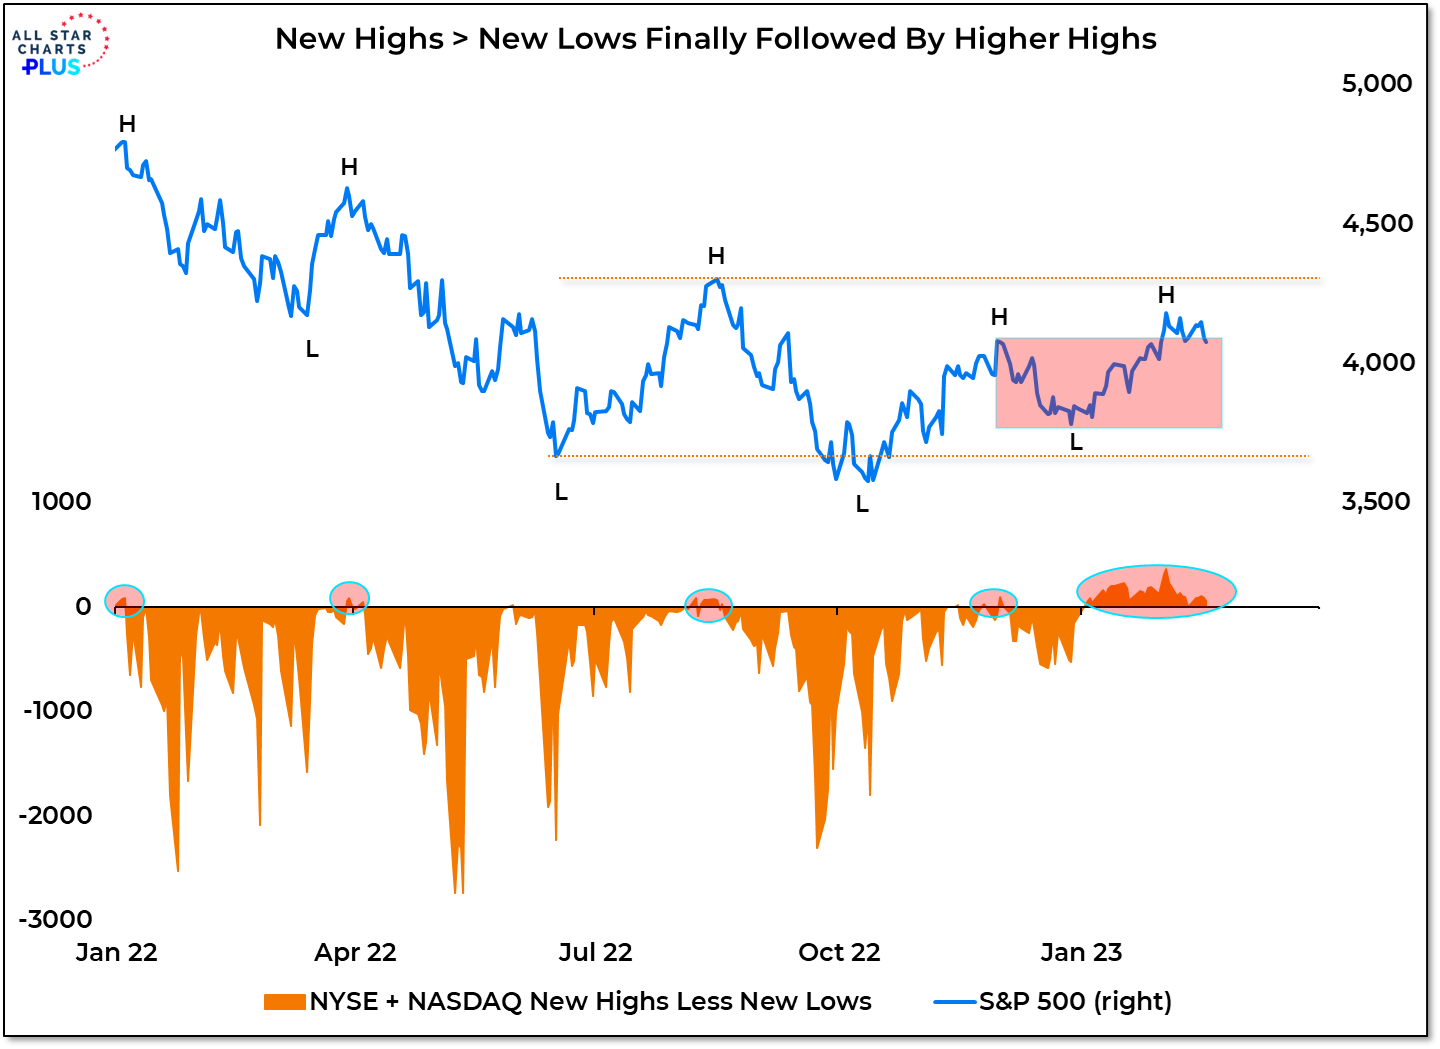
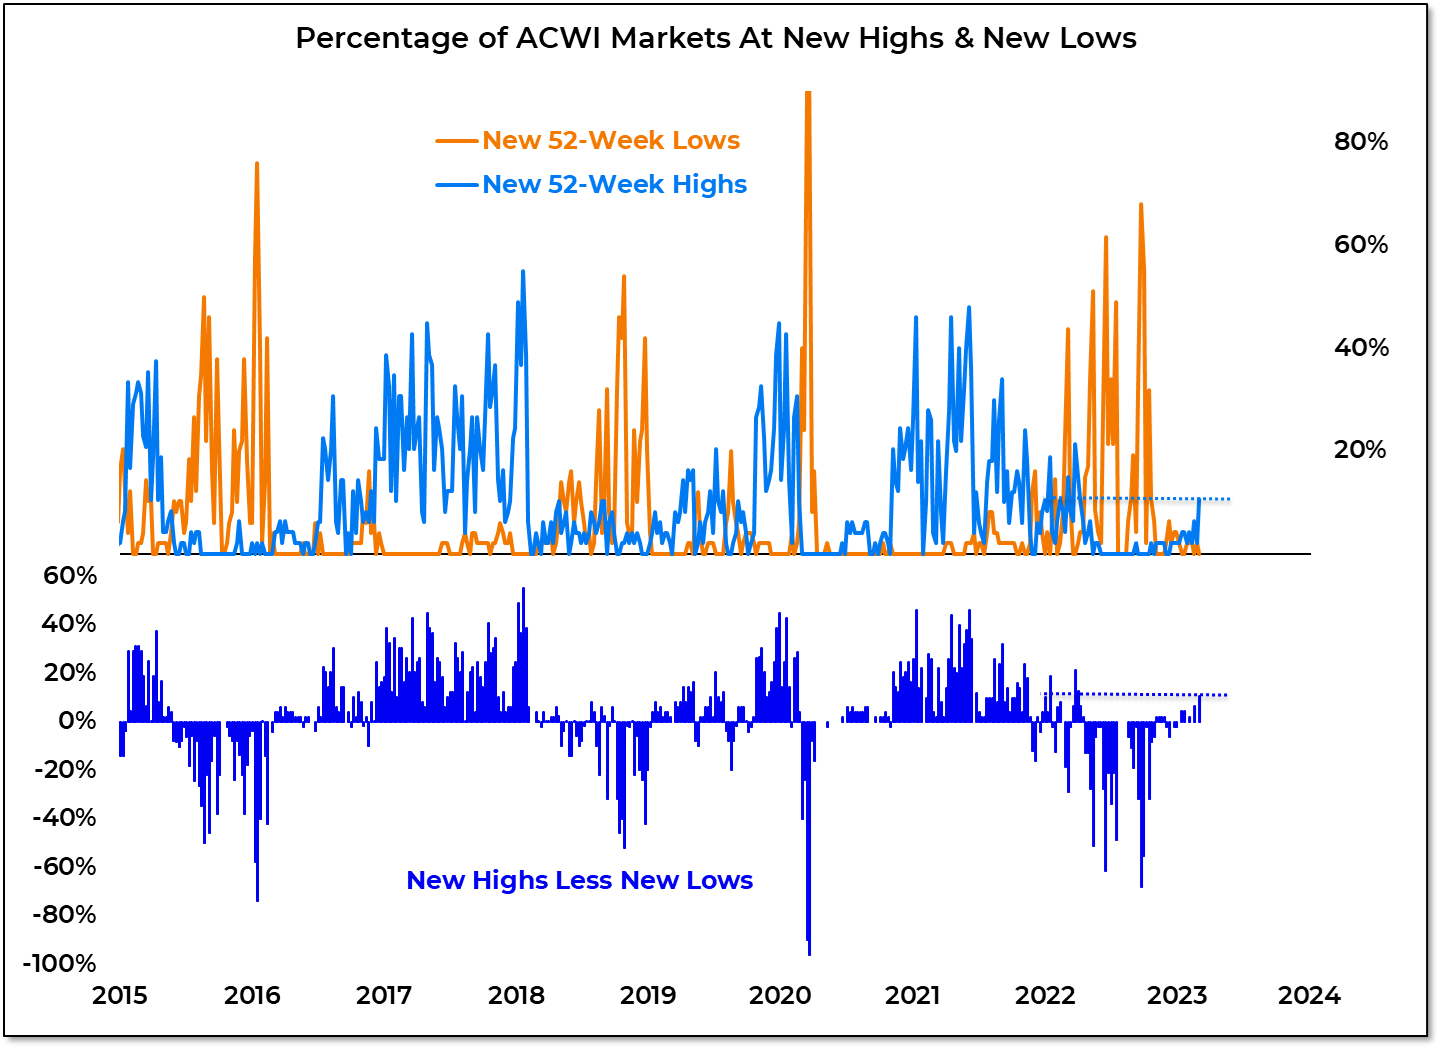
Key Takeaway:
- Volatility is taxing investor portfolios
- Stocks reckoning with new liquidity regime
- New lows are expanding as selling pressure crescendos
Expert technical analysis of financial markets by JC Parets
by Peter
Key Takeaway:
by Peter
Key Takeaway:
by Peter
From the desk of Willie Delwiche.
Key Takeaway:
by Peter
From the desk of Willie Delwiche.
Key Takeaways:
Stocks continued to bounce off of their March lows last week. It’s not quite lipstick on a pig but this move does take some of the sting off of what has been a weak Q1 for equities. All eleven sectors in the S&P 500 are now in positive territory for March, but only three (Energy, Utilities and Financials) have YTD gains and two of those, just barely so. Four sectors, accounting for more than 50% of the market cap of the S&P 500, are still down 8% or more heading into the final week of the quarter.
by Peter
From the desk of Willie Delwiche.
It has an ominous name, but not much of a signal. The so-called “Death Cross” occurs when the 50-day average closes below the 200-day average. Today, for the 25th time since 1970, that will happen for the S&P 500. This table shows both where the S&P 500 tends to be in relation to its peak when these Death Crosses have occurred in the past and the experience of the index in the wake of past crosses.
In aggregate, forward returns following Death Crosses are not meaningfully different from any random day in the market over the past 50 years. This is more noise than news and these crosses mostly reflect an index that has pulled back from its peak. The S&P 500 is currently 13% below its January peak, which puts the current Death Cross in line with the historical pattern. The relationship between the 50-day average and the 200-day average describes an environment but is not likely to shape the path going forward.
by Peter
From the desk of Willie Delwiche.
Key Takeaways:
While the leaders of the last decade are weakening, the laggards of the last decade are gaining strength. Commodities are making new highs and Energy, which is the worst performing sector over the past 10 years, is the only sector in the S&P 500 in positive territory on a YTD basis. Globally, we are seeing strength and leadership from the rest of the world versus the US. Trends in Emerging Markets versus Developed Markets are as strong as they have been in over a decade. As we see these shifts, staying in harmony with the trend is critical. “Time in the market” can be a waste of time if you are in the wrong market.
by Peter
From the desk of Willie Delwiche.
Key Takeaways:
In the wake of the January sell-off, US stocks have been trying to get back in gear. So far that has been easier said than done. The initial rally attempt on the S&P 500 stopped short of the 50-day average and our sector trend indicator was unable to get back into positive territory. One telling sign that a churning/trading range environment remains intact is the new lows continue to outnumber new highs across the NYSE and NASDAQ. Since 2000 all of the net gains in the major US indexes have come in the 70% of the time that the net new high advance/decline line has been trending higher. Right now it’s been moving lower since mid-November – with less intensity than a few weeks ago, but lower nonetheless. It is exceedingly difficult for the indexes to make sustained upside progress when more stocks are making new lows than new highs.
by Peter
From the desk of Willie Delwiche.
Key Takeaways:
Key to last week’s shift in the weight of the evidence from bullish to neutral was the continued deterioration in breadth trends, especially in the US. On everything except the shortest of time frames we continue to see more new lows than new highs. Over the past two months, there have only been two trading days on which the NASDAQ saw more new highs than new lows. Almost half of the sectors in the S&P 500 (5 of 11) are down over 8% for the year already..
Only two sectors are in positive territory for the year and for one of those it is just barely. The one sector that is up meaningfully (Energy, +25% YTD) is such a small part of the S&P 500 that excluding entirely would drop the indexes performance by less than one percentage point (the S&P 500 is down 5.8% YTD, the S&P ex Energy is down 6.6%).