This is the video recording of the February 2nd Weekly Town Hall w/ Willie Delwiche & JC Parets
02/03/22 2:00 PM ET [Read more…]
Expert technical analysis of financial markets by JC Parets
This is the video recording of the February 2nd Weekly Town Hall w/ Willie Delwiche & JC Parets
02/03/22 2:00 PM ET [Read more…]
From the desk of Willie Delwiche.
It’s difficult to stay on top of things if you don’t periodically pause for reflection.
What did you do yesterday that you want to do more of tomorrow? What do you want to do less of tomorrow? Rarely is any single day a make or break situation. But success over time is about leaning into the things that work and leaning away from the things that don’t work.
From an investing perspective, it’s about trusting prices and their trends. This involves tilting toward the parts of the market that are moving higher, while avoiding areas that are moving lower. It’s about avoiding “should” and dealing with “is”. The market is dealing with a negative reaction to disappointing data from several stocks that are in well-established downtrends as I type. That really shouldn’t be that big of a surprise. Stocks making new lows tend to be those in downtrends, while those making new highs tend to be those that are in uptrends. That’s the way the world works.
Last week I mentioned ordering seeds and starting to plan the summer garden. In addition to taking stock of what we had left from last year, we also had to ask ourselves questions about what worked and what didn’t, what we wanted more of, and what we could do without.
What did we figure out?
With the weight of the evidence turning neutral and our tactical risk management model arguing for more caution, we have reduced our equity exposure and raised some cash in our Cyclical and Tactical Opportunity Portfolios.
From the desk of Willie Delwiche.
Key Takeaway: Investor sentiment looks washed out – at least for now. Investor sentiment was a headwind early in 2021 but more recently had been a neutral market influence from our weight of the evidence perspective. Now, with the indicators pointing toward fear and pessimism and equity inflows sputtering to start 2022, it looks like sentiment now is a tailwind for equities. How long that persists remains to be seen. Seeing pessimism and fear remaining elevated even as if stocks stop going down could help sow the seeds for an unloved rally. Longer-term, there remain imbalances from a valuation and asset allocation perspective that remain unresolved.
Sentiment Report Chart of the Week: Equity Fund Inflows Sputter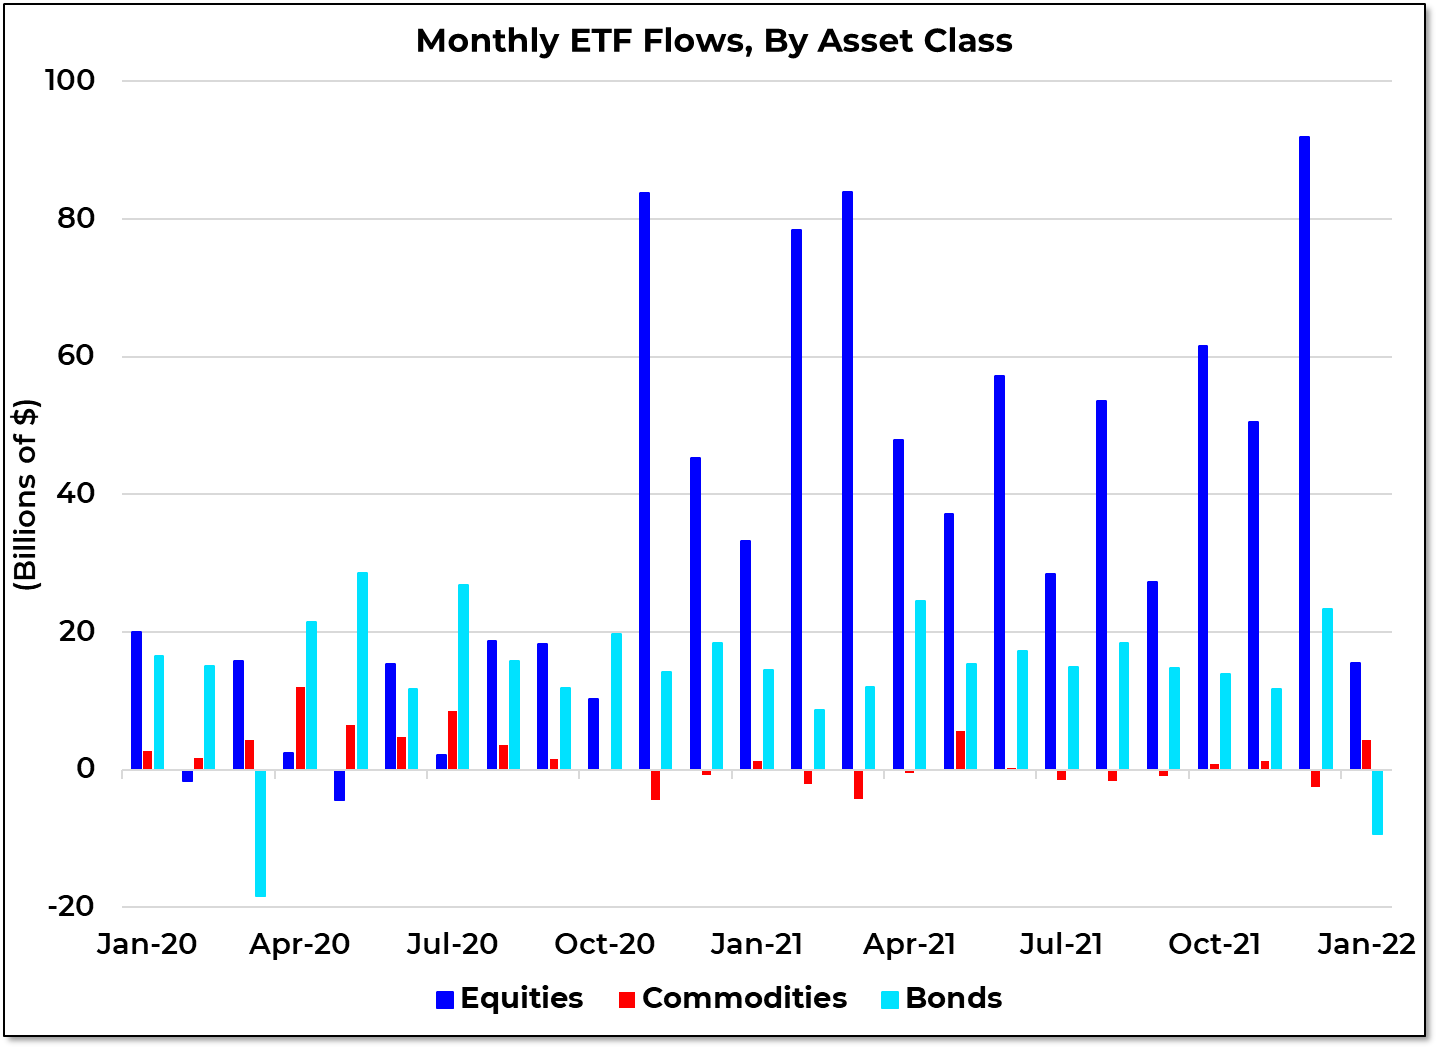
Equity ETFs saw their 20th consecutive month of inflows in January, but last month’s inflows were the smallest since October 2020 and a sharp slowdown from a record-setting December (from $90B to $15B). January tends to be one of the weaker months when it comes to inflows, so whether this is a breather or the beginning of a new trend remains to be seen. Elsewhere, bond funds had their first month of outflows since March 2020 while commodity funds (which experienced net outflows for 2021 as a whole) had their largest inflows since May.
From the desk of Willie Delwiche.
This All Star Charts +Plus Monthly Playbook breaks down the investment universe into a series of largely binary decisions and tactical calls. Paired with our Weight of the Evidence Dashboard, this piece is designed to help active asset allocators follow trends, pursue opportunities, and manage risk.
From the desk of Willie Delwiche.
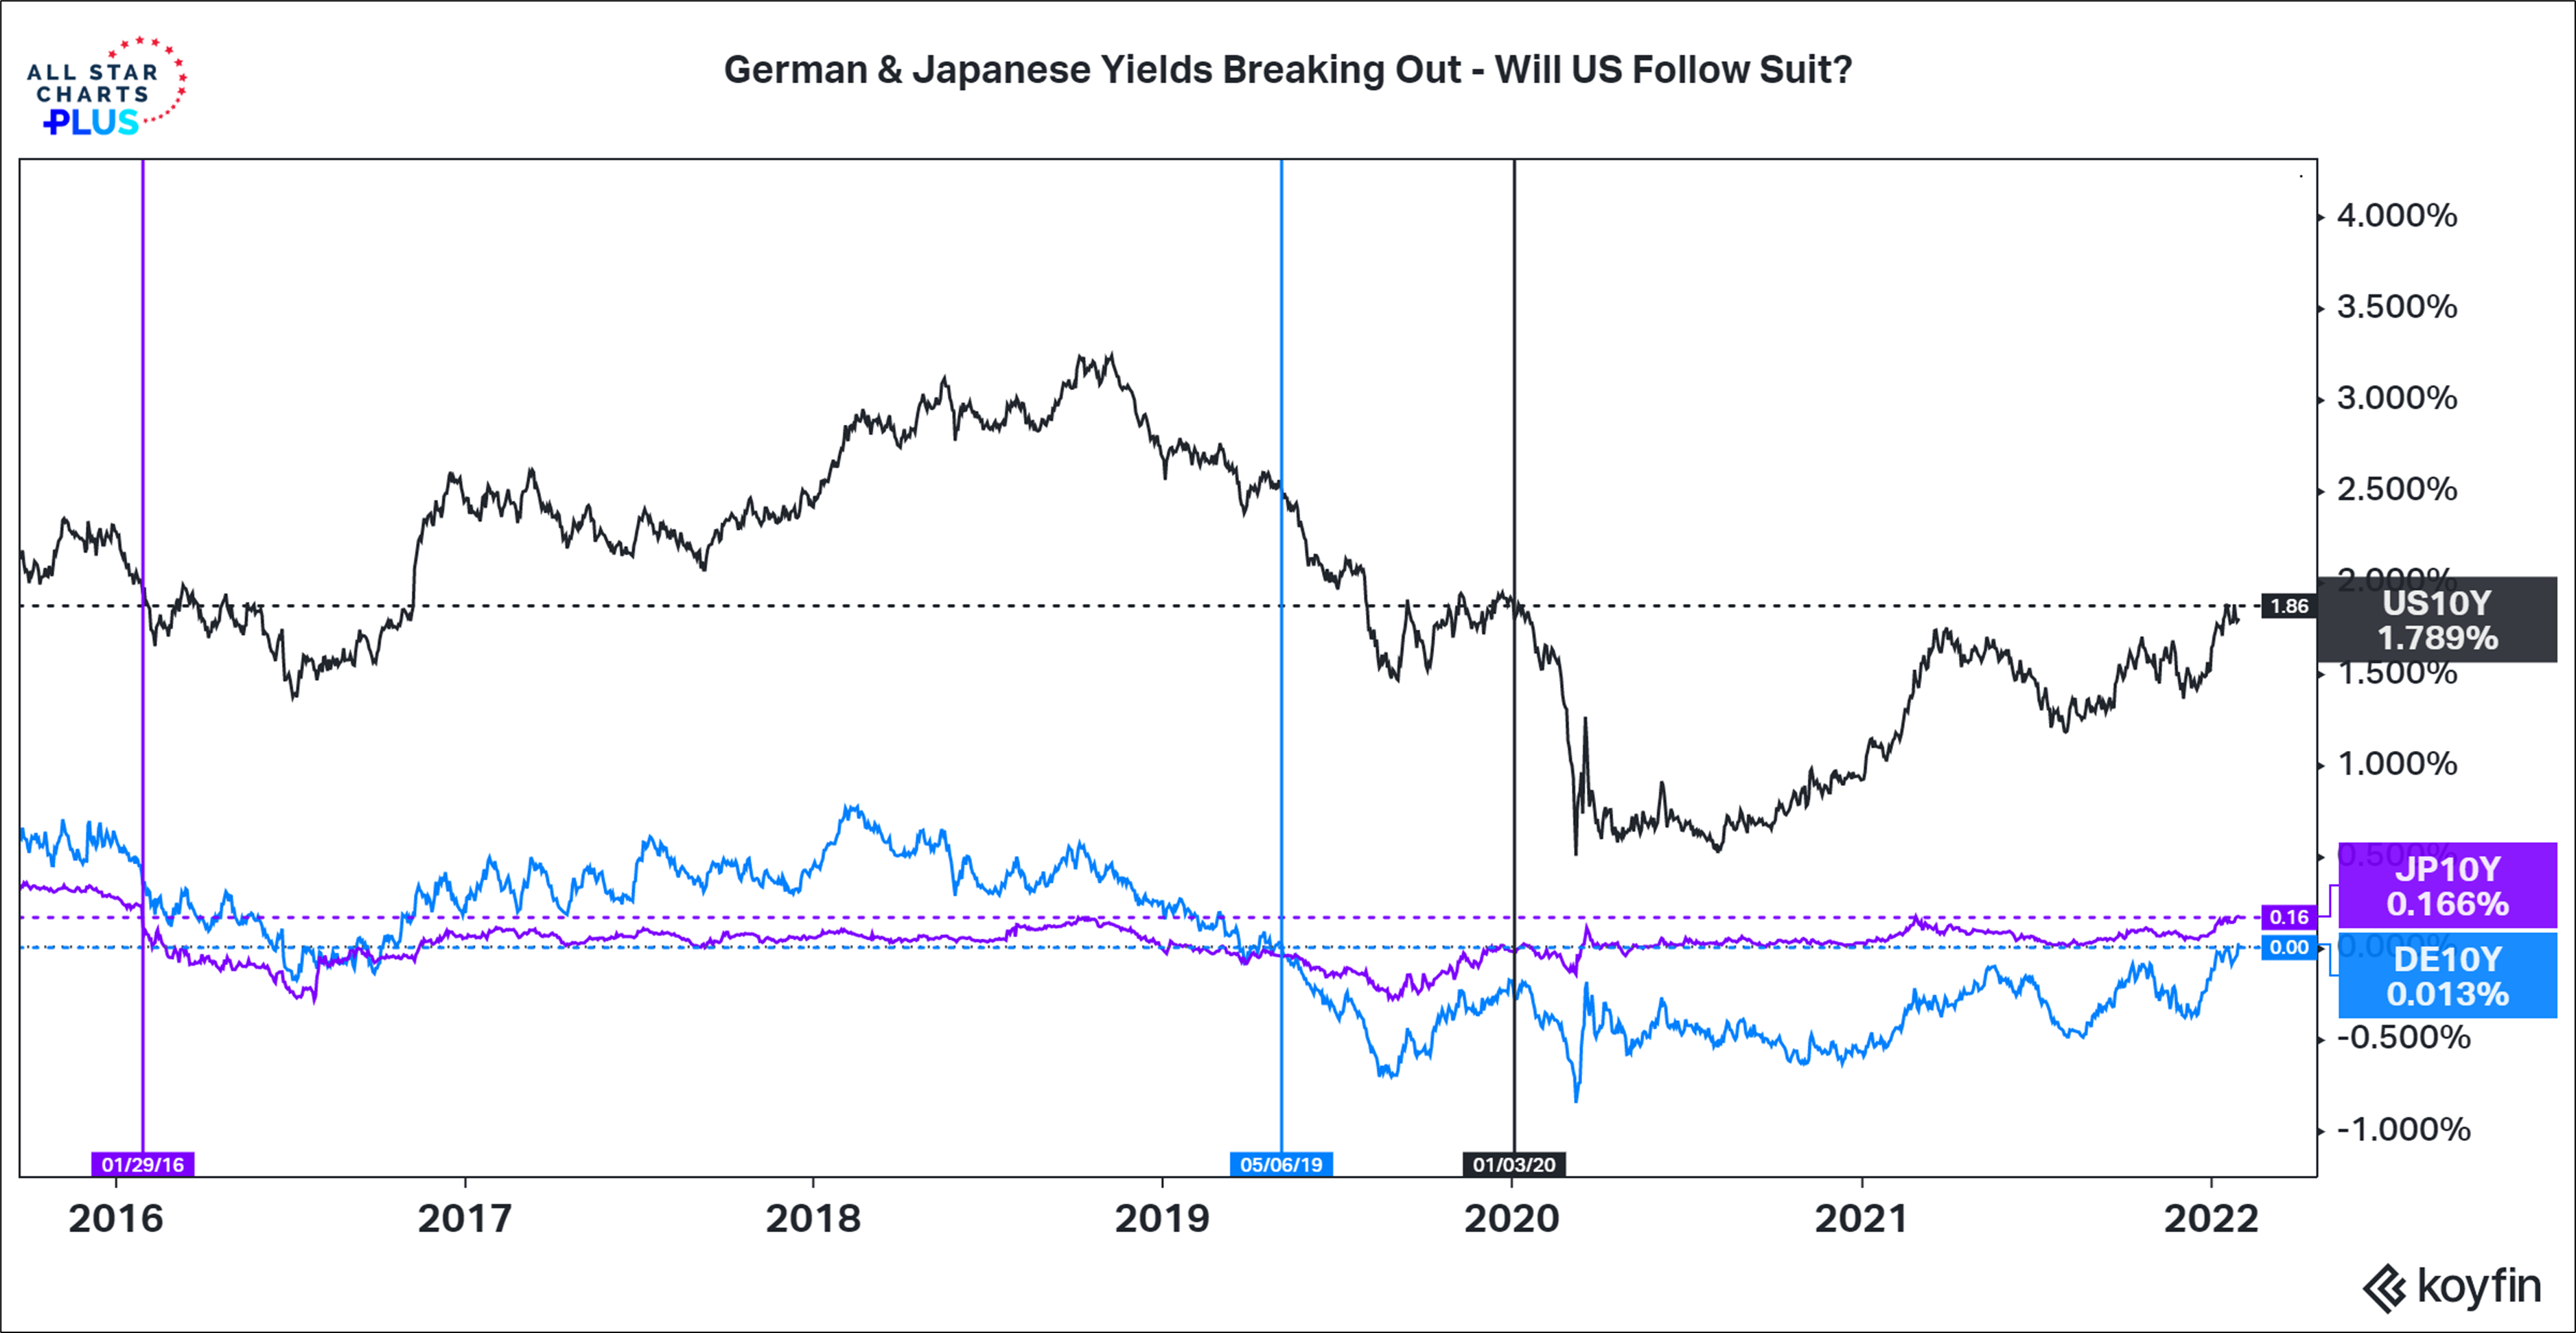
This more challenging trend backdrop comes at a time when bond yields are rising and central banks are tightening. On both of these fronts, the US is following global developments. The Fed continues to chase inflation, but at least at this point it’s finally paying attention. Maintaining that focus could be a challenge if economic data continues to come in weaker than expected. Friday’s employment report could be a big test. US bond yields are off their highs, but breaking out around the world. German 10-year yields are trying to get through resistance at zero and back into positive territory for the first time since 2019. Japanese 10-year yields are at their highest in over 6 years.
From the desk of Steve Strazza @Sstrazza
Our Top 10 Charts Report was just published.
In this weekly note, we highlight 10 of the most important charts or themes we’re currently seeing in asset classes around the world.
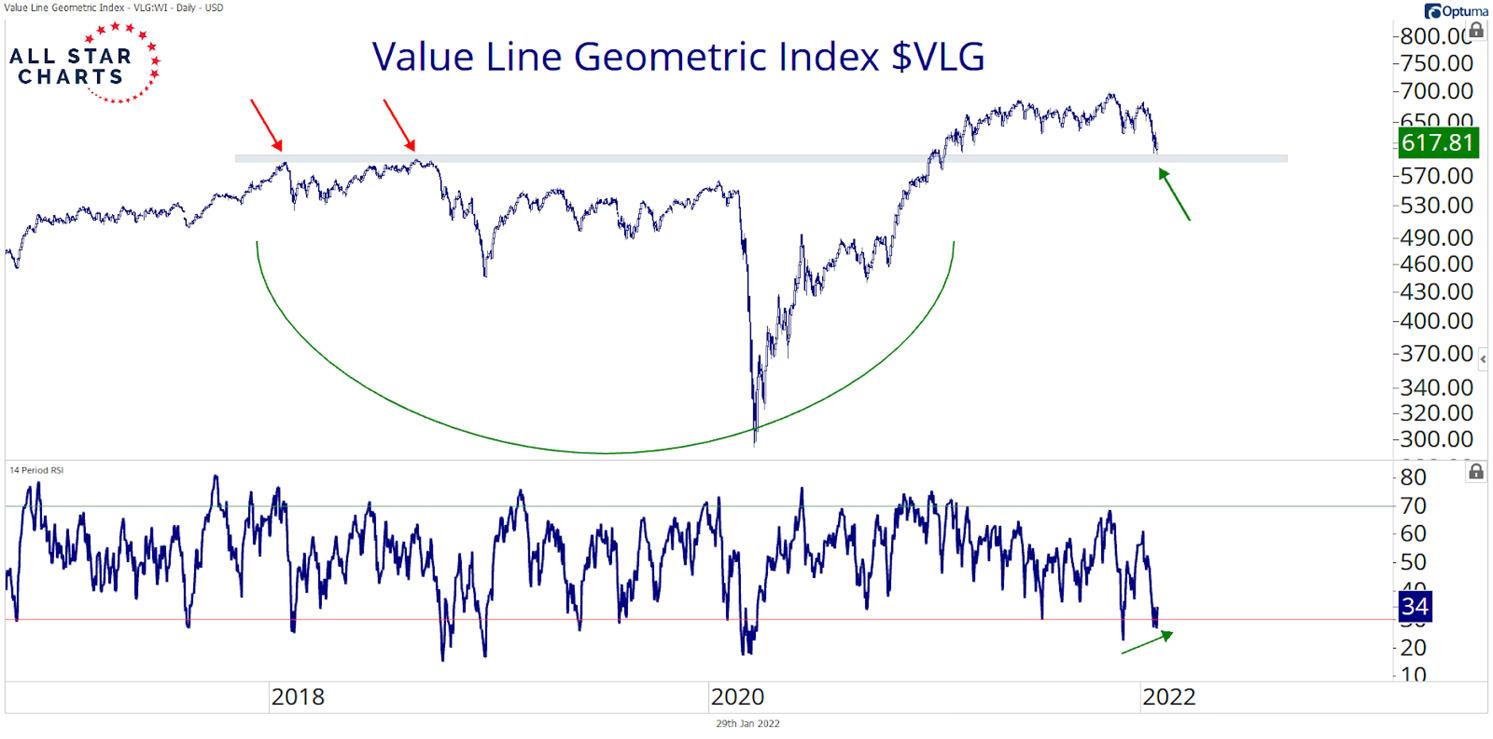
Testing Former Resistance
We’ve been pounding the table on the importance of defending the 2018 highs for a long time. These levels represent when risk assets peaked four years ago. The chart below shows the Value Line Geometric Index pulling back to its 2018 highs. This index measures the median stock performance and is an excellent way to view how the overall market is doing. Right now, it’s telling us that the average stock has endured significant damage and has erased almost all of the progress from recent years. Bulls really want to see these 2018 highs hold. If they do, the bias is still higher and the structural trend is intact. But if this level is breached, it will be a major bearish development for the broader market and risk assets in general.
