This is the video recording of the March 4th Town Hall Meeting w/ Willie Delwiche & JC Parets.
03/04/21 2PM ET [Read more…]
Expert technical analysis of financial markets by JC Parets
This is the video recording of the March 4th Town Hall Meeting w/ Willie Delwiche & JC Parets.
03/04/21 2PM ET [Read more…]
From the desk of Steve Strazza.
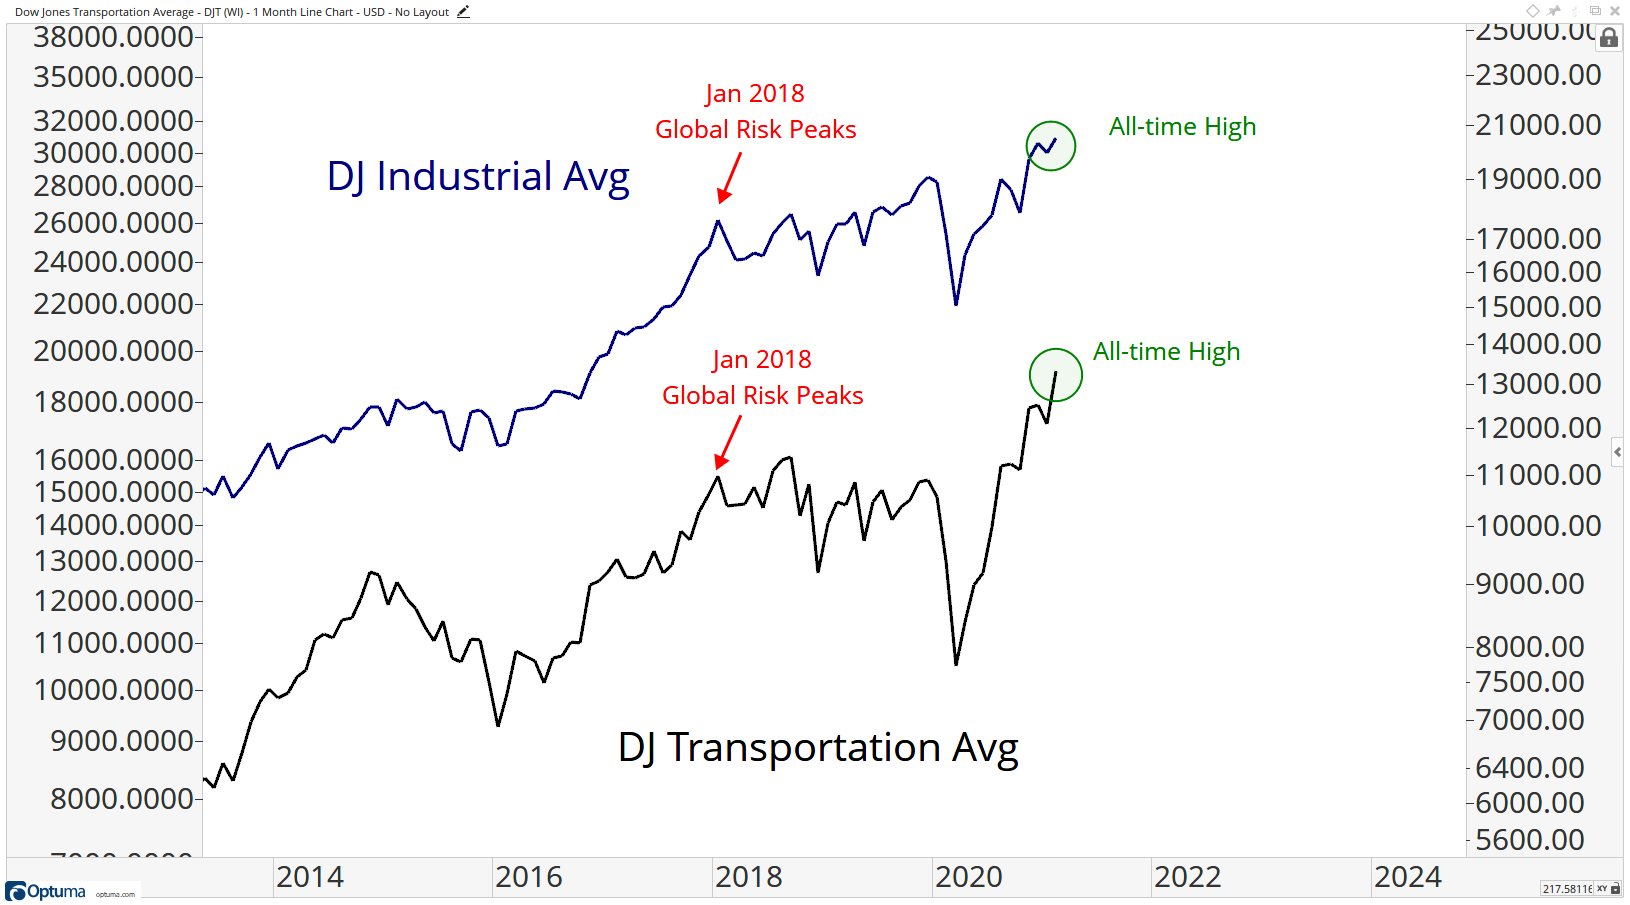
1. No More Divergences For The Dow
There had been a classic “Dow Theory” divergence in place for several years, dating back to when the Dow Transportation Average peaked in 2018. This cleared itself up late last year when Transports actually beat Dow Industrials back to new all-time highs. They’ve continued to lead in the time since. What really matters though is that both continue to grind higher, confirming one anothers new highs along the way. We often talk about Modern or 21st Century “Dow Theory,” which uses the Semiconductor Index in place of Transports. This is because a strong argument can be made that semis are the new drivers of what is now a mainly services-based economy in the US (and abroad). While Transports continue to trade more or less at record highs, Semiconductors haven’t made a new high in over two weeks now. With money rotating out of Growth and Tech, this is something we’re keeping a close eye on. While a change in leadership is just fine, and actually something we’re anticipating, we still want to see these stocks participate on an absolute basis as they are imperative to the world economy.
From the desk of Willie Delwiche.
Key takeaway: Another bout of late-month market volatility produced quickly frayed nerves. The VIX spiked and put/call ratios moved away from excessive complacency. Our tactical sentiment indicators point to still-elevated optimism even as sentiment surveys have eased recently. Risks arise when breadth deteriorates and a sustained shift from optimism to pessimism emerges. We are not seeing this yet. The $78 billion of equity ETF inflows in February (over the past two months equity ETFs have seen daily net outflows on only 3 occasions) suggests excessive investor positioning, but the risks inherent in that have not yet been manifested. Despite last week’s volatility, cyclical sector leadership persisted and defensive areas made new lows. That does not suggest investors are moving quickly to a risk-off posture.
Sentiment Chart of the Week: XLU/SPY & XLP/SPY Ratios
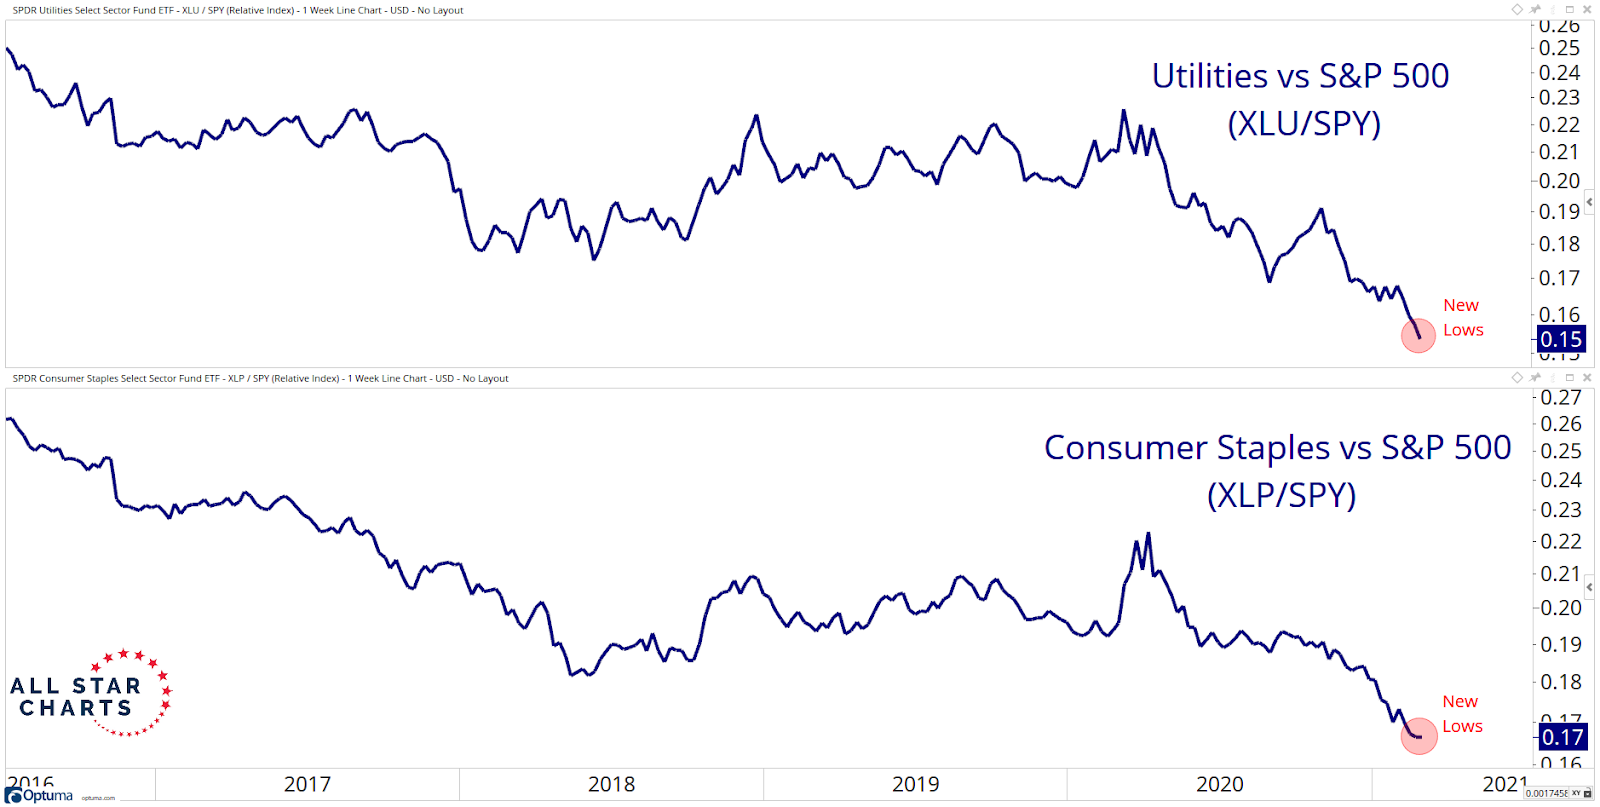
Two of the most defensive sectors, Utilities and Staples, made new lows relative to the broader market last week. These ratios depict a risk-on environment that supports higher prices in stocks.
From the desk of Willie Delwiche.
This All Star Charts PLUS Monthly Playbook breaks down the investment universe into a series of largely binary decisions and tactical calls. Paired with our Weight of the Evidence Dashboard, this piece is designed to help active asset allocators follow trends, pursue opportunities, and manage risk.
From the desk of Willie Delwiche.
Momentum fades but firming economy keeps evidence bullish.
From the desk of Willie Delwiche.
Key Takeaway: Market volatility has not interrupted rotation to new leadership. Long-term breadth remains robust, but shorter-term trends are in need of repair. Earnings and economic data continue to supply the market with positive surprises.
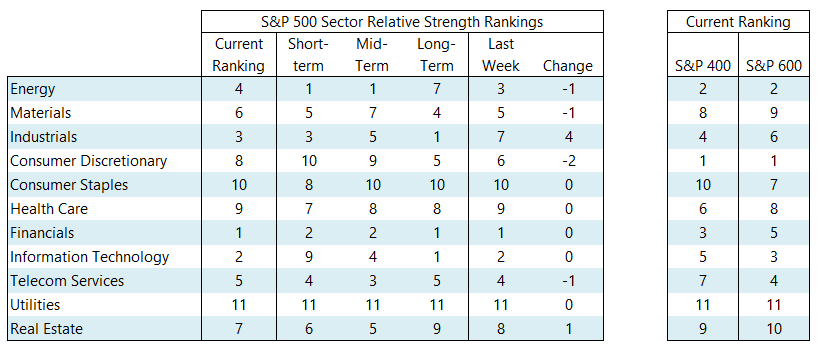
The Industrials sector made a big jump in our relative strength rankings this week, moving from 7th to 3rd among the large-cap sectors. Elsewhere, Consumer Discretionary continued to lose relative strength and Materials dropped out of the top five. Technology remains highly ranked (2nd overall) but on a short-term basis, it has been a market-laggard. If it cannot re-assert strength soon, its time in the leadership group could be winding down. Our industry group heat map shows overwhelming relative strength from small-cap groups (nine of the top ten & only one in the bottom ten) and widespread relative weakness in large-cap groups (none in the top ten and seven of the bottom ten). Deteriorating trends in the Technology groups bear watching.
From the desk of Steve Strazza
Don’t miss this weeks Momentum Report; our weekly summation of all the major indexes at a Macro, International, Sector and Industry Group level. As a reminder, we analyze this shorter-term data within the context of the structural trends at play.
From the desk of Willie Delwiche.
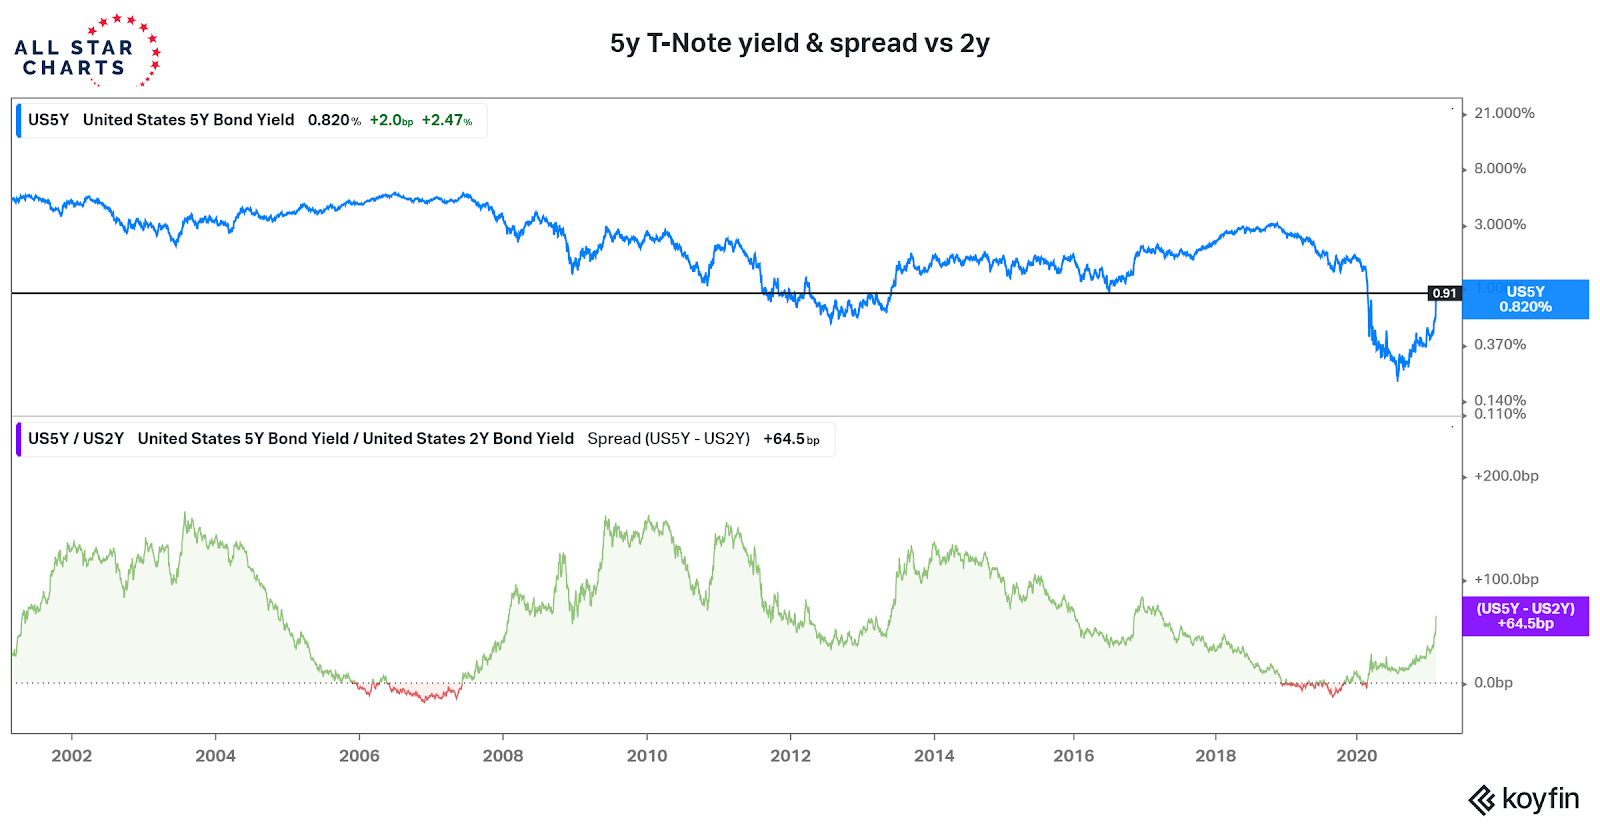
There are plenty of ways to take apart and dissect the move in the bond market that accelerated over the past week. From an investment perspective, if the 11% YTD decline in TLT holds, Q1 statements are going to be a jolt for investors who were led to believe that bonds are a portfolio stabilizer and that you can’t lose money in Treasuries. From a market perspective, bonds are putting pressure on the Fed. It’s not yet showing up in the CPI, but Fed officials claiming not to see any inflation pressure strain credibility. It’s not the rise in yields at the long-end of the curve that will catch the Fed’s eye, but the move higher in the belly of the curve. The short-end remains anchored by Fed actions, but this week saw 3-year, 5-year, and 7-year yields spike. The 5-year yield is approaching resistance at early 2020 levels, while relative to the 2-year yield (which is responsive to Fed policy) the 5-year yield is at its highest level since 2017. For all the talk of central bank omnipotence and bazookas, the bond market > Fed balance sheet. The Fed may need to adjust its approach.