This is the video recording of the May 12th Weekly Town Hall w/ Willie Delwiche.
05/12/22 2:00 PM ET [Read more…]
Expert technical analysis of financial markets by JC Parets
This is the video recording of the May 12th Weekly Town Hall w/ Willie Delwiche.
05/12/22 2:00 PM ET [Read more…]
From the desk of Willie Delwiche.
Volatility is on the rise and some of the reactions we’re seeing are entirely predictable.
For instance, I’ve seen multiple versions of this chart shared in recent weeks:
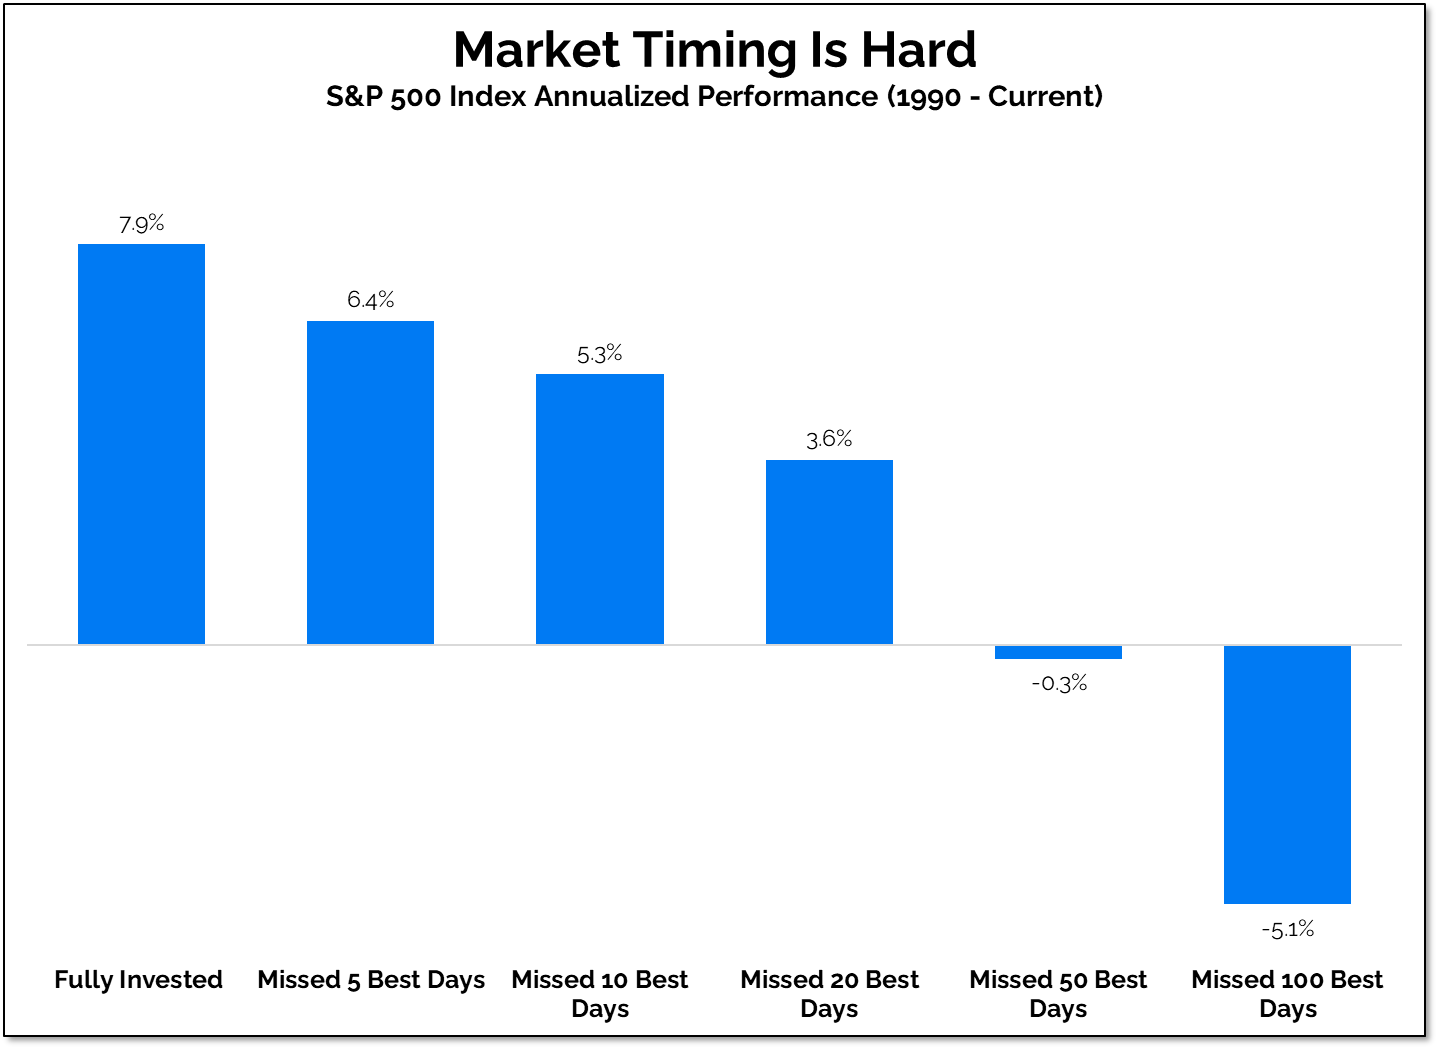
It claims to show how hard it is to effectively time the market. Advisors and strategists use this to scare investors with a seemingly straightforward message: If you miss just a handful of the best days in the market, your returns will suffer.
From the desk of Louis Sykes @haumicharts
This week has seen one of the largest blow-ups in crypto history.
I think the severity of the Luna collapse, in relative terms, can’t be understated.
From trading at $100 a month ago to 2 cents today.
From being the 3rd largest coin in the asset class two weeks ago to currently testing support at zero.
From an 80% drawdown in a “stable” coin that’s supposed to be pegged to $1 USD.
There’s an incredible amount of wealth that’s been lost in this blow-up.
From the desk of Steven Strazza @Sstrazza and Ian Culley @Ianculley
Credit spreads are widening to their highest levels since late 2020.
If it feels like we just mentioned spreads and the falling HYG/IEI ratio, it’s because we did – and for good reason! They provide valuable insight into the overall health of the market.
High yield bonds $HYG rolling over faster than US Treasuries $IEI implies stress on credit markets and trouble for equities.
This is critical information.
We’ve been closely following the HYG/IEI ratio for months as it repeatedly tests the lower bounds of its range. It broke down to fresh lows in March, only to bounce higher with many risk assets.
Two months later, this crucial risk ratio is printing fresh 52-week lows again. The main difference is that the overall market environment has drastically changed since the last time we were at these levels.
Even the strongest stocks can’t catch a bid as investors scramble for the exits. Potential support levels are completely ignored as more topping formations resolve lower.
If the grim reaper hasn’t come for the tickers in your portfolio, it’s most likely just a matter of time before he comes knocking. [Read more…]
From the desk of Steve Strazza @Sstrazza
Welcome to the 2 to 100 Club.
As many of you know, something we’ve been working on internally is using various bottom-up tools and scans to complement our top-down approach. It’s really been working for us!
One way we’re doing this is by identifying the strongest growth stocks as they climb the market-cap ladder from small- to mid- to large- and, ultimately, to mega-cap status (over $200B).
Once they graduate from small-cap to mid-cap status (over $2B), they come on our radar.
Likewise, when they surpass the roughly $30B mark, they roll off our list.
But the scan doesn’t just end there.
We only want to look at the strongest growth industries in the market, as that is typically where these potential 50-baggers come from.
Some of the best performers in recent decades – stocks like Priceline, Amazon, Netflix, Salesforce, and myriad others – would have been on this list at some point during their journey to becoming the market behemoths they are today.
When you look at the stocks in our table, you’ll notice we’re only focused on Technology and Growth industry groups such as Software, Semiconductors, Online Retail, Solar, etc.
Then, like any good technician, we filter the list down to those closest to new highs.
This allows the cream of these strong groups to rise to the top and helps streamline our mission to identify technical breakouts in the top-performing stocks.
From the desk of Willie Delwiche.
Key Takeaway: The unwinding of a liquidity-fueled speculative bubble is weighing on investor sentiment, pushing many indicators into areas that signal excessive pessimism. The challenge in the current environment is the disconnect between how investors say they are feeling and what (if anything) they are doing about it. Popular sentiment surveys are so widely watched that they seem to be producing more noise than signal. This makes less widely followed surveys (like those from Consensus and NAAIM) more useful. ETFs overall have begun to experience outflows, but there is still plenty of evidence that investors are looking for ways to increase equity exposure.
Sentiment Report Chart of the Week: Buying Weakness Isn’t Evidence Of Fear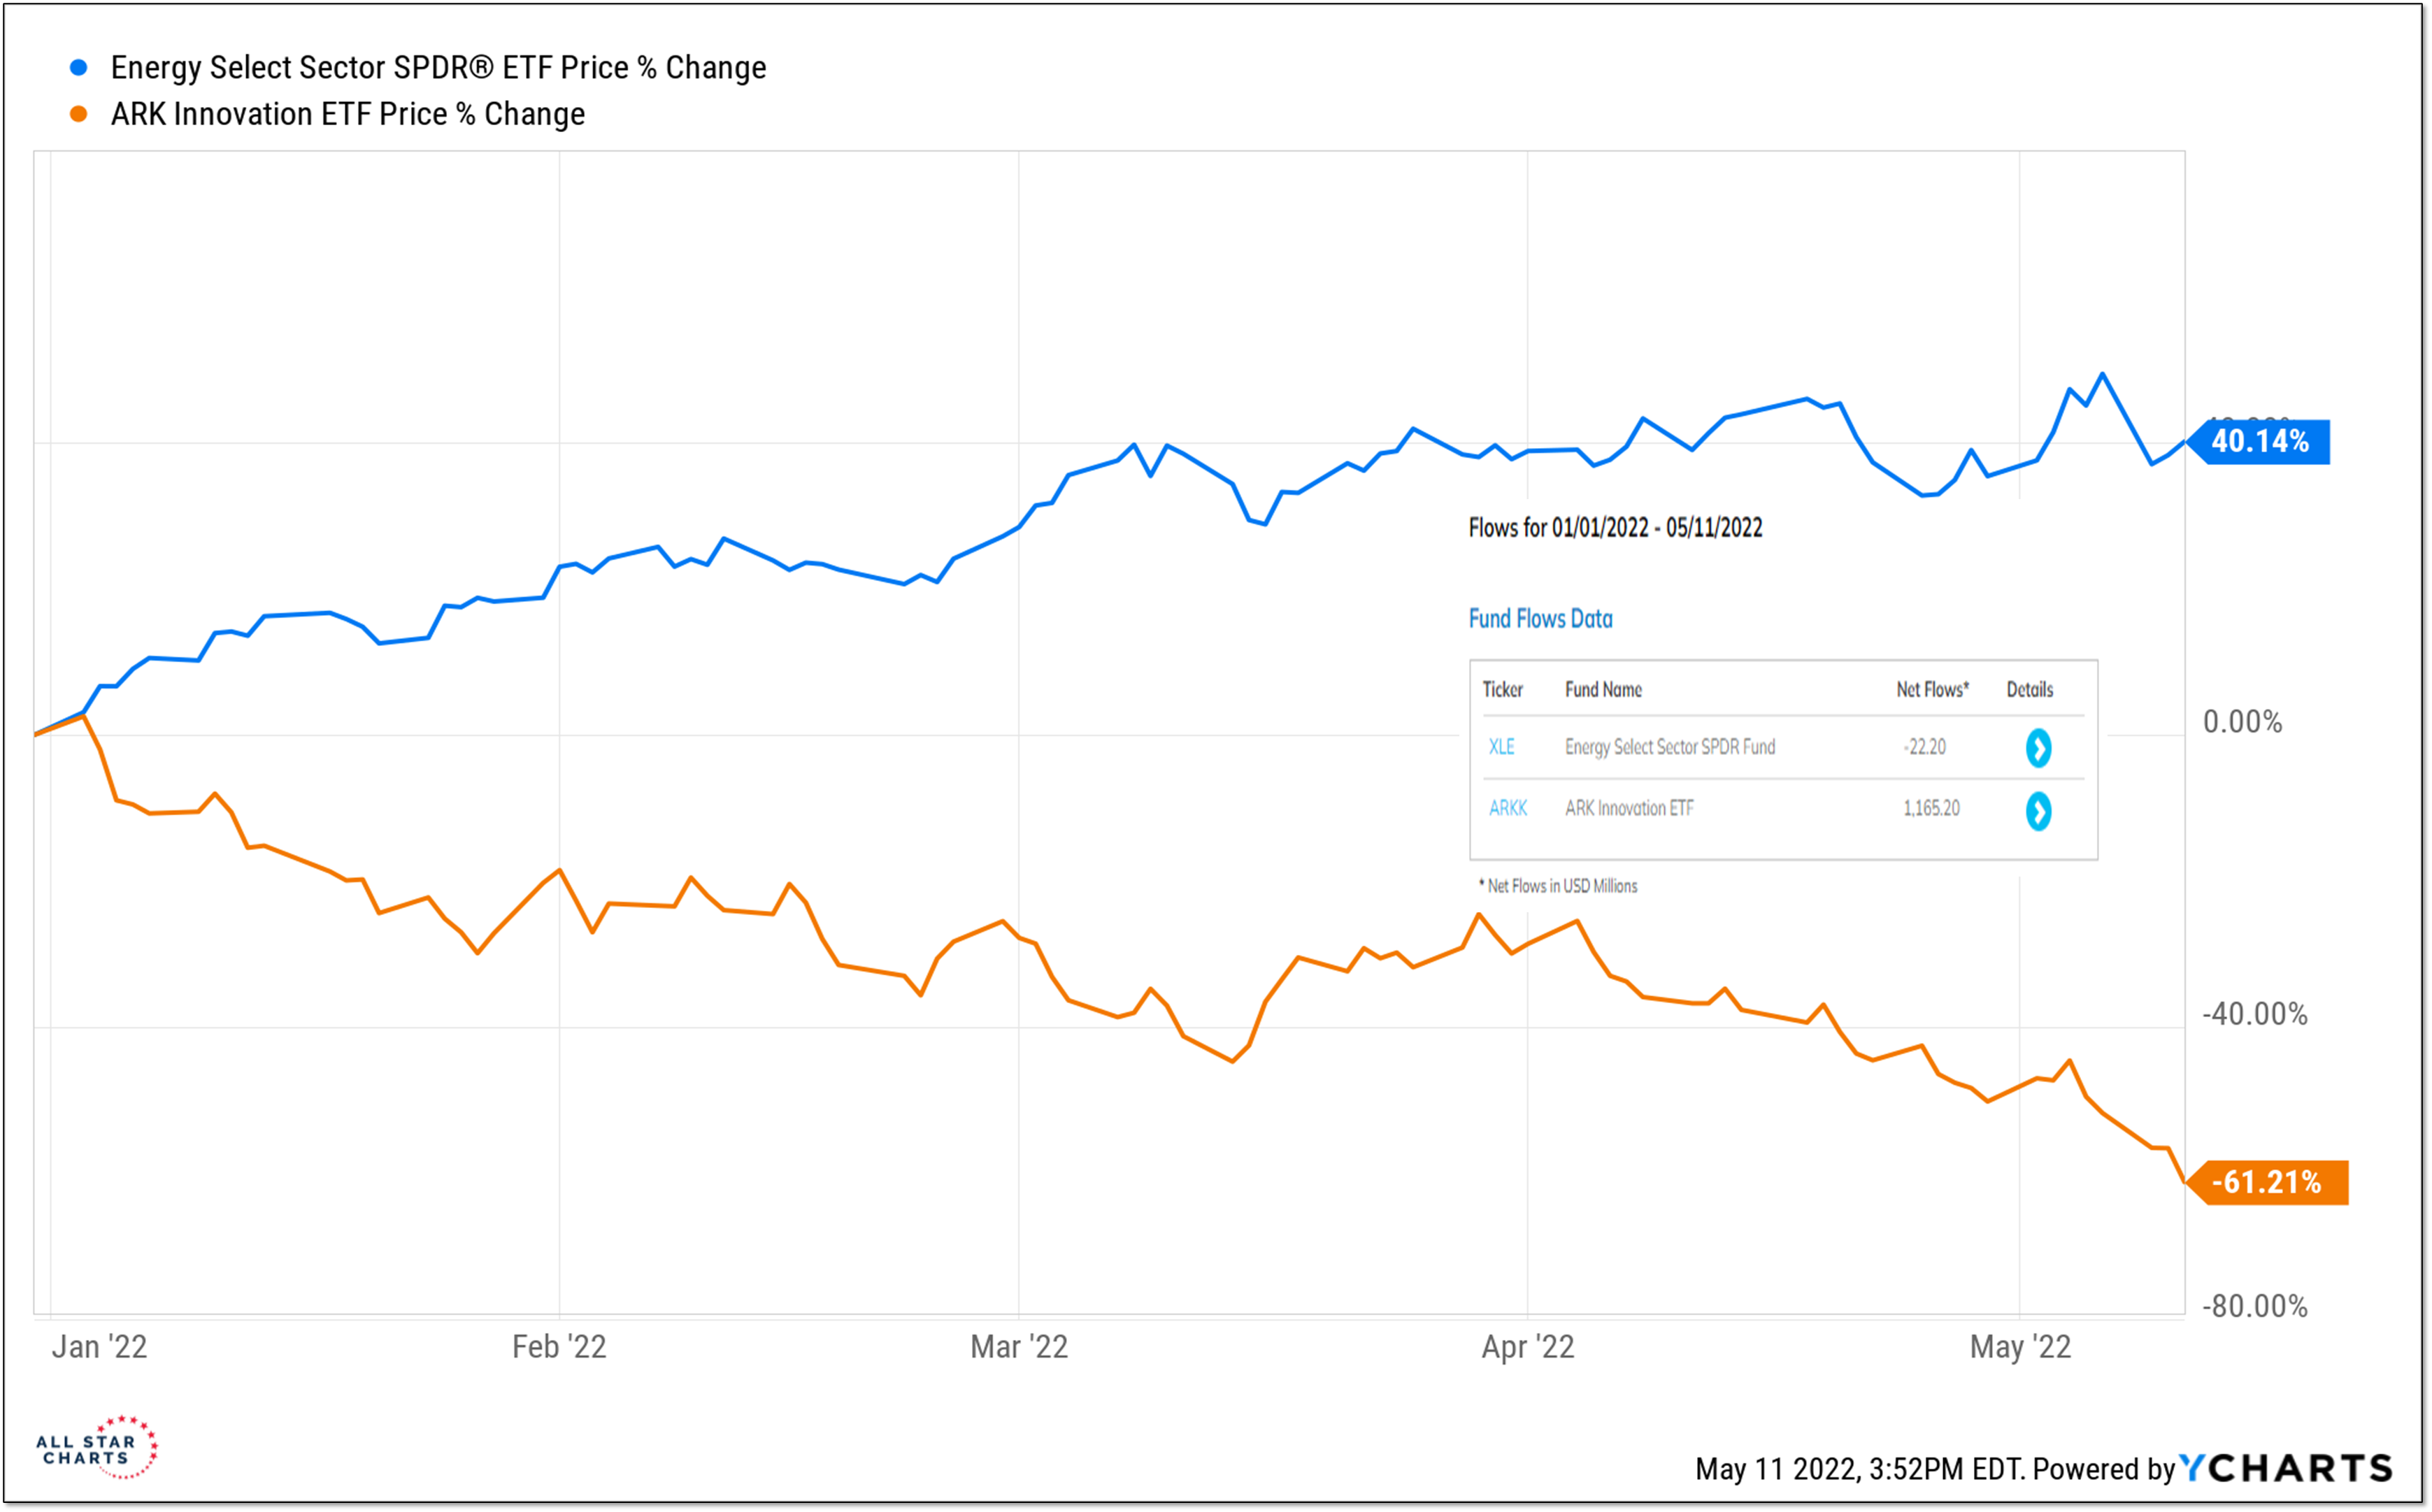
Echoing the message from the AAII asset allocation survey is a Investor Movement Index from TD Ameritrade that shows investors were “net buyers of equities in April.” That’s an unlikely way to express the fear and pessimism that is evident elsewhere. A concrete example of this is what’s happening with the ARK Innovation ETF (ARKK). Despite a year-to-date drawdown of 60%, the fund has experienced net inflows of over $1 billion this year. What is happening in ARKK is the complete opposite of XLE. That ETF is up over 40% year-to-date and has actually experienced net outflows. With volatility rising and liquidity falling, making sense of the crowd has never been harder.