This is the weekly post that aggregates all the charts we put together throughout the week and organizes them all into one, easy to flip through deck.

Expert technical analysis of financial markets by JC Parets
This is the weekly post that aggregates all the charts we put together throughout the week and organizes them all into one, easy to flip through deck.
From the desk of Steve Strazza @Sstrazza
Our Hall of Famers list is composed of the 100 largest US-based stocks.
These stocks range from the mega-cap growth behemoths like Apple and Microsoft – with market caps in excess of $2T – to some of the new-age large-cap disruptors such as Moderna, Square, and Snap.
It has all the big names and more.
It doesn’t include ADRs or any stock not domiciled in the US. But don’t worry; we developed a separate universe for that which you can check out here.
The Hall of Famers is simple.
We take our list of 100 names and then apply our technical filters so the strongest stocks with the most momentum rise to the top.
Let’s dive right in and check out what these big boys are up to.
From the desk of Steven Strazza @Sstrazza and Ian Culley @Ianculley
We’ve pounded the table on the weakness in energy these past few days, so why stop now? When we find ourselves hammering the same topic time and again, there’s usually a very good reason.
As far as energy goes, there’s been a lot of damage done to the space this week.
Breadth fell off a cliff and was not supporting the new highs for energy stocks.
The relative trends have gotten clobbered, as energy has been among the worst-performing sectors over the near term.
And, just today, we’re seeing failed breakouts in energy sector ETFs across the board.
Since we’ve already written about these themes, let’s dive in and see what energy futures themselves have to say about the situation.
Are futures resilient despite these bearish developments?
Or are there cautionary signs in the commodities market that are confirming the weakness in the stock market?
Let’s find out. [Read more…]
From the desk of Steve Strazza @Sstrazza
Energy has been by far the best-performing sector over the trailing 12-month period.
In October, we witnessed a handful of energy stocks and industry ETFs break higher from bases and reclaim their summer highs.
Without a doubt, these are bullish developments for the space.
But over the trailing month, energy has lost that leadership position and has actually been the worst-performing sector in the market.
Today, we’re seeing a lot of the upside resolutions from last month undercut their former highs and turn into failed breakouts.
So, where do we go from here?
When we look at the relative trends in the energy sector, we get a much different picture than what we’re seeing on absolute terms. Most of them never resolved higher like their absolute trends and simply remain messy, with prices stalling at the upper bounds of their basing patterns.
If we’re going to see sustained outperformance from energy stocks, we need to see them resolve higher relative to the broader market.
From the desk of Steven Strazza @Sstrazza and Grant Hawkridge @granthawkridge
Over the past few weeks we’ve seen a handful of major indexes, like small and mid-caps, resolve higher and kick off a fresh up leg. But breadth has really cooled off since then, as participation has been declining despite the major averages rallying.
This week, we’re finally seeing that weakness show up at the index level — particularly from SMIDs and cyclicals.
When we were reviewing our breadth charts, we noticed the deterioration in energy sector internals has been particularly bad. Not only is breadth not confirming the new highs from energy stocks… but there are actually some pretty ugly divergences in our new high indicators.
Energy stocks are currently vulnerable, sitting just above their breakout level at former resistance. Considering the lack of support from internals, this group is on failed breakout watch.
Let’s take a look under the hood and discuss what we’re seeing.
From the desk of Steve Strazza @Sstrazza and Ian Culley @Ianculley
On Tuesday night we held our November Monthly Conference Call, which Premium Members can access and re-watch here.
In this post, we’ll summarize it by highlighting five of the most important charts and/or themes we covered, along with commentary on each.
Let’s get right into it!
From the desk of Steven Strazza @Sstrazza and Ian Culley @IanCulley
TIPS versus Treasuries is one of the most important charts we’re watching right now, as it’s hitting its highest level since early 2013. Relative strength from TIPS hints that investors are positioning themselves for a sustained surge in inflation.
This makes sense given both the five- and 10-year breakeven inflation rates have reached their highest levels in more than a decade.
As investors react to signs of impending inflation, many cyclical stocks that benefit from higher rates are catching a bid. A great example of this is the Metals and Mining ETF $XME.
Let’s take a look! [Read more…]
From the desk of Willie Delwiche.
Key Takeaway: Bullish sentiment is on the rise. The bears may be reluctant to leave the party, but the bulls squarely outnumber their counterparts. The AAII survey shows bulls exceeding bears by two-to-one, and the II bull-bear spread is back within a high optimism zone. At the same time, options markets reveal that volatility and fear are being replaced by complacency. Though optimism has risen sharply during the past few weeks, current levels do not present risk. However, problems may arise when the lofty expectations associated with the sentiment backdrop are not met.
Sentiment Report Chart of the Week: Risk On Buffett Lacking Calories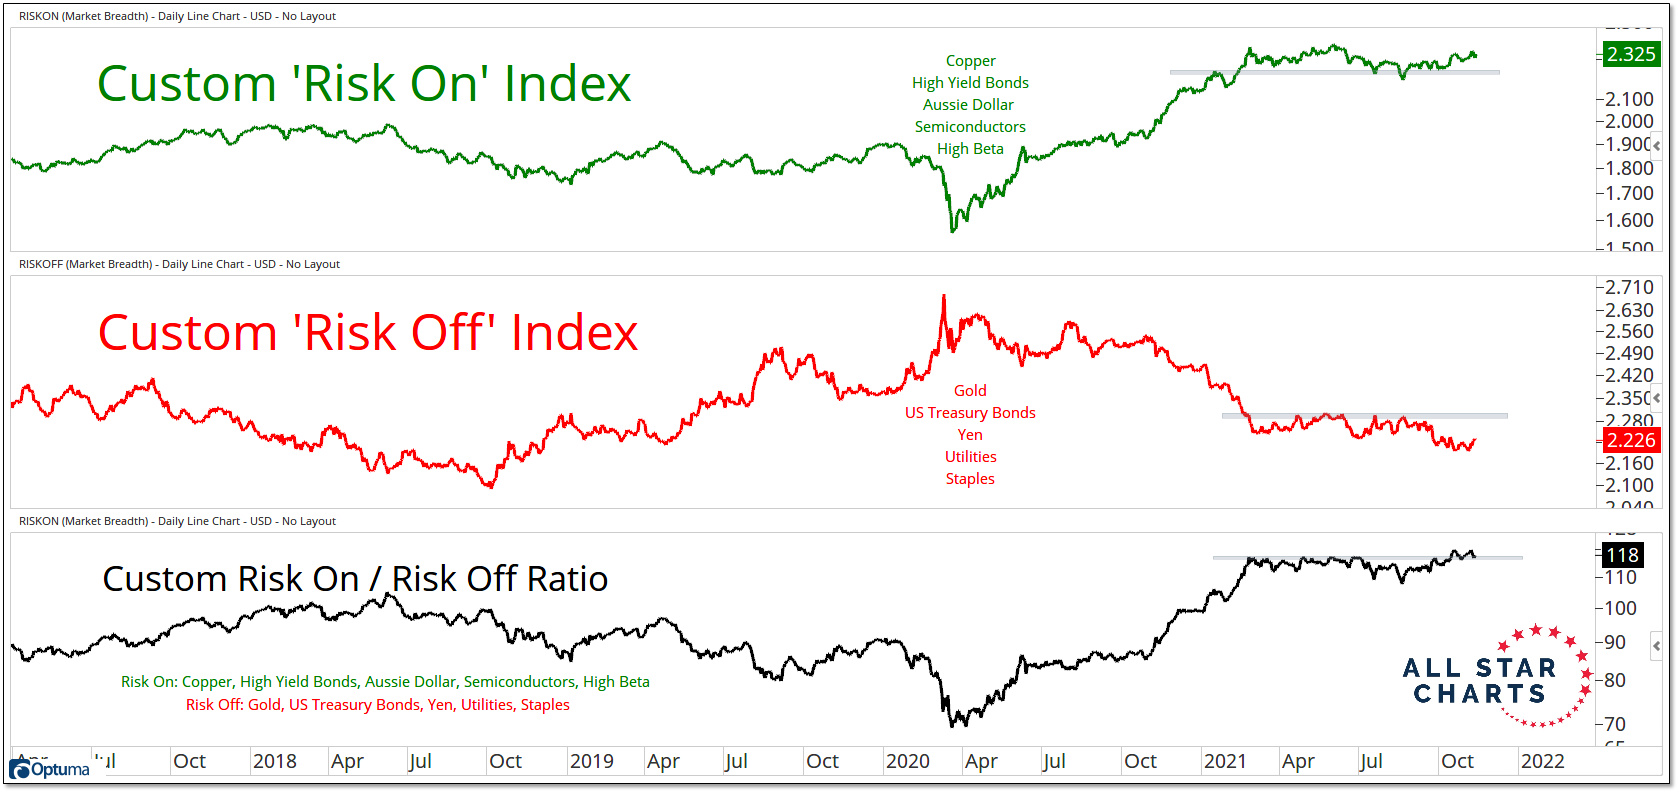
While risk appetite has returned (NASDAQ and CBOE equity options volume have turned sharply higher), this is not translating into clear strength from higher risk (e.g. risk on) parts of the market. To the extent that our risk on / risk off ratio has been moving higher, it has more to do with risk off weakness than because of risk on strength. Our pairwise comparison of higher risk and lower risk assets does not show a decisive tilt toward higher risk outperformance in recent months. Optimism that gets rewarded can fuel further strength, optimism that is frustrated can lead to regret.