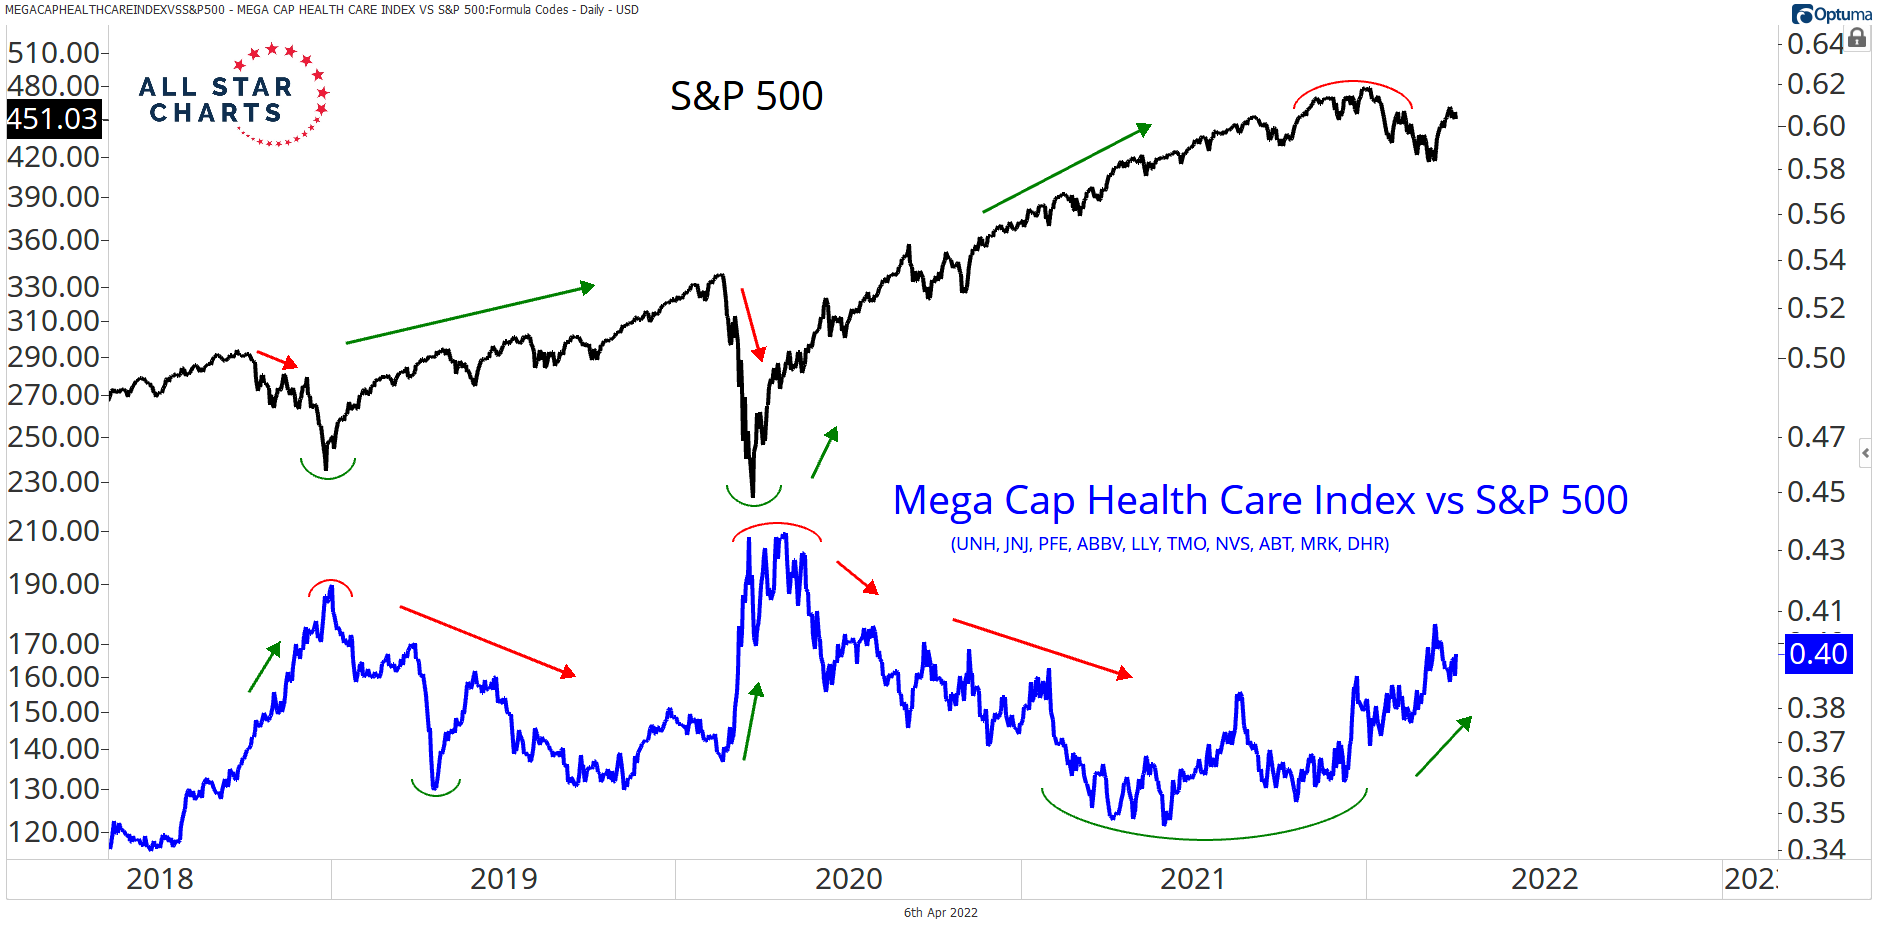
You see how large-cap healthcare does when stocks are under pressure?
Expert technical analysis of financial markets by JC Parets
You see how large-cap healthcare does when stocks are under pressure?
As sophisticated as public markets can be, they often have little quirks.
Everyone’s heard about the McRib indicator: The S&P 500 has a higher daily return when the McRib is available at McDonald’s than when it’s not available.
Or how about the magazine covers? That’s another classic anecdotal indicator.
Another one is the conference dip.
It’s said that when all the traders are out at conferences, the market dips.
The annual CMT Association Symposium was notorious for this. Later on, we saw this during the big SALT conference in Vegas.
The old thought was that if all the big players are at a conference, who’s left to buy?
It’s funny because now we’re seeing the dips during crypto conferences.
The talk of the town in the world of crypto is the recent Bitcoin conference taking place in Miami.
This just seems to be the latest iteration:
For this week’s trade, we’re selling an $XLI May 97/105 Strangle for approximately $2.85 net credit. This means we’re naked short both the 97 puts and the 105 calls.
Get the full details, risk management procedures and targets for this trade here:
From the desk of Steve Strazza @Sstrazza
When investing in the stock market, we always want to approach it as a market of stocks.
Regardless of the environment, there are always stocks showing leadership and trending higher.
We may have to look harder to identify them depending on current market conditions… but there are always stocks that are going up.
The same can be said for weak stocks. Regardless of the environment, there are always stocks that are going down, too.
We already have multiple scans focusing on stocks making all-time highs, such as Hall of Famers, Minor Leaguers, and the 2 to 100 Club. We filter these universes for stocks that are exhibiting the best momentum and relative strength characteristics.
Clearly, we spend a lot of time identifying and writing about leading stocks every week, via multiple reports.
Now, we’re also highlighting lagging stocks on a recurring basis.
Demystifying the world of cryptocurrencies can be a taunting task.
Even before you dive into the emerging world of defi, web 3.0, and NFTs, what seems like the relatively simple Bitcoin network has a hidden underworld of complexity and nuance.
Cryptocurrencies like Bitcoin and Ethereum can be bought without the necessity of a financial intermediary, like an exchange or crypto broker.
Instead, you can complete transactions on-chain, transferring capital and funds to individuals across the world utilizing the computing power of a peer-to-peer network.
These transactions, in turn, are validated and secured by miners, who dedicate computing power via solving complicated mathematical problems. Once solved, a hash is created.
The hash rate, in formal terms, is the number of hash operations done in a given period of time.
Less formally, the hash rate essentially measures the security and health of any proof-of-work cryptocurrency.
There’s no better way for those wanting a deeper dive than reading the 2008 Bitcoin white paper.
Volatility is not done with us yet. It ain’t going down without a fight! At the time I’m writing this, $VIX is +15% on the day and +31% since Monday’s close.
This has me back on the hunt for some premium selling opportunities.
And an ETF on our radar that checks the boxes of elevated premium, potential rangebound trading action, and a good fade opportunity is the $XLI Industrials ETF.
Check out this chart of $XLI: [Read more…]
This is the video recording of our April 5th Monthly Charts Live Strategy Session
From the desk of Steven Strazza @Sstrazza and Ian Culley @IanCulley
King dollar is sitting perched upon its throne. But the floor beneath it is beginning to crumble.
The rally in the US dollar index $DXY isn’t as strong as today’s fresh highs would suggest. In fact, when we dig beneath the surface, the dollar is only trending higher against a few currencies over shorter timeframes, while underperforming the vast majority.
Conveniently, the handful of currencies the USD continues to best are the most heavily weighted components of the US dollar index.
This lack of internal strength can be seen pretty much anywhere outside of the chart of DXY itself. Whether we’re looking at our USD trend summary table, our custom USD advance-decline line, or the individual crosses themselves, it all suggests the current trend in the dollar lacks support.
Let’s take a look.