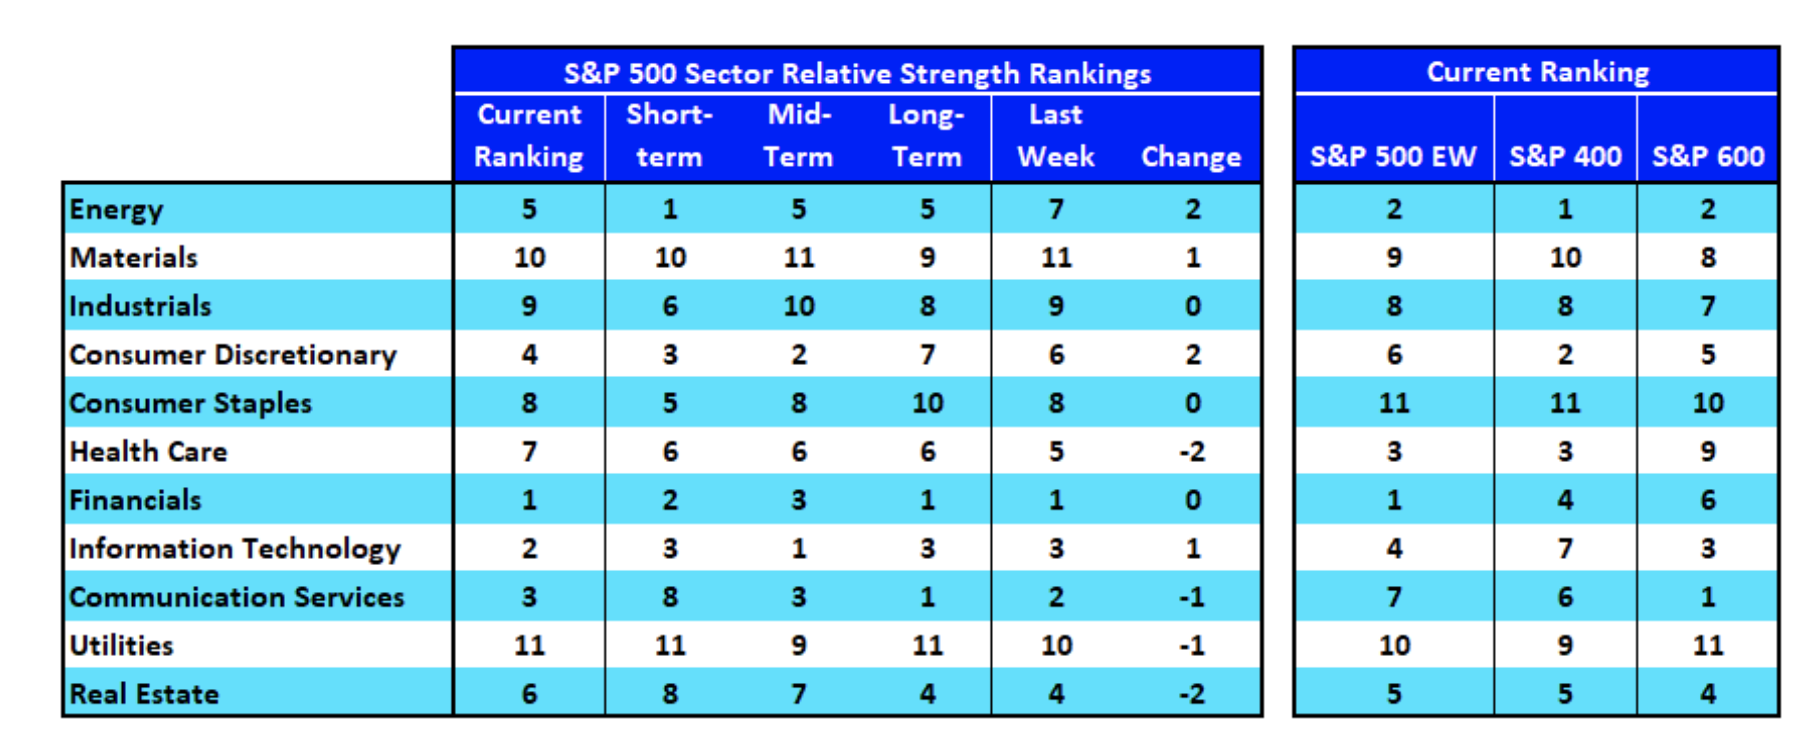
- Energy, which was near the bottom of the rankings from both a cap-weight and equal-weight basis as September began, has continued to gain strength. It has been the top performing sector on a short-term basis (as well as on a YTD basis) and has climbed into the middle of the overall rankings and is at number 2 on an equal-weight basis.
- Health Care and Real Estate have dropped in the rankings, though the industry group heat map shows there remain pockets of strength at the industry group level within the Health Care sector.
[PLUS] Weekly Top 10 Report
From the desk of Steve Strazza @Sstrazza
Our Top 10 report was just published. In this weekly note, we highlight 10 of the most important charts or themes we’re currently seeing in asset classes around the world.
Resolutions For Rates
This could be the single most important chart in the world right now. We cannot understate this development.
We finally got a major resolution in the US 10-year yield, reclaiming that critical 1.40% level this week. And this begs the question as to what a rising rate environment might mean for investor portfolios. The first thing we know for sure is that we want to stay away from bonds, unless we’re shorting them of course. The second, and perhaps most important implication, is the renewed tailwind for cyclicals. When rates are rising, sectors like financials, industrials, materials, and energy are all typically outperforming, which is exactly what we’ve started to see in the last week.
As for the broader market, perhaps this fresh breakout in yields is what was needed to kick off a new run-up for risk assets. What we’re watching for now is whether or not we finally start seeing similar resolutions in key charts such as Small-Caps, Financials, diversified international indexes, and even Oil.
While you could argue that yields are only one data point, it’s a very pivotal one. We can’t stress just how bullish a decisive breakout for yields would be.
[Options Premium] Weekly Jam Session w/ Sean McLaughlin
[PLUS] Weekly Observations & One Chart for the Weekend
From the desk of Willie Delwiche.
The story this week was bond yields and the mounting evidence that they are ready to move higher. 10-year yields in the US and Germany have climbed to their highest levels since July. The US 10-year T-Note yield has broken above 1.40% and could soon have 1.75% again in its sights. A 2-handle by the end of the year would not be surprising. Except for the May/June time period, German yields are the least negative they have been since crossing the zero threshold in mid-2019. These moves may reflect inflation expectations, but with the rise in the 2-year T-Note yield this week (highest level since March 2020) it is also the bond market taking seriously the possibility that the Fed will soon be joining the 30% of global central banks that have already begun to raise interest rates. For investors, this could be an opportunity to rotate back into cyclical sectors that do well in rising rate environments.
[PLUS] Weekly Town Hall w/ Willie Delwiche
This is the video recording of the September 23rd Weekly Town Hall w/ Willie Delwiche.
09/23/21 2PM ET [Read more…]
Breadth Thrusts & Bread Crusts: Confessions of a Fed-Watcher
From the desk of Willie Delwiche.
I’ll admit it. I’m a Fed-watcher from way back. I enjoy it as much as anyone, and probably more than most (especially those within the All Star Charts community).
While I never had to analyze the weekly money supply numbers to figure out what the Fed was doing, I’ve remained attentive as the Fed has revamped its mode of communication with the market time and again.
The latest iteration — a written statement and press conference after every FOMC meeting coupled with summary economic projections released four times a year — reflects the Fed’s desire for transparency. It also supports the belief that forward guidance is a powerful tool at a time when interest rates are stuck near zero.
Market participants listen, absorb the message and the forecasts, and react. We did this dance again this week.
Here’s the latest batch of forecasts from the Fed:
[PLUS] Weekly Sentiment Report
From the desk of Willie Delwiche.
Key Takeaway: Optimism has begun to cool as sentiment relieves the excesses of early summer. Yet, we are a far cry from a complete unwind that cyclical damage suggests is necessary. As investors become more risk-averse, we are looking for evidence that pessimism has become widespread and excessive (more II bears than bulls, NAAIM Exposure Index reading below 30, ETF outflows close to or below zero on a 4-week basis, and a daily close in the VIX greater than 30). Though there is certainly an increased level of caution and concern among market participants, we haven’t seen a degree of fear or pessimism in any of our indicators that point to the warranted rebalance. For now, risks remain elevated as sentiment swings toward pessimism.
Sentiment Report Chart of the Week: Risk Appetite In Retreat
My son is playing soccer right now, and one of the things I hear over and over from the coach during games are reminders to spread out and pay attention to positioning. The same is true in the market. When everyone gets bunched up in the same position, opportunities for success fade. Data through Q1 shows investors historically high levels of equity exposure. Q2 data will be out later this week and I expect the imbalance will have increased. This sort of excessive positioning can weigh on future equity market returns.
[Video] Options Trade of the Week w/ Sean & Strazza | Neutral Russel 2000 $IWM
On September 22nd, Sean and Strazza hopped on a Twitter Live Stream to discuss a recent trade idea for All Star Charts Options Members.
Here’s the play:
“I like an $IWM November 200/205/235/240 Iron Condor for an approximately $1.80 credit. This means I’ll be short the 205 puts and 235 calls, while protected by the 200 puts and the 240 calls. This is a defined risk trade where the most I can lose is the maximum possible value of the spread (distance between short and long strikes — $5.00) minus the credit we receive at initiation ($1.80) which equals $3.20.”
To learn more about the trade and the thinking behind it, click below to watch a replay of the Live Stream. [Read more…]
- « Previous Page
- 1
- …
- 51
- 52
- 53
- 54
- 55
- …
- 79
- Next Page »