I just finished my Commodities and Currencies review and updated all of them in the Chartbook. Today’s notes include updates on:
- Crude Oil
- Gold
- Silver
- Palladium
- Cotton
- Soybeans
- EUR/USD
- USD/JPY [Read more…]
Expert technical analysis of financial markets by JC Parets
I just finished my Commodities and Currencies review and updated all of them in the Chartbook. Today’s notes include updates on:
In honor of Superbowl 50, we created a countdown of what we consider to be the most important 50 charts in the world. These include U.S. Stocks and Sectors, International Indexes, Currencies, Commodities, Interest Rate Markets and Global Intermarket relationships. Some of these are more actionable than others, but collectively I think they truly tell the story of global market risk, or risk aversion for that matter.
Members of All Star Charts get access to all of this information 24/7, so we would like to invite you to start a 30-Day Risk Free Trial and Join us to see if our community is right for you. We have received incredible feedback from our members and will continue to improve the platform.
Discount Offer & Risk Free Trial: https://allstarcharts.com/superbowl/
Here is the video in full (audio begins immediately, video gets going after 30 seconds)…..Enjoy! [Read more…]
In this week’s members-only letter we discuss the following topics:
In this week’s members-only letter we discuss the following topics:
Dear Readers,
For the past few weeks I’ve been writing a weekly open letter to readers about what I’m seeing across the stock market, bond market, commodities and currencies. The feedback I’ve received has been unlike any other time in the 5 year history of All Star Charts. I want to thank all of you for that. I think this is something that I will have to continue to do and make it a regular part of my routine. I’ve done this sort of thing in the past while managing money in order to keep our investors up to date on how we want to approach the marketplace. The format you’re seeing here is no different. Please feel free to keep emailing me and contacting me via Stocktwits or Twitter on how it can improve and what sort of things you guys want me to talk about.
Starting with the U.S. Stock Market, this as a group continues to be in no-man’s land. When price is near a flat 200 day simple moving average, the market is suggesting that there is [Read more…]
November 18, 2015
Dear Readers,
We are just about 6 weeks away from finishing up 2015 and as usual there are a lot of questions left unanswered. Now is as good of a time as any to look back at how we got here so we can take a weight-of-the-evidence approach and put together a thesis of what we should expect going forward. At AllStarCharts, we prefer to incorporate a global top/down approach focusing our attention on various liquid asset classes with exposure both domestically and outside of the United States. With our long/short mentality, we look for opportunities to profit from both good and bad markets striving for absolute returns regardless of the economic environment.
Today we’ll start with the U.S. Stock Market which is relatively flat year-to-date. In large-caps, the S&P500 and Dow Jones Industrial Average have gone nowhere this year, while the leader has been the Nasdaq100 (up 10% YTD) and the laggard is obviously the Dow Jones Transportation Average (down over 10% YTD). With the tremendous amount of dislocation between Transports and the Tech-heavy Nasdaq, we’ll call that a wash and chalk this year up as flat, at least for now. The problem is, that the indexes don’t tell the whole story. Even before the August sell-off, the amount of stocks still making new highs was an embarrassment as only a small percentage of them were still rallying. The Consumer Discretionary space and the Dow Jones Internet Index were two standouts without much company. Looking at things today, and over the past few weeks, even fewer names are participating. The Nasdaq100 was the only index to make new highs this month as the rest rolled over putting in lower highs across the board.
The word “Distribution” really explains what is going on here in the U.S. Stock market. We can see a massive topping pattern forming in the S&P500 right at the 161.8% extension of the entire 2007-2009 decline. We don’t look at this as a coincidence. This distribution is also taking place at exactly the March 2000 highs for both the Nasdaq Composite and the Nasdaq100. Again, not something we consider to be a coincidence. The question we want to ask going forward is simple: with very few sectors and stocks in the market left participating to the upside, is this the tell before a much bigger sell-off, or will certain sectors take leadership and carry this market higher going forward? In the S&P500 alone, almost 70% of stocks have corrected over 10% and close to 40% of them have fallen over 20%. Will this “market of stocks” collectively stabilize, rotate leadership and head higher? I would argue that no, this is definitely the lower probability outcome and in all likelihood we are heading much lower. From a risk vs reward standpoint, this still very much favors the bears. My levels are 114.40 for $QQQ AND 2080 for the S&P500. We only want to be short these averages if prices are below them and neutral if we are above.
Within the U.S. stock market, since we have a negative bias, we want to focus our attention on the laggards. With the Dow Jones Transportation Average easily the worst of the bunch, I think Airlines are the ones we want to short. Looking specifically at the Amex Airlines Index, we are seeing the exact opposite of what we saw in March 2009. If you recall, while the market as a group was putting in lower lows in the first quarter of 2009, the Airlines held in showing the relative strength at the time to spark a 330% rally, which by far and away outperformed the S&P500 and other indexes. Today, it is the relative weakness that is standing out as this index has been making lower lows all year in an environment where the other indexes continued higher into the Summer. The uptrend line from the 2009 lows in the Amex Airlines Index has now been broken and over the past few weeks have successfully retested it and rolled over. Momentum is in a strong bearish range and prices are trending below a downward sloping 200 day moving average. Bad things tend to happen in this type of environment. We want to be aggressively short a basket of these airlines as long as prices remain below the broken uptrend line from the 2009 lows. I would be adding to shorts if we break the lows from this week. Also see the ETF $JETS.
Looking more globally, it is hard to ignore the underperformance out of the New York Stock Exchange Composite. Although considered a local exchange, half of the biggest 100 names in this cap-weighted composite are foreign companies. The relative weakness here is further evidence that the U.S. is still the leader compared with the majority of the international stocks markets. The emerging space is particularly weak as the S&P500 is sitting at or near 11-year highs relative to the MSCI Emerging Markets Index. In the more developed countries, the Japanese Nikkei has held in relatively well compared to the U.S., but is currently in no-man’s land at best. Whether looking at the Nikkei specifically, or the Hedged Japan ETF $DXJ, which we like to use, with prices trading near flat long-term smoothing mechanisms, this is a headache waiting to happen and we want to stay away from it. I would put Germany in a similar neutral category, but leaning on the bearish side on both as we are below broken support which is new overhead supply in the Nikkei and the DAX.
On the long side of the International markets, I think the potential for further mean reversion in Latin America is certainly there, but it’s the probability, or lack thereof, that annoys me. We are focused on the Latin America 40 Index ETF $ILF and specifically within that group, the MSCI Brazil Index ETF $EWZ. Coincidentally, it would take breakouts above $25 in each of these to get me bullish and long for that mean reversion towards 28. But that’s all I’m seeing there.
Crude Oil is likely to have an impact in this space. I’ve been in the camp that Oil has bottomed out, although tactically I see little reason to be long from current levels. I’d like to see more backing and filling to create a base large enough to get this one going. Looking at this from a more structural perspective, the high 30s-low 40s was where Crude Oil prices would peak throughout the 1980s and 90s. Once that range broke out to the upside after the turn of the century, we expect this to be an area where prices bottom out instead. So I think we’re close. We are watching Heating Oil and Unleaded Gasoline futures as the tell. If prices can get and hold above the lows from throughout 2015, which are awfully close, I think that Oil can bottom out. If we start to see new lows holding in these other energy commodities, I think we’re in a lot of trouble in Crude Oil and anything with a positive correlation to the commodity.
Where I would prefer to focus my attention instead within energy is Natural Gas. In September of 2009, Natural Gas bottomed out at $1.92 before rallying above $7 over the next few months. In April 2012 the bottom was $1.83 before rallying over the next 2 years above $7 again. Last month Natural Gas hit $1.94 before reversing higher. This is one we want to own for a 20% rally here back towards $3. This is a tactical trade where for risk management purposes, nimble traders can use 2.40 as the line in the sand. Contracts roll next week, so adjust accordingly ($2.55 in Jan Futures). According to the CFTC, Commercial Hedgers, who we consider “the smart money”, currently have one of their largest long positions of all time. Bigger picture, the Crude Oil:Natural Gas ratio continues to fall. This bubble peaked at over 50:1 in early 2012 and the mean reversion back to the single digits is running its course. Today the ratio sits around 18:1, from a high of over 50:1 with a long-term average near 10:1. Also remember that we are in a reversion beyond the mean business, and not just a reversion to the mean. So an overshoot into the single digits in the ratio is most likely.
Moving over to the precious metals space, it’s hard to find a more beautiful downtrend out there in the world. With prices hitting new 5-year lows this week, sentiment is nowhere near as pessimistic as it has been at prior temporary lows in 2013 and 2014. I think this bullish (less bearish) outlook from the public will be the catalyst to take Gold under $1000 and Silver under $12. The risk/reward today is not as clean as it once was a few weeks back, but the trend here is lower and we want to continue to fade any strength in metals.
The U.S. Dollar should have an impact in this group as it has consolidated its gains from the past few years in one of the healthiest consolidations across the global marketplace. Back in March, we saw the most bullish sentiment towards the Dollar in history. The Commercial Hedgers were selling this thing like if it was going to zero. Anecdotally, the financial media who has never cared what I thought about the U.S. Dollar could not finish a phone call or email with me without asking my thoughts on the Dollar. Since then, however, the sentiment has dissipated and the hedgers have covered a lot of their bearish positions. It’s hard not to like the Dollar here. I think it continues to head higher after the recent breakout. This should have negative implications towards the Euro, which represents close to 60% of the U.S. Dollar Index. I would expect the Euro to continue to fall along with precious metals as we head into the first quarter of next year.
Next we turn to the Bond market. The collective waste of time of arguing about fed hikes or not continues to dominate the airwaves and interwebs. We try and ignore what the Fed has to say as much as we can and even more so Wall Street Economists. There is no group on planet earth that has been more wrong about anything as Wall Street Economists have been about the Fed. We prefer instead to focus on price, which at the end of the day is the only thing that will pay us. First of all, we are talking about a 35 year bear market for rates. Things don’t just turn on a dime. So to blindly short the bond market because “rates can’t go any lower” makes zero sense to us. Now, the short end of the curve and the long end are two different things. The 2-year US Treasury bond yield is highs this week not seen since 2010, but the 30-year yield hit fresh lows earlier this year and has not shown any signs of a major bottom. This dislocation has caused the yield curve to narrow. Note that an inversion of the yield curve (short-term rates exceeding long-term rates) is a heads up of a pending economic recession.
Since we don’t have time to sit around waiting for yield curve inversions, we prefer to focus on the here and now. Looking at the 10-year yield, widely considered the benchmark for U.S. Interest Rates, it’s the 2.4% level that stands out the most. This was the low in rates in 2010 and also twin highs in late 2011 and early 2012. We kissed that this month and quickly rolled over. Going forward, this is our line in the sand. As long as the 10-year is below 2.4%, we want to be buying U.S. Treasury Bonds very aggressively, particularly the 30-year Futures $ZB_F. Equity traders can turn to the iShares 20+ Year Treasury Bond ETF $TLT or $TLT options for non-futures exposure. We are not expecting any rate hikes in 2016 and regardless of any rumors, we want to be buying bonds here.
That’s it for now. Please feel free to write with any questions or comments that you may have.
JC
***
Note: In next week’s letter we will spend time looking at Biotechnology, Palladium, Agricultural commodities and equities and some individual U.S. stocks like Apple, Amazon and Netflix on both the long and the short side.
Tags: $SPY $QQQ $UNG $USO $CL_F $NG_F $GC_F $GLD $SI_F $SLV $UUP $DX_F $EURUSD $FXE $TNX $TLT $ZB_F $HO_F $RB_F $EWG $DAX $NIKK $DXJ $USDJPY $6J_F $FXY $ILF $EWZ $XAL $JETS
Over the past few months I’ve been focusing a lot of my attention on the Japanese Yen. As an American investor who trades U.S. stocks (among other asset classes), I think it would be irresponsible of me to ignore a currency with such a high negative correlation with the S&P500. I’ve been pounding the table lately about how obnoxiously high the negative correlation currently is between Yen and U.S. stocks and I still think it’s extremely important that we pay attention.
This is, in my opinion, is the most important chart in the world if you have any exposure at all to U.S. stocks. We’re looking at a weekly candlestick chart of Japanese Yen Futures going back a decade. What had served as support over the past 12 years, particularly at the 2007 lows (U.S. stock market top), briefly broke down earlier this year, only to quickly recover. The old saying is that, “From Failed Moves Come Fast Moves In The Opposite Direction”. I therefore think this is a prime candidate for an epic rally:
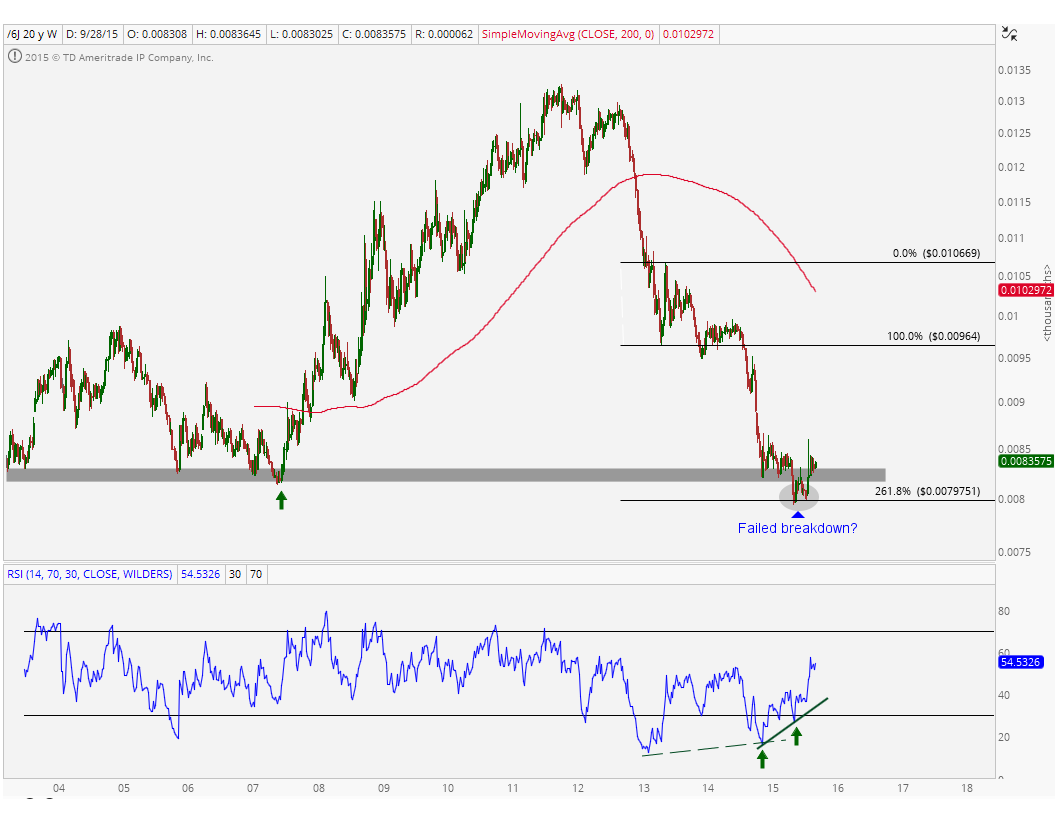
Only price pays, I cannot emphasize that enough. But in addition to price action, we have some indicators that we like to use strictly as a supplement. These indicators are to either add or decrease conviction. First of all, we are close to 20% away from a 200 week moving average, which is very stretched. This alone is not a reason to buy Yen, or anything else for that matter, but it does indicate to us that if we do get a snap back, it’s got a long way to go to mean revert. This simply puts the risk vs reward proposition in favor of the bulls.
In addition, if we take a look at momentum, the 14-week Relative Strength Index (RSI) put in a higher low at the end of 2014 and one more higher low this June as prices made their ultimate lows. With multiple bullish momentum divergences, it gives us more conviction on our bullish Yen thesis.
Finally, this is not just some random level where prices could potentially be bottoming out. The lows in June came right near the 261.8% Fibonacci extension of the 2013 consolidation, which was the most recent counter-trend rally within this multi-year downtrend.
From an execution perspective, I think a breakout above this month-long consolidation would confirm our thesis above. Below we are looking at a symmetrical triangle well-defined by two converging trendlines. A break above the upper of the two should do it and we only want to be long if prices are above that downtrend line. To me, that’s the cleanest way to take advantage of this. Although one can argue anticipating that breakout, I guess I’m personally just more conservative. I will say that there is no reason to be long Yen if prices are below that gray shaded area going back to support over the past year.
I think there could be a lot of upside here in Yen. I would keep a very close eye on this chart, whether trading futures, currencies, or even if you’re just in U.S. stocks, considering how they trade inverse to one another.
This is an important one guys….
Related Posts:
Why Yen Is The Most Important Chart For U.S. Stocks
***
Click Here to receive weekly updates on these charts as well as multi-timeframe analysis for the rest of the major currencies and 16 commodities futures contracts.

I’m glad that Summer is over. Fall is without a doubt my favorite time of the year. It’s football season, the weather isn’t too hot, it isn’t too cold, it’s college football season, everyone is back to work after being lazy for the summer so it’s easier to conduct business, global stock markets enter their most volatile period of the year and Baseball playoffs start soon. These are all good things as far as I’m concerned.
Let’s start with stocks. I like how U.S. stocks finally started to sell-off at the end of the summer to follow along with what emerging markets and some of the other developed nations like Europe had been telling us since the Spring. The U.S. was literally the last man standing. OK and maybe Japan as the Yen got destroyed, but that’s about it. Emerging markets had been getting crushed for a long time and many that I heard/read chose to ignore it describing the U.S. strength as T.I.N.A (There Is No Alternative), which is the dumbest thing I’ve ever heard.
I’ve been really vocal since March that there has been no reason to long the U.S. Stock Market Averages as there was literally no trend and the prudent thing to do was to wait for a resolution out of the consolidation. I’m on the Benzinga Morning Radio on Thursday mornings saying the same thing every week. If you’ve been listening, you know. More recently on the blog, I’ve been really vocal about how this resolution out of the sideways range was to the downside and therefore all of that former support since earlier this year now becomes overhead supply. It should not be a surprise to anyone that stocks rolled over last week near that supply.
The negative correlation right now between U.S. Stocks and Japanese Yen is off the charts. You want to know where S&Ps are headed? I think you watch the Yen. This has been by far and away the biggest tell of them all. I don’t hear anyone else talking about this except for maybe my buddy Jonathan Krinsky over at MKM Partners. I’m not surprised at all that he also picked up on this because over many years him and I have seen eye to eye more often than not. Well done my man. But again, not shocked at all that you caught that.
In the Bond market, shocker they didn’t raise rates last week. Understand something, the media is in the business of making money by selling ads and increasing page views. Members of the media are not in the business of making money in the market. What they claim is a big deal does not necessarily mean it’s a big deal if you’re in the business of making money in the market. These are two completely different business models. “Markets in crisis” are headlines we’re seeing while the S&P500 is single digit percentage points from all-time highs. Really? Crisis?
If S&Ps correct 25% from their highs this Summer, it would be perfectly normal. After a 220% rally in 6 years, you give back 25%? Does that seem so crazy? I don’t think that constitutes a crisis at all. Seems pretty normal, if you ask me.
Getting back to currencies, how about that U.S. Dollar Index? Has this sentiment unwind since March not been one of the coolest thing you ever seen? I love it so much. We were at bullish sentiment extremes that we had never seen before. Ever. Commercial Hedgers, who we consider the smart money, were hedging so many U.S. Dollars it was like they thought it was going to zero. The U.S. Dollar Index ran up to exactly the 161.8% Fibonacci extension of the so important 2009-2011 decline, which looking shorter-term also happened to be 261.8% Fibonacci extension of the January/February Consolidation. And then miraculously just reversed and got destroyed when everyone (even my grandmother) thought U.S. Dollars would keep going higher.
Speaking of obnoxiously bullish sentiment…..how nice was it to see Healthcare get crushed the last couple of months. It’s hard, if not impossible, to find a time where there were so many bulls in one sector. That failed breakout was text book. It sucked in the last bears that just threw in the towel, and down we went. It was perfect (see here).
But enough about the past….
Funny, technical analysis gets hated on by some people out there because it only looks at information from the past. This one gets me every time. I could only dream of having information from the future. Could you imagine that? It would be great! Sign me up for that one. If you have someone out there selling data from the future, please refer them to me so I can get me some of that. For us earthlings, unfortunately, we’re stuck with only information that is from the past. Fundamental analysts, economists, quant guys, we’re all forced to look at information from the past. It’s all we got.
I hate to be a broken record, but I’m a ‘sell strength’ guy in stocks, particularly U.S. Stocks. There is just way too much over head supply out there for me to want to be aggressive. I would rather be taking advantage of strength to look for shorts, than looking for sell-offs to get long. This is the case in all of the major averages and I’d say 85% of sectors, maybe more.
Globally, I have to say the same. A mean reversion can certainly be more powerful than here in the states simply because the sell-offs have been that much more dramatic, but the strategy is the same. Sell strength, not buy dips. Emerging markets are a disaster. Look at South Africa, this one looks to be one of the more vulnerable markets out there.
Time horizons guys. This is something that HAS to be defined. We’re all different. Are you a day trader? Are you a long-term investor? How far out are you looking? Me personally, I look out weeks and months, not hours and days. So when I say sell strength, I don’t mean like Tuesday morning and cover in the afternoon. I mean in general looking out weeks and month. But we’re all different and this needs to be defined before entering the first trade.
What can change my mind?
First of all, time. I think some consolidation sideways near the upper end of the range since late August would be healthy. Another month or so up here without giving back the gains and making new lows would be a positive in my book. Also the USD/JPY getting above 122 and staying up there. The correlations, as I’ve mentioned are through the roof. If Yen starts to roll over, I think that would help put a bid in stocks. Other than that, I’m not seeing much out there to get me enthusiastic about getting aggressively long stocks, at least for not more than a few days.
Bonds are a tough trade. Looking at the infamous $TLT, prices are just above a flat 200 week moving average and just below a flat 200 day moving average. This has “headache” written all over it. You can trade the small range if you want, but bigger picture, I think the dominant trend is a lack of trend.
What do I like?
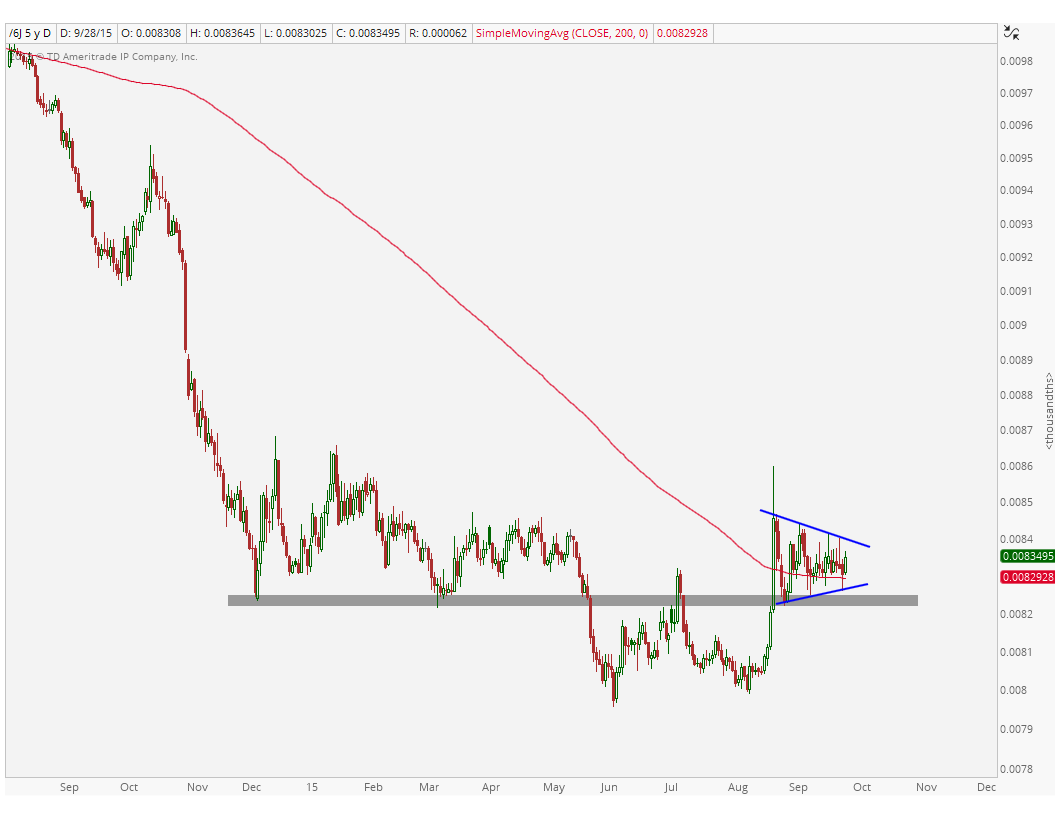
I like Yen. Look at Yen Futures $6J_F. We have bullish momentum divergences on multiple timeframes, both daily and weekly charts. Prices have been consolidating in what appears to be a continuation pattern, kind of like a bullish pennant if you want to give it a name. More importantly, it’s the implications of this consolidation over the past month that I’m most interested in. If the resolution of this pattern is to the upside, we want to be buying that aggressively.
I like cash. I think we’re going to have incredible opportunities over the next few months. Holding on to stuff you’re “stuck” in and hoping for the best is not a strategy. I’ve received a lot of phone calls and emails from people in this situation: They never sold, let’s say $XOM for example, at the highs and now are underwater hoping for it to come back. My answer to this dilemma is very simple: Ask yourself, “If you had all of this money sitting in cash, is this what you would do with it, buy $XOM?” – are you trying to make your money back? Or are you trying to make your money back with $XOM?. I’ve actually heard the phrase, “Well these are just paper losses, I haven’t taken the loss yet”. No actually, yes these are losses. That money is gone. It’s what you do going forward that matters.
Closing Prices! You want to talk about Dow Theory? Whenever we hear Dow Theory, it usually revolves around the tenet about the Dow Industrials and the Dow Transports confirming or not confirming one another. This is a Dow Theory tenet, but I’d argue not even one of the most important ones. I think the tenet about how closing prices are what matter most is arguably the Dow Theory tenet we should always remember. Charlie Dow was writing about this 130 years ago and is still right today. Remember all the S&P cheerleaders last Thursday? They were quiet at the close of the day, which is what matters most. Closing prices guys.
Anyway, these are some of the things on my mind. I think it’s therapeutic to put it down on paper. I hope you guys find some value in it and helps spark some conversations.
What are you thinking about these days as we enter the 4th quarter?
***
Click Here for more information on our weekly research reports. If you are interested in U.S. Sectors, Commodities, Currencies, Global Markets, etc. find the right package for you. Also feel free to email info@allstarcharts.com if you have any questions.
Tags: $XOM $USDJPY $6J_F $FXY $SPY $TLT $ZB_F $TNX