In this week’s members-only letter we discuss the following topics:
- Why Are Biotechs and Regional Banks Now On Our Radar?
- Why Did Everyone Miss This Monster Rally The Past 6 Weeks?
- Which Stock Market Indexes In the U.S. Will Perform Best This Month?
- How High Can U.S. Interest Rates Go and How Will That Affect Bonds?
- Our Upside Price Targets In Apple, Now Updated
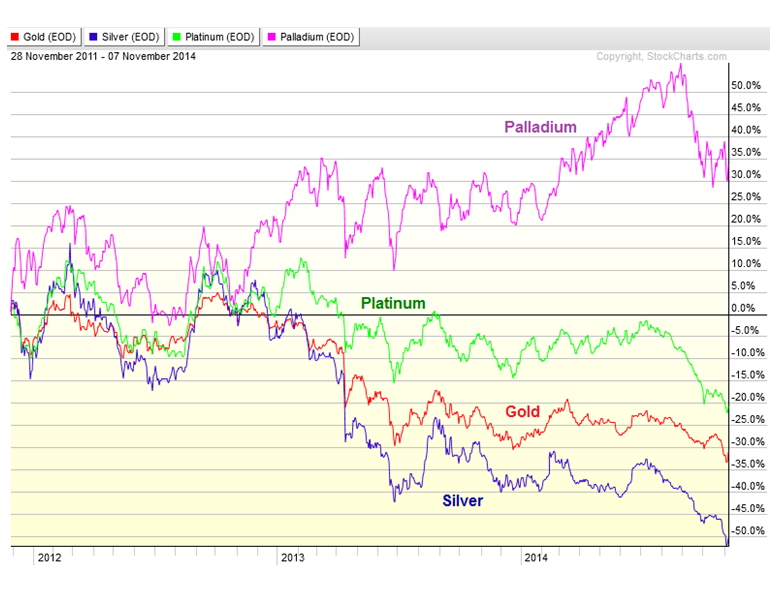
- What Is The Most Important Thing To Watch In The Gold Market?
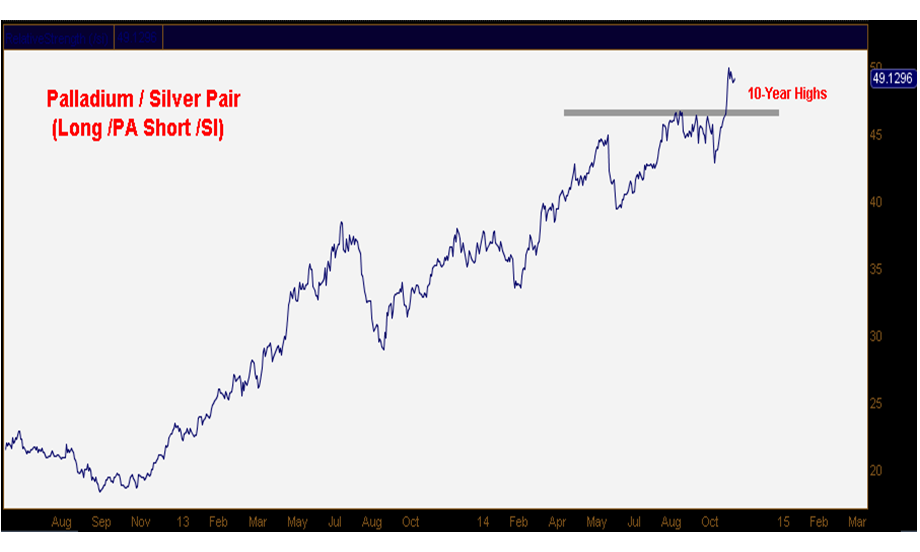
- What Else Should We Be Watching In Precious Metals?
- Our Favorite Trade To Profit From A Weakening U.S. Dollar