From the desk of Tom Bruni @BruniCharting
My tweet this morning got some traction, so I figured I’d think out loud and give you some things to think about over the weekend.
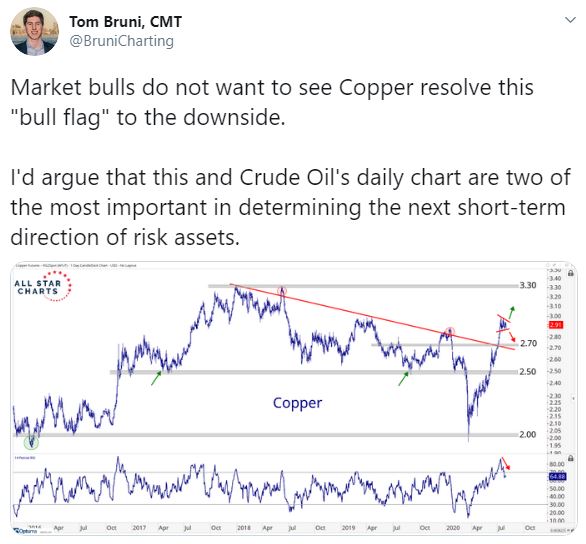
Expert technical analysis of financial markets by JC Parets
From the desk of Tom Bruni @BruniCharting
My tweet this morning got some traction, so I figured I’d think out loud and give you some things to think about over the weekend.
This is Part 2 of my Happy Hour with Brian Shannon and Joe Fahmy. I learn something new from these guys every time we chat.
In this video we discuss the importance of Risk Management and why paying attention to our own emotions and behavior patterns is so critical.
Make sure to also check out Part 1 of this Episode.
One of our favorite ways of looking at a sector or industry group is by using equally-weighted charts.
A lot of “Home TV” stocks have been on the move, so we’re going to take a look at what’s happening and determine what’s next for the group.
From the desk of Tom Bruni @BruniCharting
If you ask people what it would take for Small-Caps to begin outperforming you’ll get a variety of answers. We need Financials to outperform. We need a weak US Dollar. We need a steeper yield curve. We need the moon to be in a waxing crescent. We need a miracle.
You’ll have a lot of answers and a whole lot more confusion.
So in this post, we want to keep it simple and identify the two charts we’re using to identify a sustainable turn in Small-Cap relative performance.
From the desk of Steve Strazza @Sstrazza
Every week we publish performance tables for a variety of different asset classes and categories along with commentary on each.
Looking at the past helps put the future into context. In this post, we review the relative strength trends at play and give our outlook and some of the things we’re watching for in the week ahead.
This week we’re going to highlight our International ETF and Global Index tables, and focus on some of the rotation we’re seeing into more offensive assets across the board. Let’s dive into it.
Banks are the most important sector of the market so their performance, or lack thereof, gets our attention.
This week we’re seeing some interesting headlines about industry heavyweights HDFC Bank and ICICI Bank.
Let’s take a look at what’s happening.
We continue to focus on stocks that are showing relative strength and absolute price momentum. This week we’re looking sticking with a sector that continues to work, Pharma.
Last week we retired our “Five Bull Market Barometers” to make room for a new weekly post that’s focused on the three most important charts for the week ahead.
This is our first edition, so let’s jump right into it.