With volatility on the rise and increased evidence of fissures beneath the surface of the market, we have reduced equity exposure in our Tactical Opportunity portfolio. The deterioration at this point has not been significant enough to warrant reducing equity exposure in our Cyclical portfolio, though we have made some changes there as well to stay in harmony with the relative leadership trends we are seeing both in the US and globally.
[PLUS] Weekly Market Notes & Breadth Trends
From the desk of Willie Delwiche.

- Financials sector has continued to slip in our relative strength rankings, falling to its lowest level in over a year and dropping out of the leadership group.
- Consumer Staples remain toward the bottom of the overall rankings, but have been the top-ranked sector on a short-term basis and we are seeing evidence of improving trends at the industry group level across market capitalization levels.
- Large-cap health care is rising in the rankings, but this strength is not echoed at the mid-cap or small-cap level (or even on an equal-weight basis at the large-cap level)
[PLUS] Weekly Top 10 Report
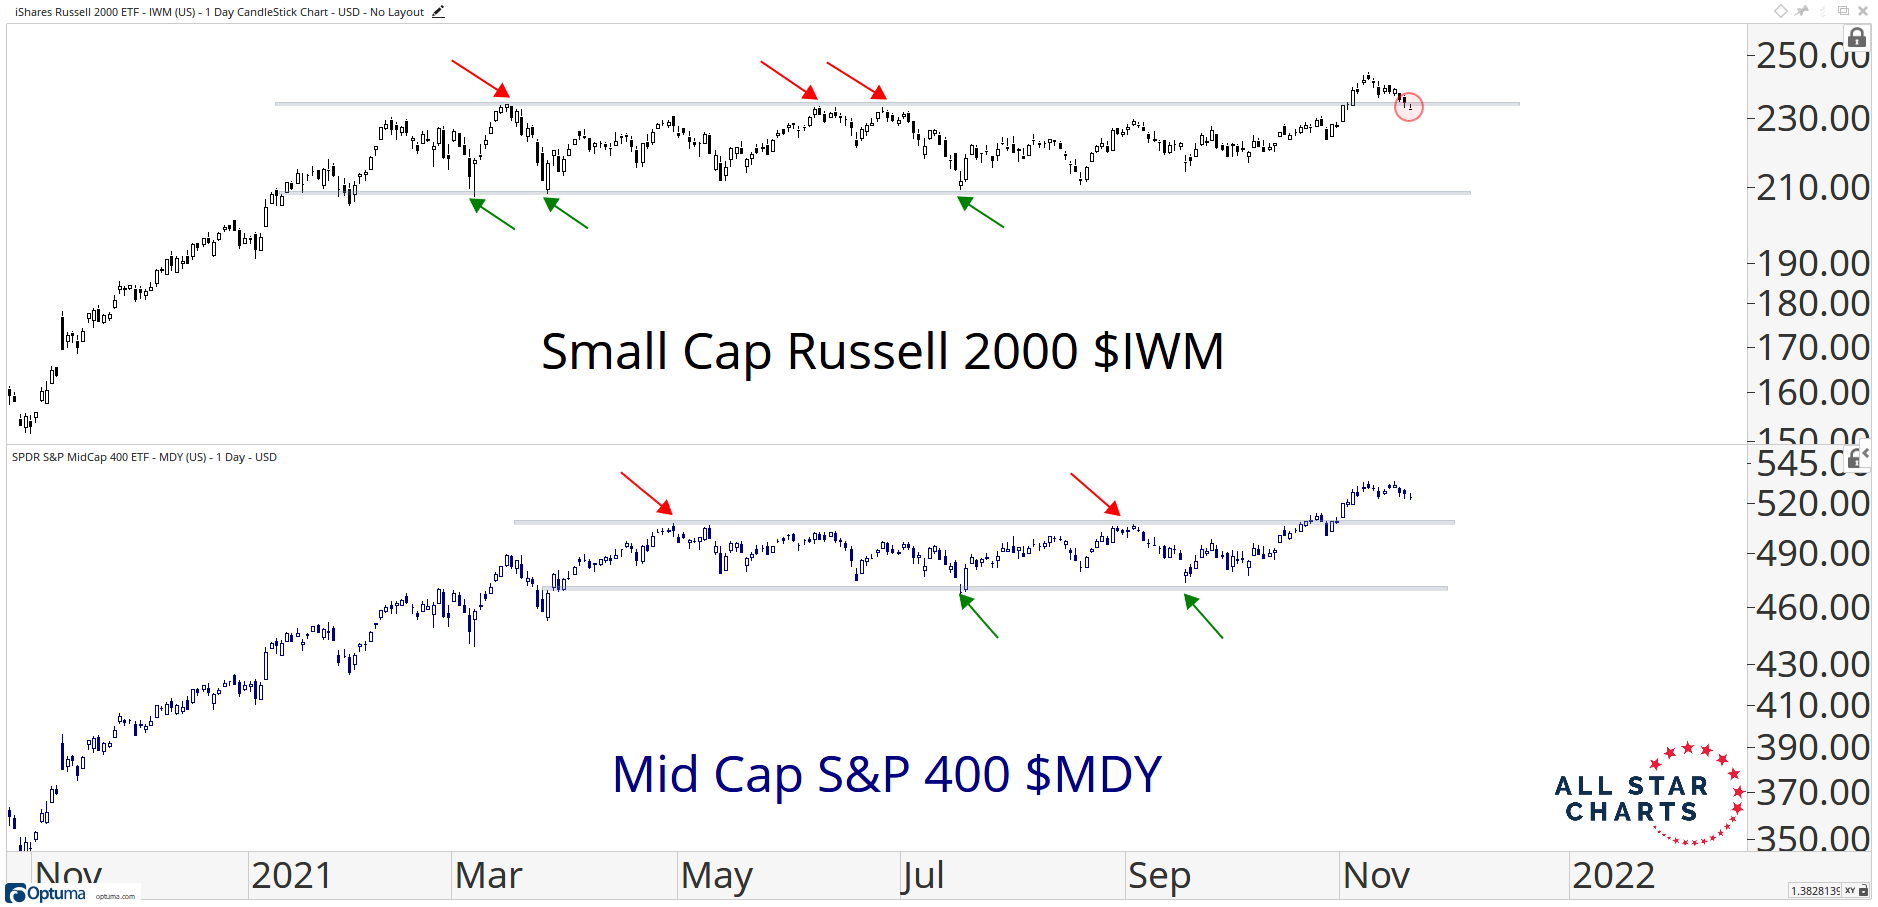
From the desk of Steve Strazza @Sstrazza
Our Top 10 Charts Report was just published.
In this weekly note, we highlight 10 of the most important charts or themes we’re currently seeing in asset classes around the world.
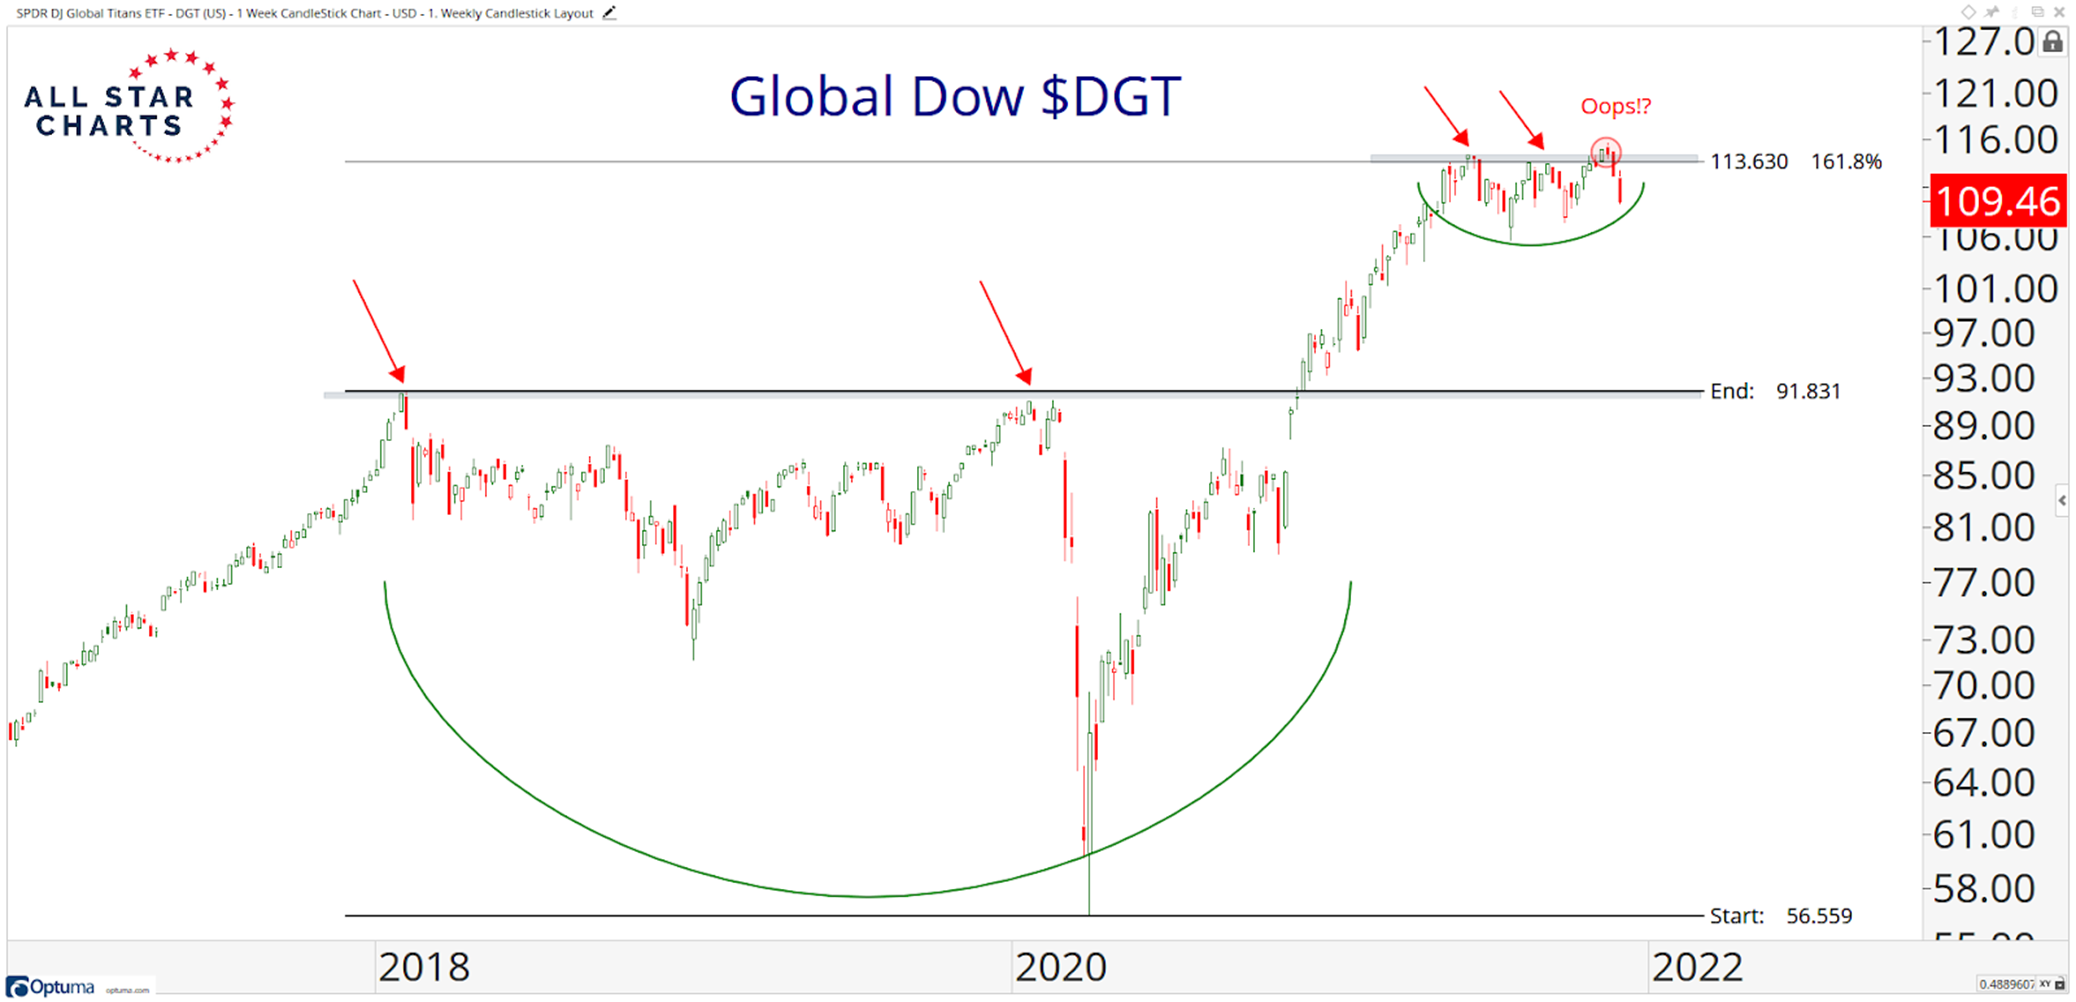
Messy For Longer
Many of the strongest areas for global equity markets are failing to hold their breakouts, or simply reversing at logical levels of overhead supply. The Global Dow is a pretty well-rounded representation of the world stock market. As you can see in the chart, buyers couldn’t get it done for the third time this year. Sellers are back in control for now, and with prices back in their former range, there is no directional edge over the near term. Our bias is neutral, and we’re expecting further sideways action. If and when prices reclaim those year-to-date highs, we want to be long. This is simply the case for most stocks right now.
[PLUS] Weekly Momentum Report & Takeaways
From the desk of Steve Strazza @Sstrazza
Check out this week’s Momentum Report, our weekly summation of all the major indexes at a Macro, International, Sector, and Industry Group level.
By analyzing the short-term data in these reports, we get a more tactical view of the current state of markets. This information then helps us put near-term developments into the big picture context and provides insights regarding the structural trends at play.
Let’s jump right into it with some of the major takeaways from this week’s report:
* ASC Plus Members can access the Momentum Report by clicking the link at the bottom of this post.
[PLUS] Weekly Sentiment Report
From the desk of Willie Delwiche.
Key Takeaway: A healthy level of optimism ushers investors into the holiday season. But lofty expectations are neither reflected in price nor supported by breadth. Participation is struggling to expand beneath the surface and cyclical areas of the market are retesting critical levels of support. A narrow rally running on empty leaves the market vulnerable to disappointment and could challenge high spirits. The question becomes how patient will investors be, especially since consumer sentiment is in the dumps. If the fish aren’t biting, some may prefer to cut bait.
Sentiment Report Chart of the Week: Consumers Are Cranky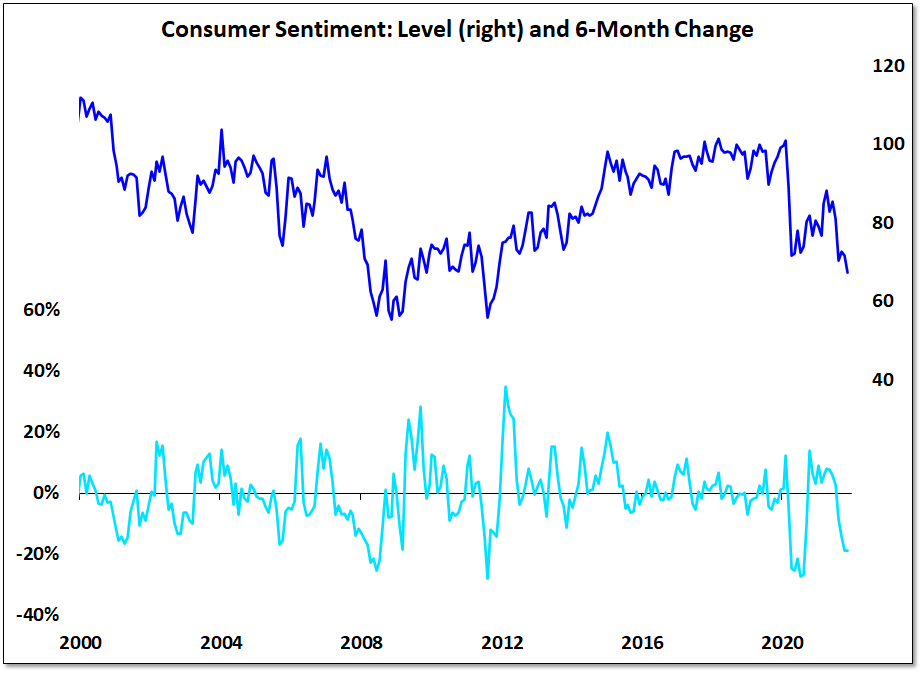
The latest data from the University of Michigan shows consumers are in a pretty bad mood. The Consumer Sentiment Index for November is at its lowest level in a decade. While the expansion in the number of stocks hitting new lows probably doesn’t help, this seems to reflect political divisions and partisan divides more than than an actual economic or market reality. Too often we let the headlines and news stories from afar sway our moods rather than being thankful for and acting on the actual opportunities that are before us on a daily basis.
[PLUS] Weekly Market Perspectives – Rising Rates A Risk When Indexes Lack Broad Support
Key Takeaways:
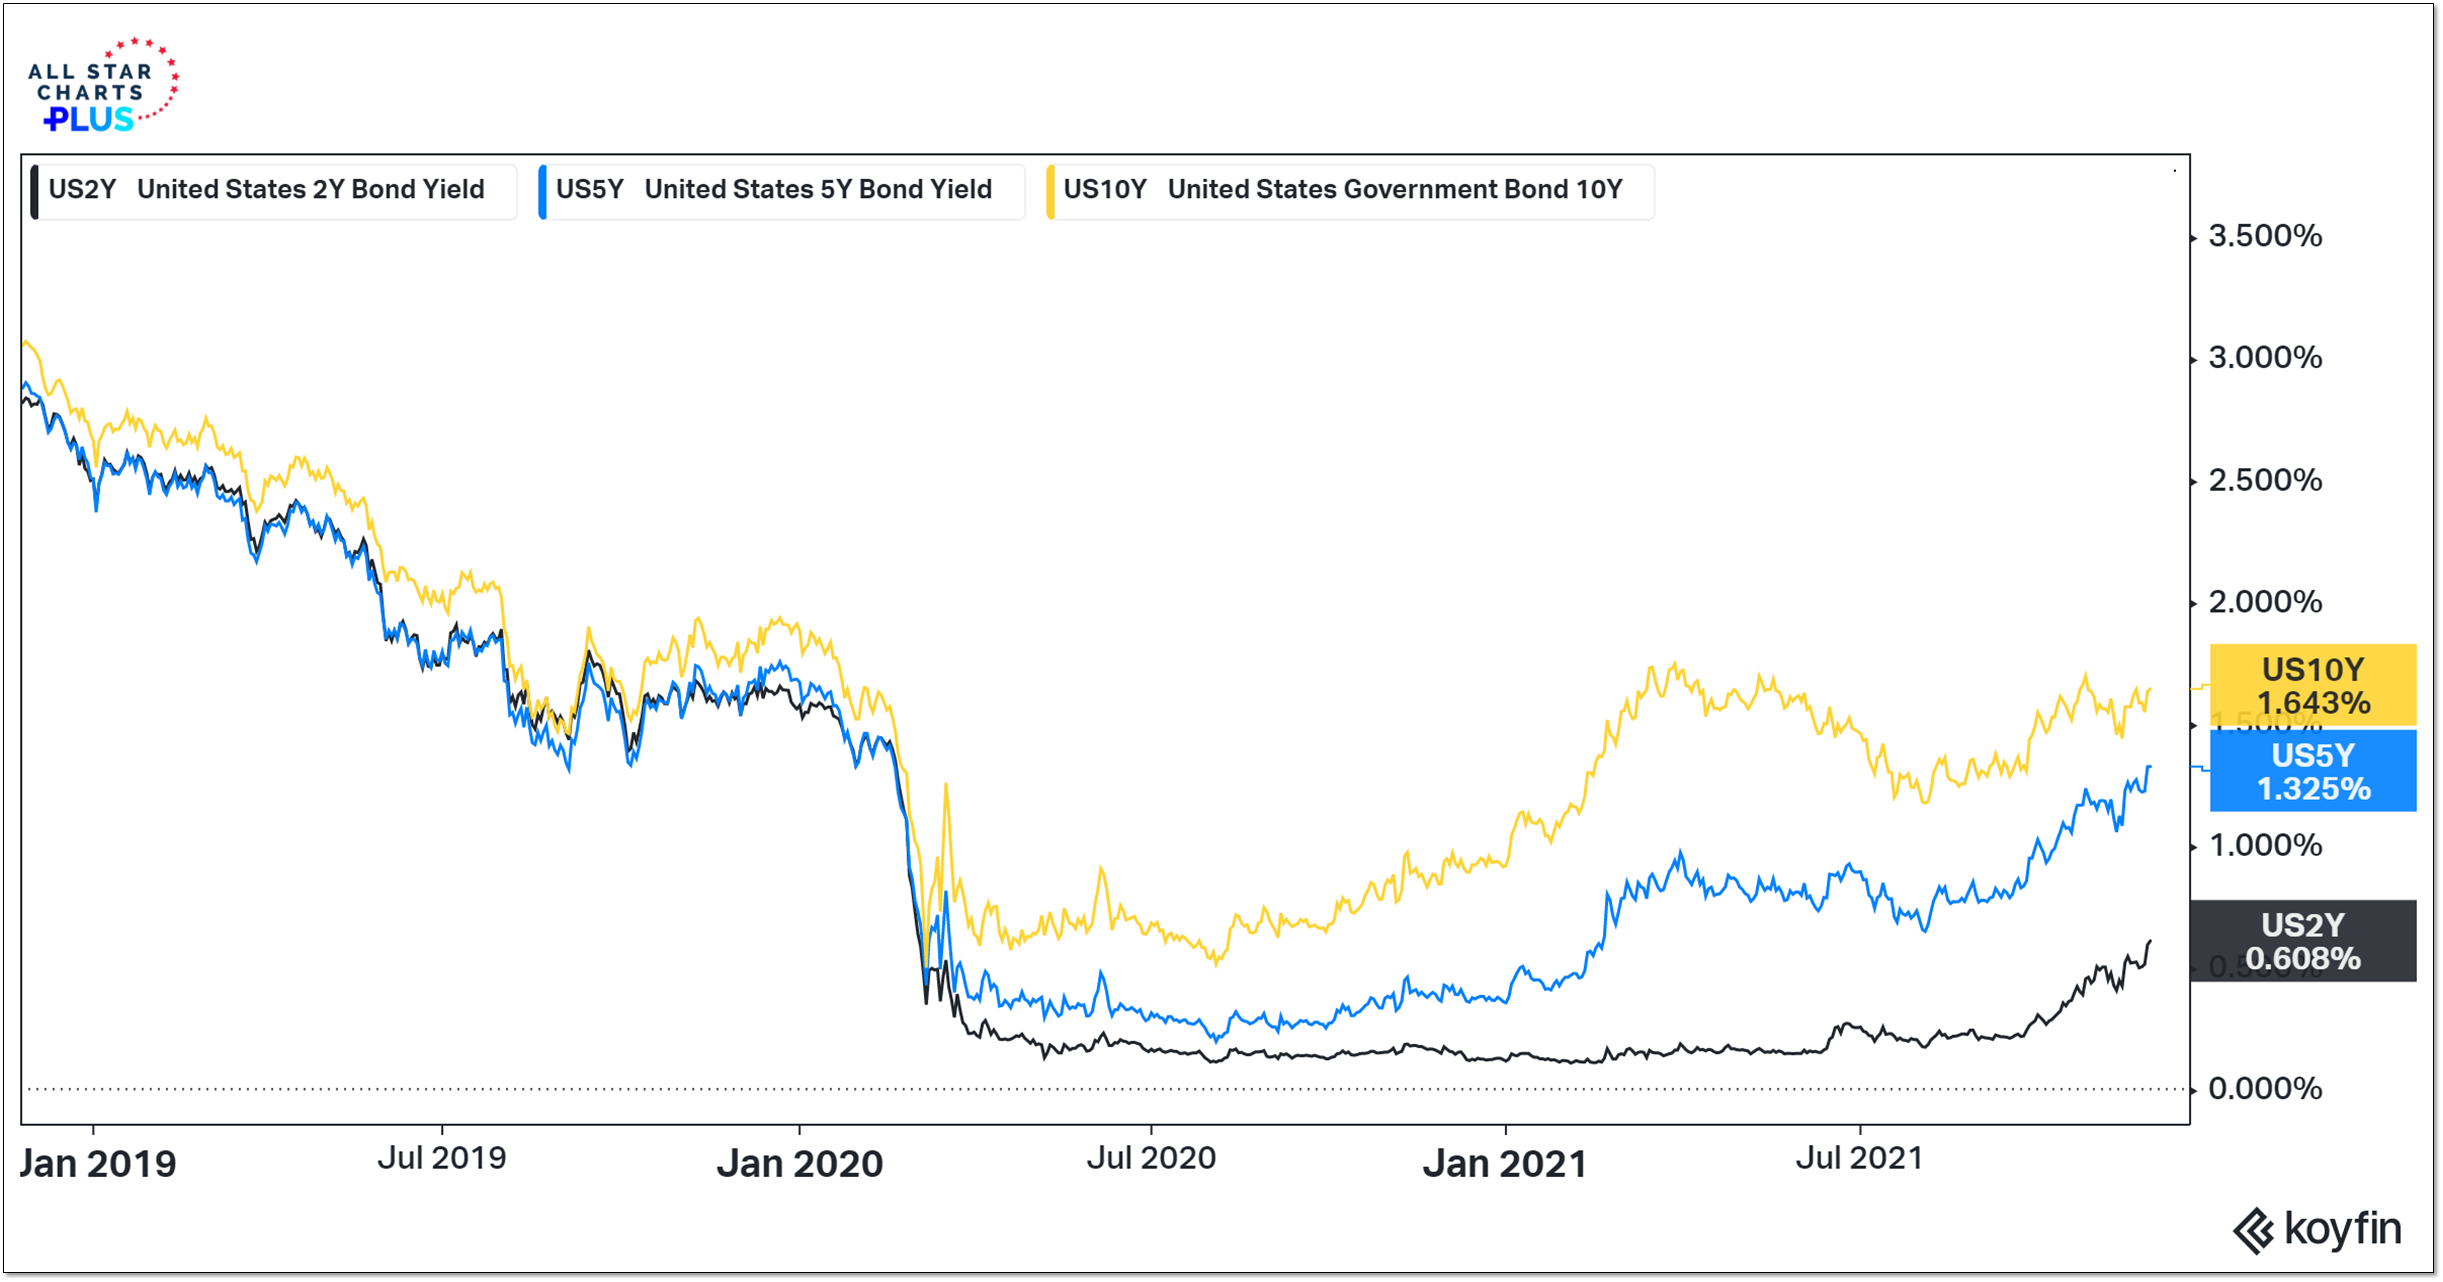
- Bond yields rising as pressure mounts for Fed to raise rates
- From hints of new highs to expansion in new lows, the broad market is being tested.
- Commodities, currencies & bonds struggle with risk on message
With schedules of all sorts thrown off by travel and the Thanksgiving holiday (no Townhall conversation this week), this seems like a good chance to review a handful of charts that I’ll be keeping an eye on as we move toward year-end and into 2022.
The 10-year T-Note yield continues to move between its March high (near 1.75) and its August low (below 1.20%). Yields on 2-year and 5-year Treasuries have climbed to new recovery highs as the market has priced in Fed tightening. Given the inflation outlook, much of the debate is on why bond yields are still so low. Take a look at a chart of a global bellwether like Caterpillar (CAT) and the question might become, why are bond yields so high.
[PLUS] Weekly Market Notes & Breadth Trends
From the desk of Willie Delwiche.
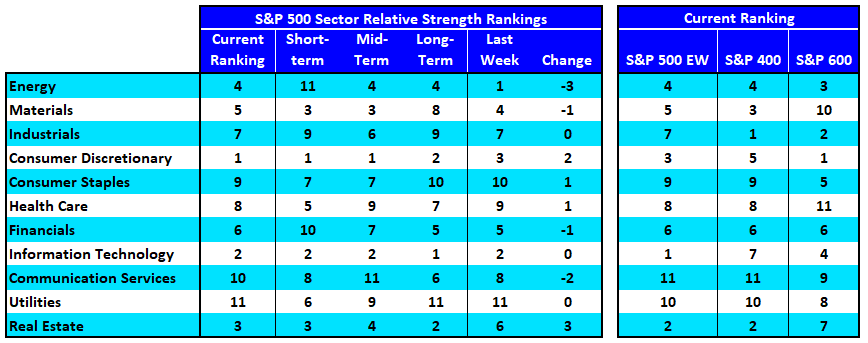
- With Energy and Financials experiencing short-term weakness, new leaders have emerged. Consumer Discretionary, Technology and Real Estate are in the top three spots in our relative strength rankings, showing leadership on both an equal-weight and cap-weight basis.
- Our industry group heat map shows Semiconductor strength is fueling the leadership coming from the Tech sector.
[PLUS] Weekly Top 10 Report
From the desk of Steve Strazza @Sstrazza
Our Top 10 Charts Report was just published.
In this weekly note, we highlight 10 of the most important charts or themes we’re currently seeing in asset classes around the world.
Mixed Action From Major Averages
The biggest theme from this week was failed breakouts. We saw a lot of major averages and sector indexes in the US violate their former highs and fall back into their prior ranges. The weakness was felt mostly by cyclicals. Large-cap indexes such as the Nasdaq and S&P 500 were largely unaffected and are still at highs. But on balance, the bears scored some points this week by pushing prices back below key levels. The chart below is an excellent depiction of the current state of markets. Some stocks, such as mid-caps, are still above their year-to-date highs and their breakouts are intact. Meanwhile, other stocks and indexes — like the Small-Cap Russell 2000 (upper pane), just printed failed breakouts and are now trapped beneath significant former resistance.
- « Previous Page
- 1
- …
- 61
- 62
- 63
- 64
- 65
- …
- 104
- Next Page »