This is the video recording of the February 10th Weekly Town Hall w/ Willie Delwiche
02/10/22 2:00 PM ET [Read more…]
Expert technical analysis of financial markets by JC Parets
This is the video recording of the February 10th Weekly Town Hall w/ Willie Delwiche
02/10/22 2:00 PM ET [Read more…]
From the desk of Willie Delwiche.
There is plenty of chatter today about inflation, the bond market, and the Fed.
I have a couple charts to share – and a couple key points worth making.
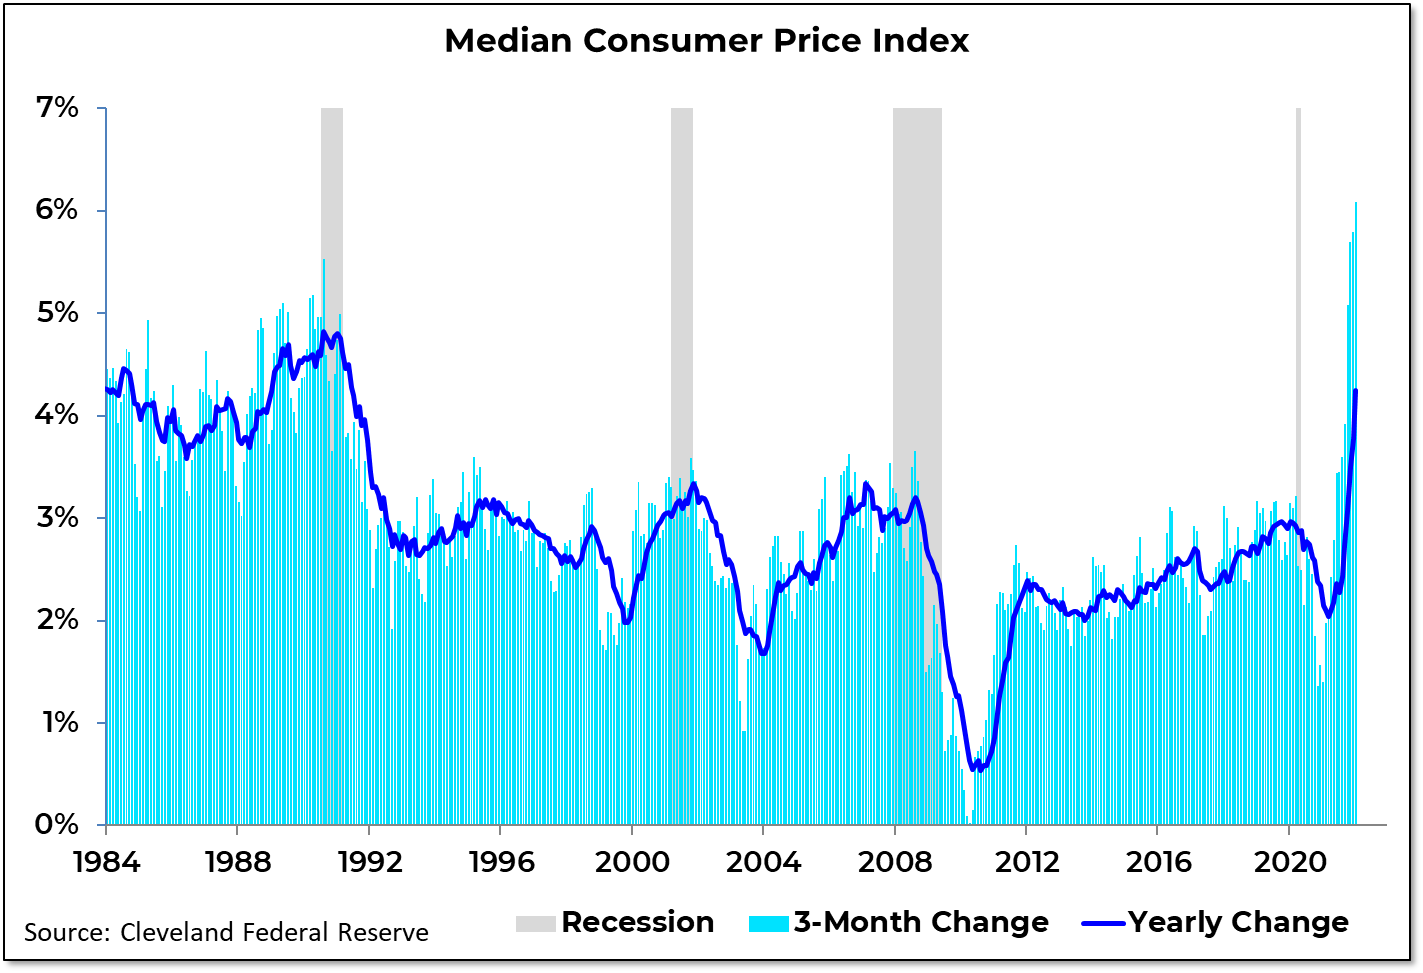
Inflation continues to run much hotter than a year ago and the Fed is still playing catch-up. The yearly change in the median CPI was at its highest level in a decade going into COVID, and is now at its highest level in 30+ years. Pressure is not letting up, and the 3-month change in the median CPI has surged to its highest level on record.
From the desk of Willie Delwiche.
Key Takeaway: Sentiment has unwound to a point that it’s now seen as an opportunity rather than a risk. Pessimism runs high, investors are cranky, and we have had the most bears since 2016. On top of that, our universe of risk-on/risk-off ratios continues to lean toward the risk-off side of the scale. There are signs of budding pessimism (Consensus bulls have risen for the second week in a row and the NAAIM exposure index fails to register excessive pessimism) after the recent bounce in the major equity indexes. But without a strong enough reaction to produce meaningful breadth thrusts it’s difficult to be bullish on the broader market.
Sentiment Report Chart of the Week: Sentiment Composite Points To Opportunity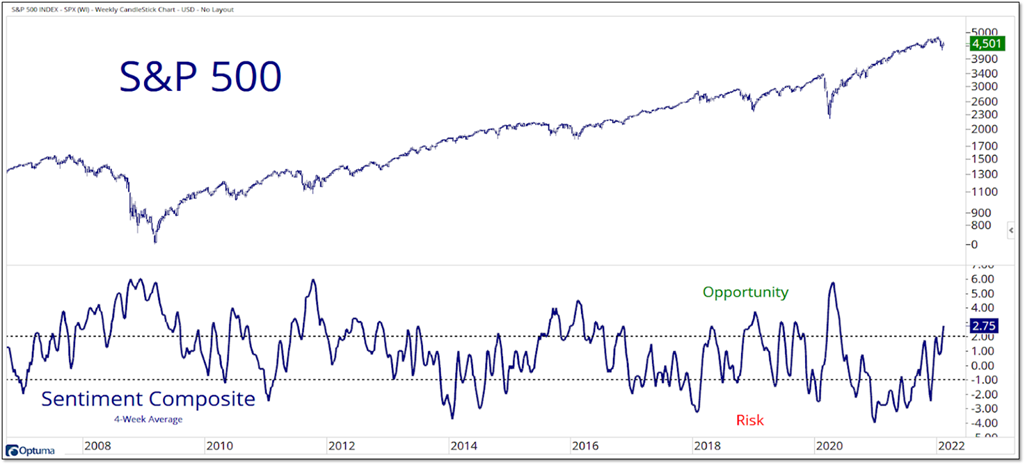
Sometimes the best approach is to set aside movements in individual indicators and look at an aggregate. Our Sentiment Composite has moved from being a market headwind in early 2021 to a tailwind now in 2022. After pessimism reaches an extreme, expanding optimism is bullish for stocks. At this point we want to see improved price action, renewed confidence from investors and sustained buying pressure.
Key Takeaways:
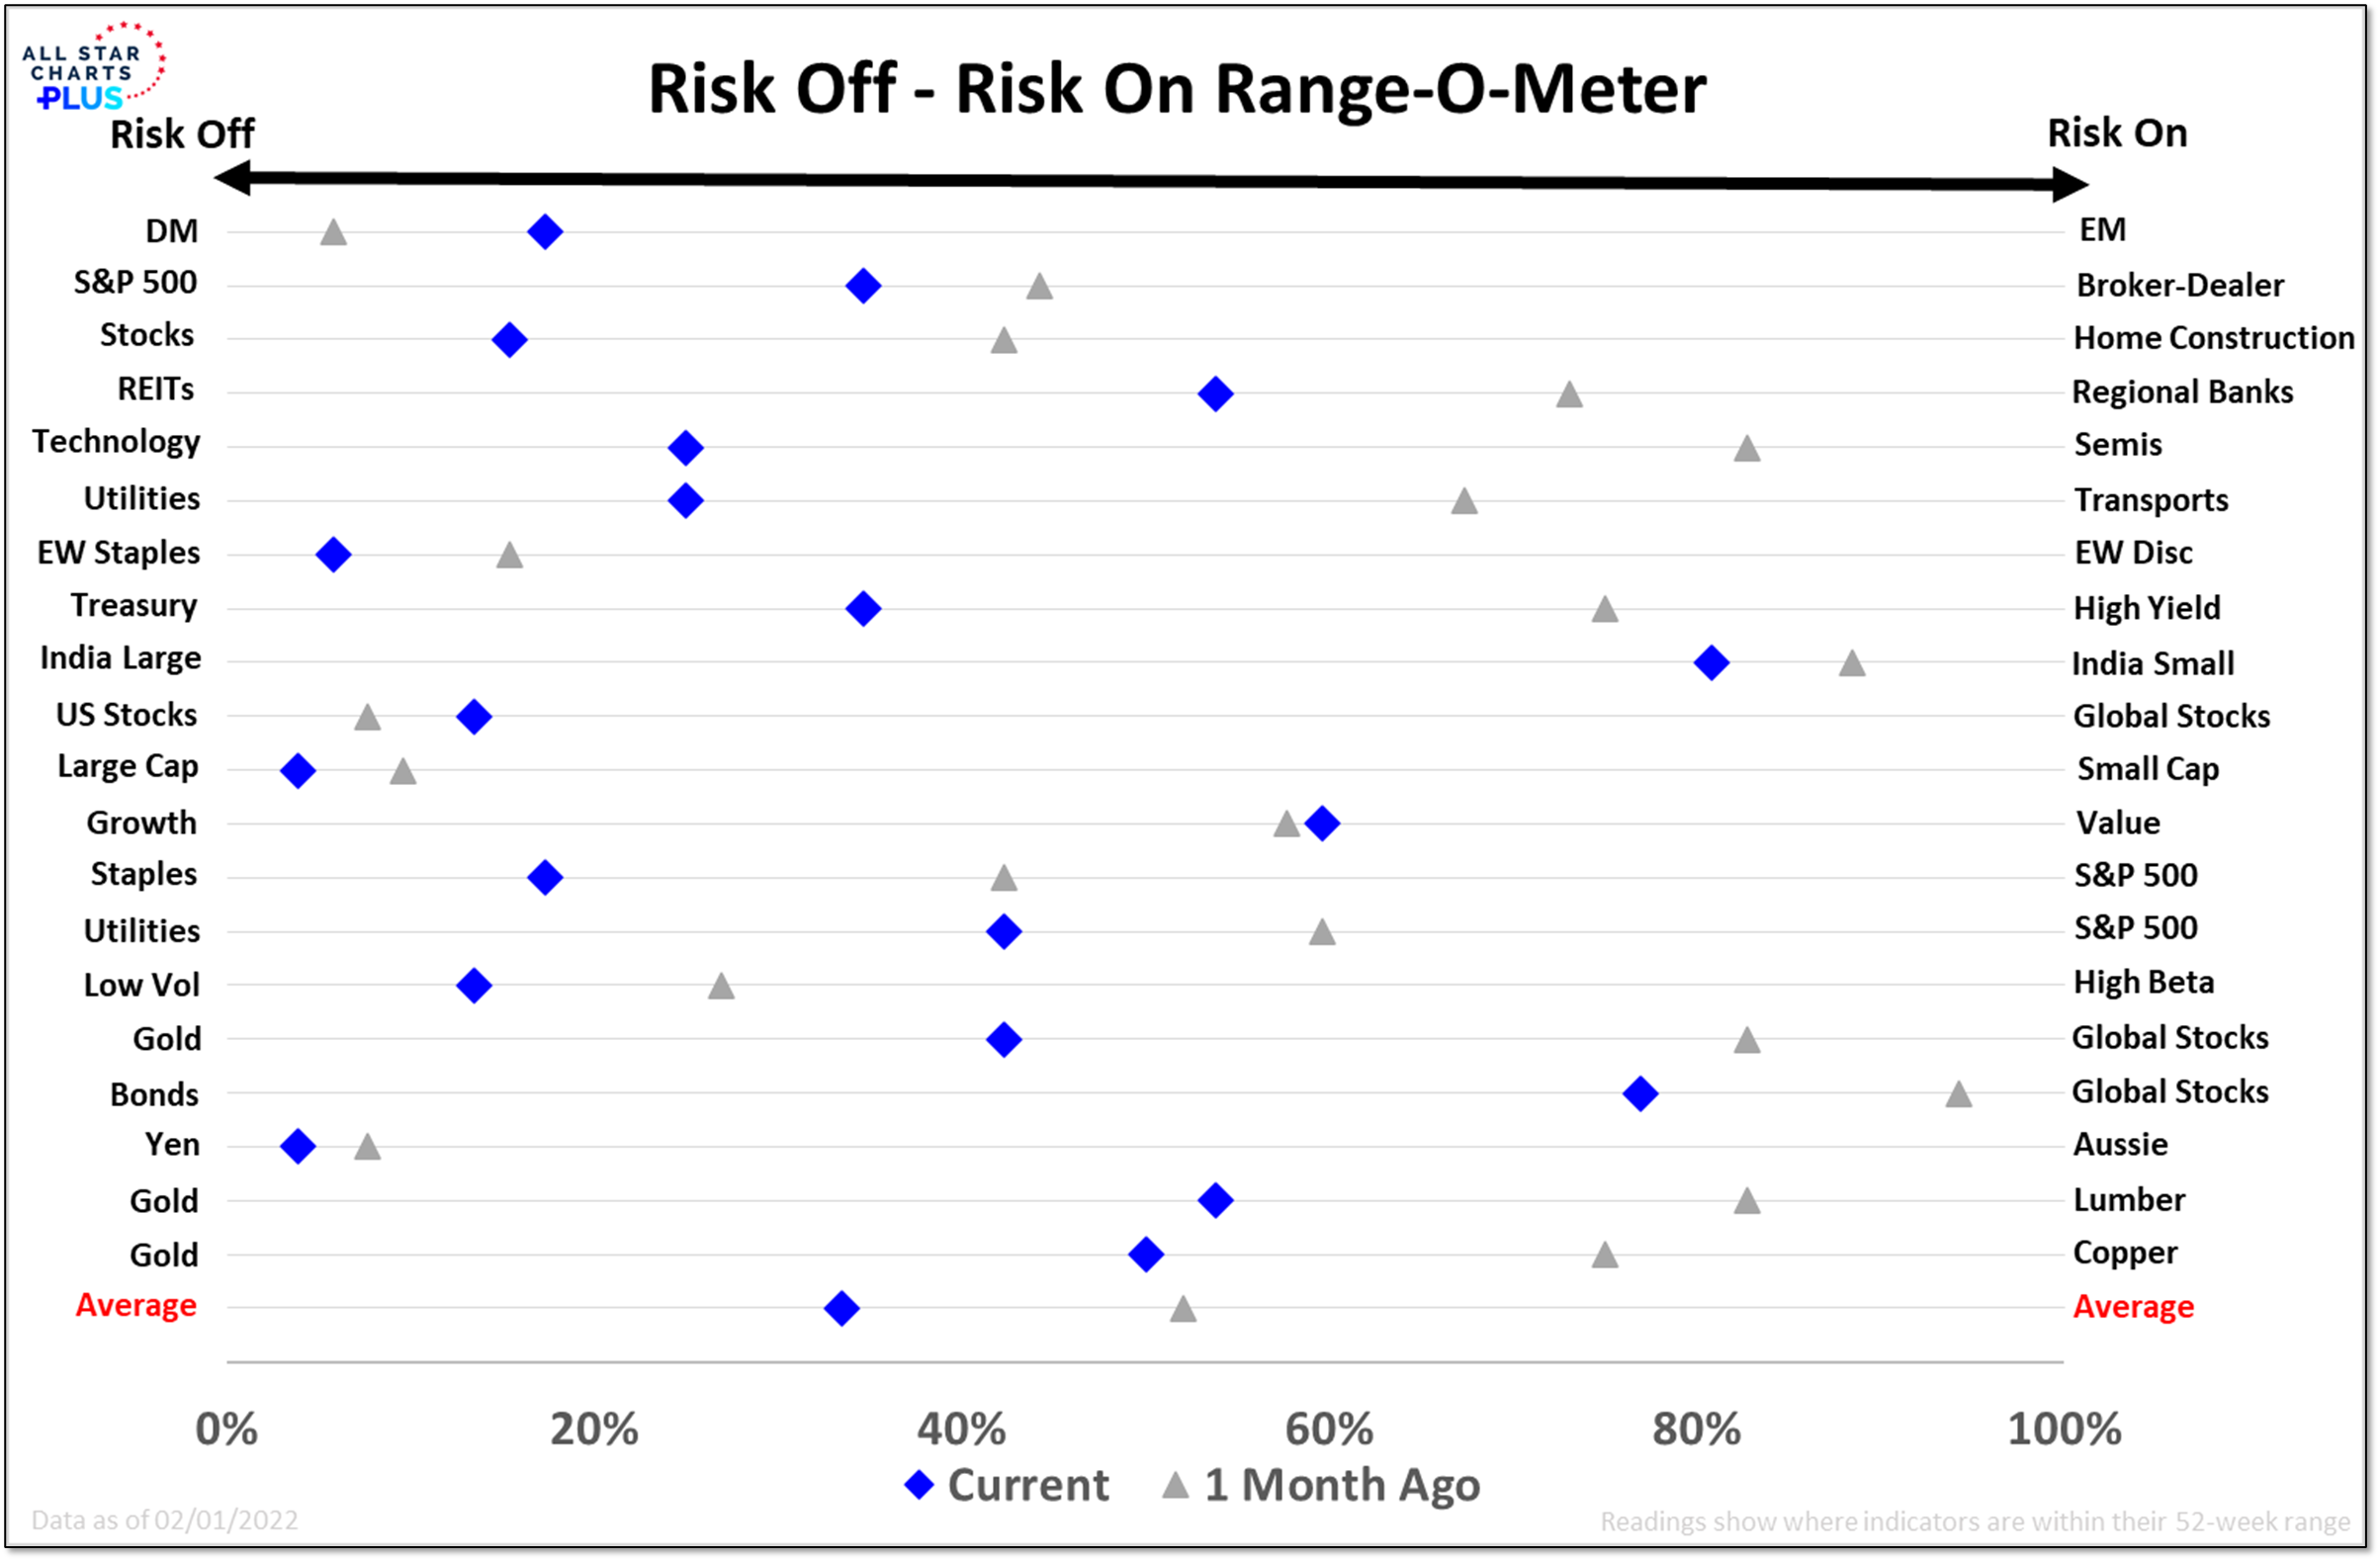
After highlighting our Risk Off – Risk On Range-O-Meter last Friday, I want to do a deeper dive into what we are seeing from a risk perspective. A majority of our Risk Off vs Risk On asset pairs (13 of 20) have seen more strength out of the Risk Off component than the Risk On Component in recent weeks. Over the past month the average pair has dropped below the 50% threshold and is now in the bottom half of its recent range. Financial sector pairs (Broker Dealers vs S&P 500, Regional Banks vs REITs) stand out as exceptions – areas where Risk On assets are showing strength and working toward new highs).
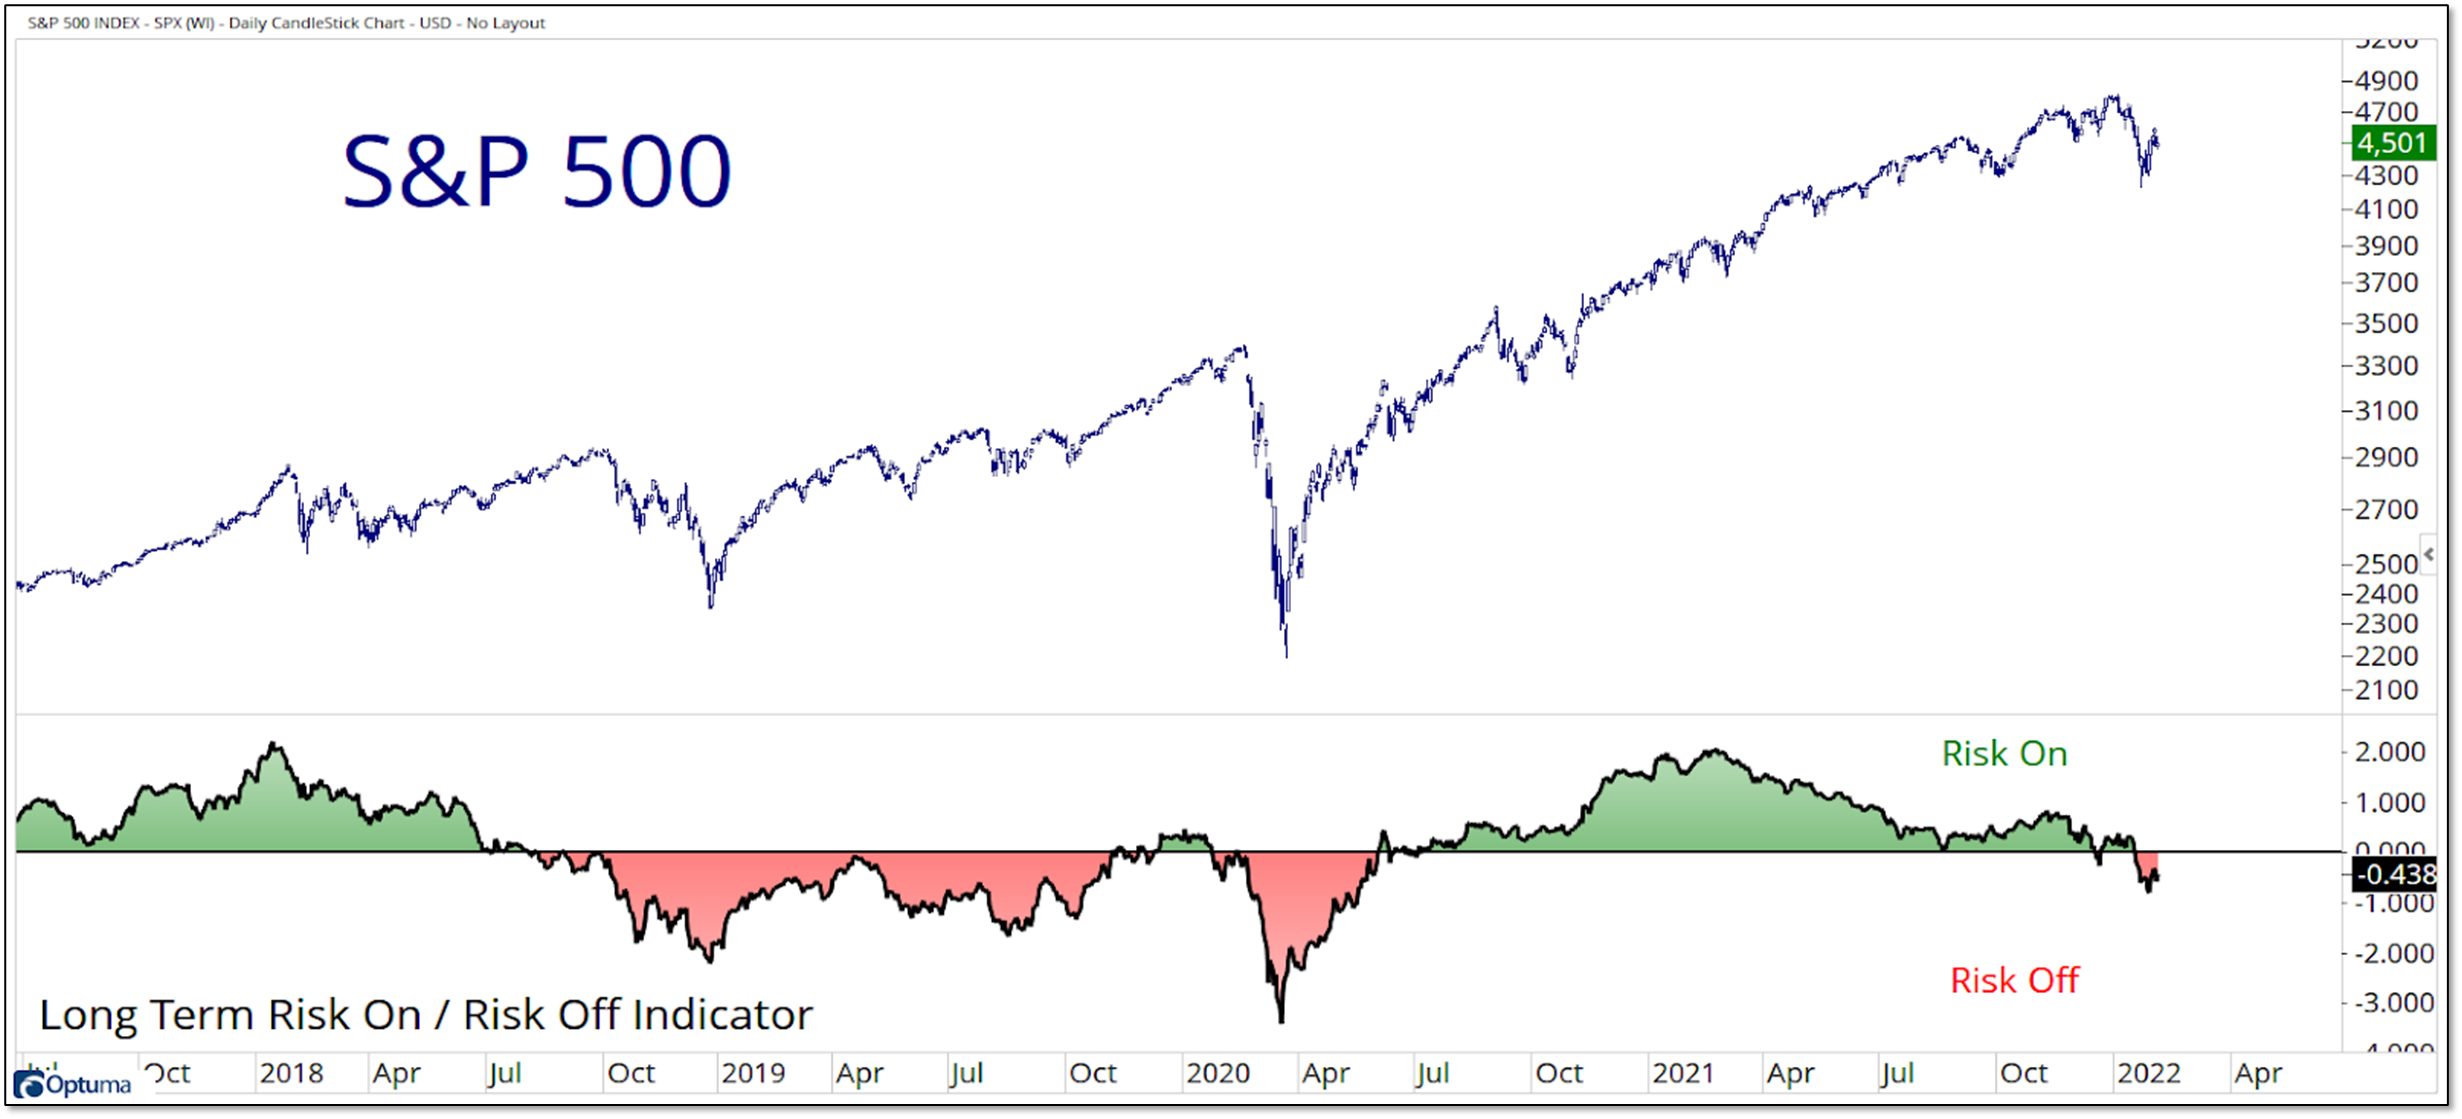
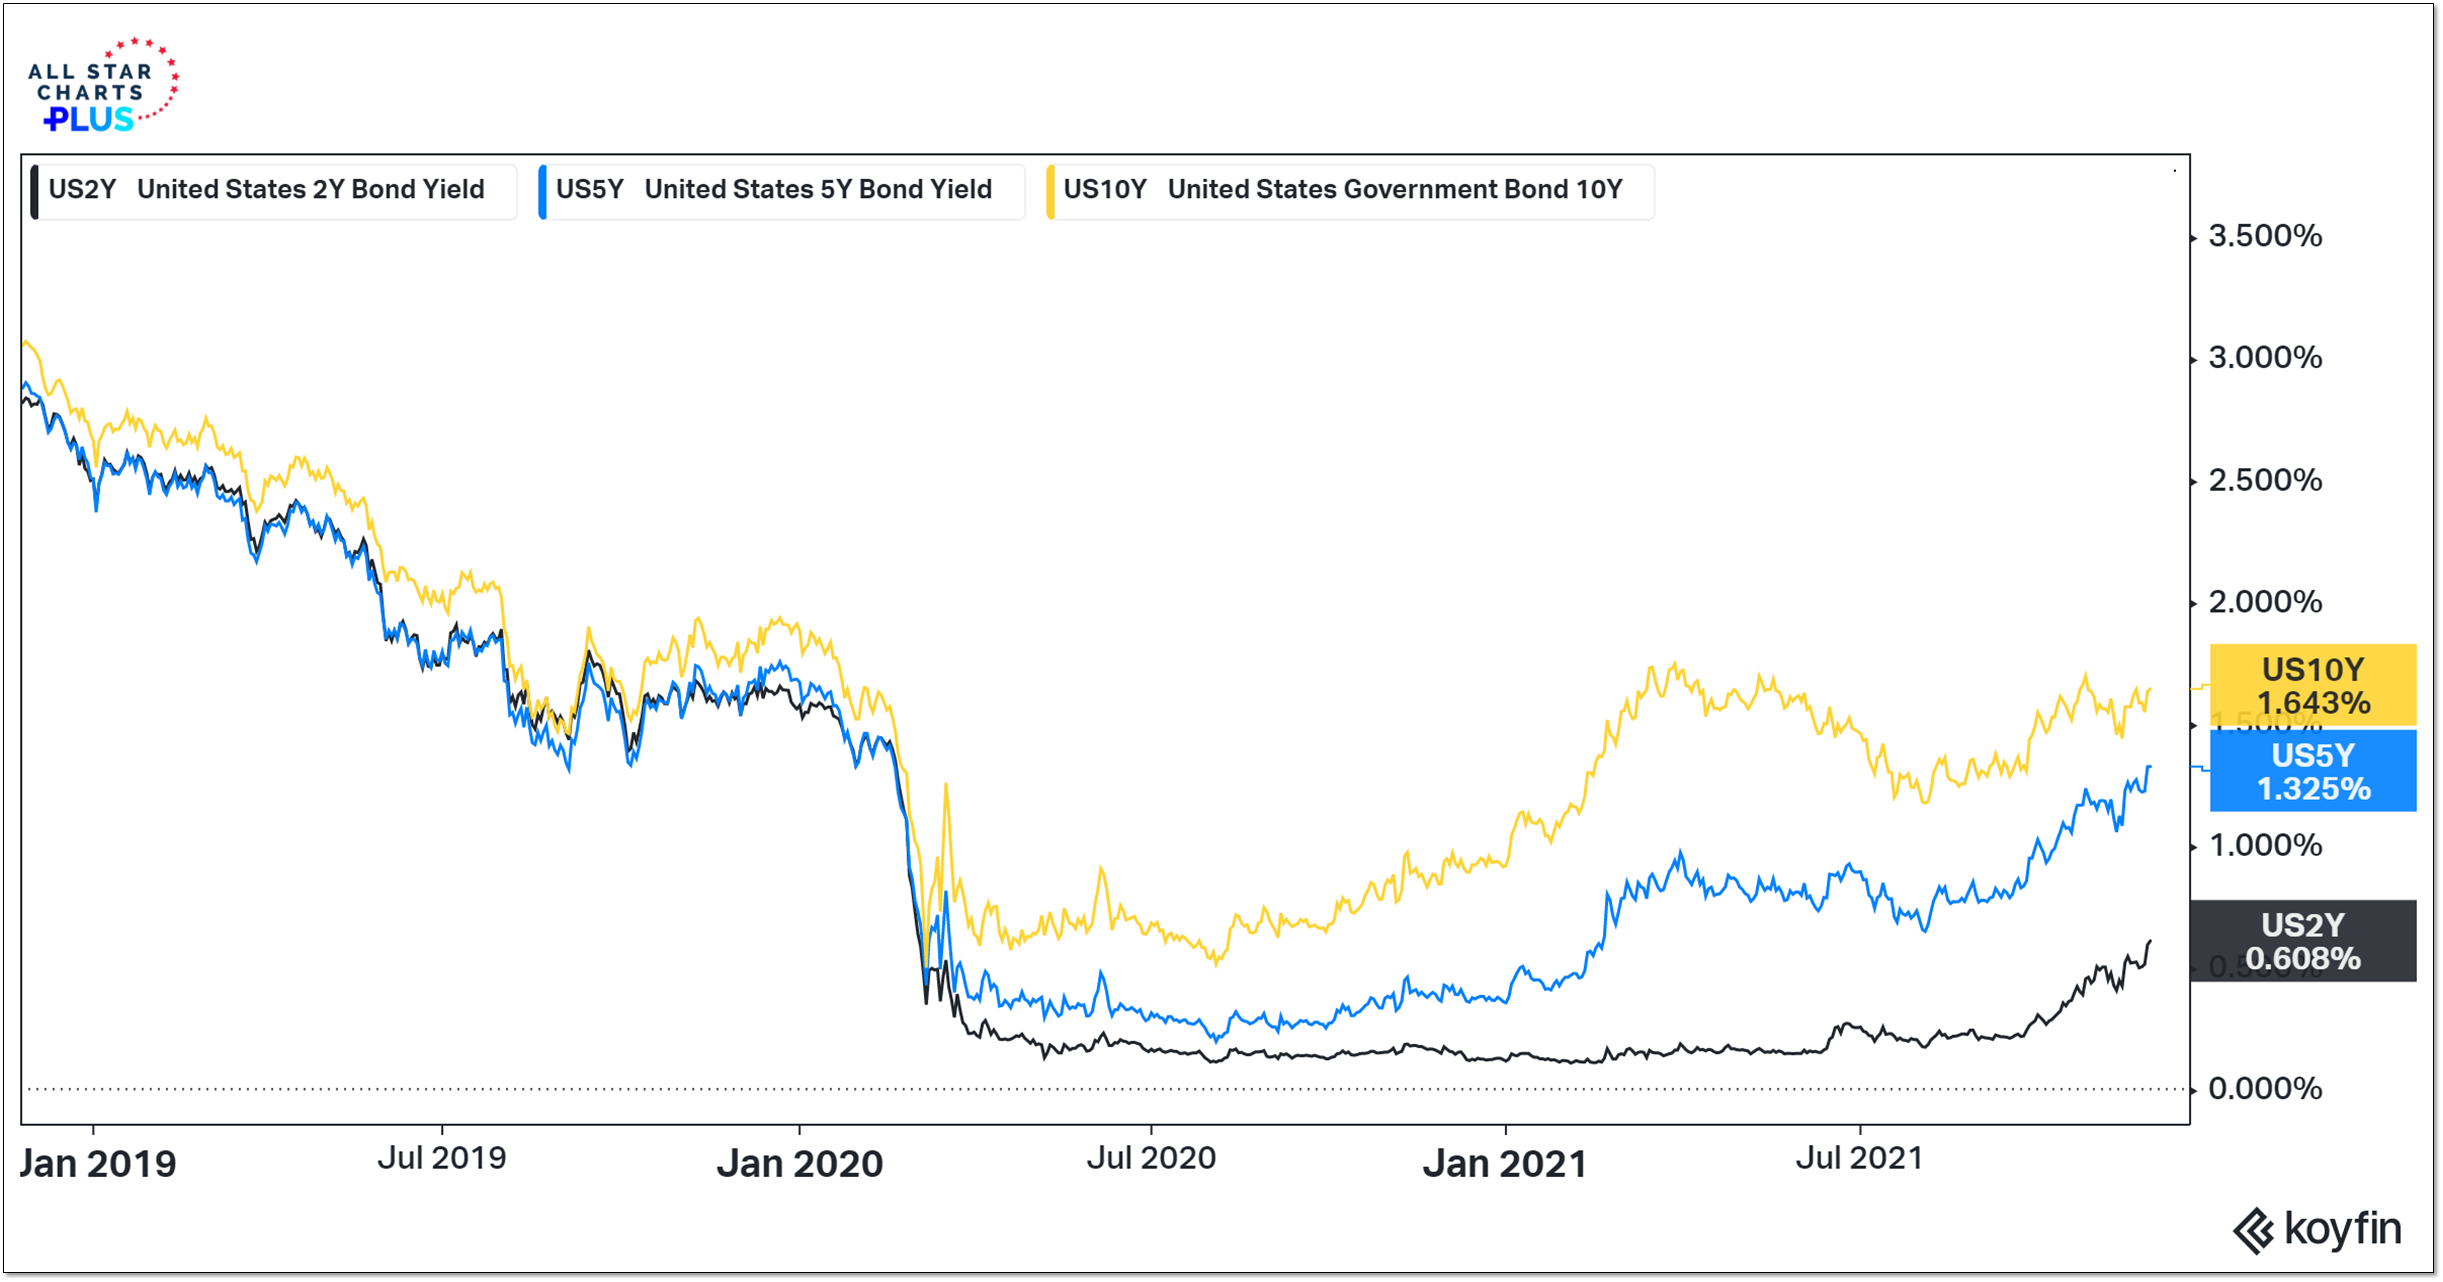
When we view this through the lens of our Custom Risk On – Risk Off Ratio we see some weakening in Risk On assets but the ratio mostly remains the sloppy mess that it has been for a year. Going through the charts of components of that ratio drives that point home. Risk appetite has waned though we are not seeing classic examples of risk aversion at this point. For example, bonds continue to sell off (and yields are rising to their highest levels in years around the world) and gold has struggled to hold a bid.
From the desk of Willie Delwiche.
Key to last week’s shift in the weight of the evidence from bullish to neutral was the continued deterioration in breadth trends, especially in the US. On everything except the shortest of time frames we continue to see more new lows than new highs. Over the past two months, there have only been two trading days on which the NASDAQ saw more new highs than new lows. Almost half of the sectors in the S&P 500 (5 of 11) are down over 8% for the year already..
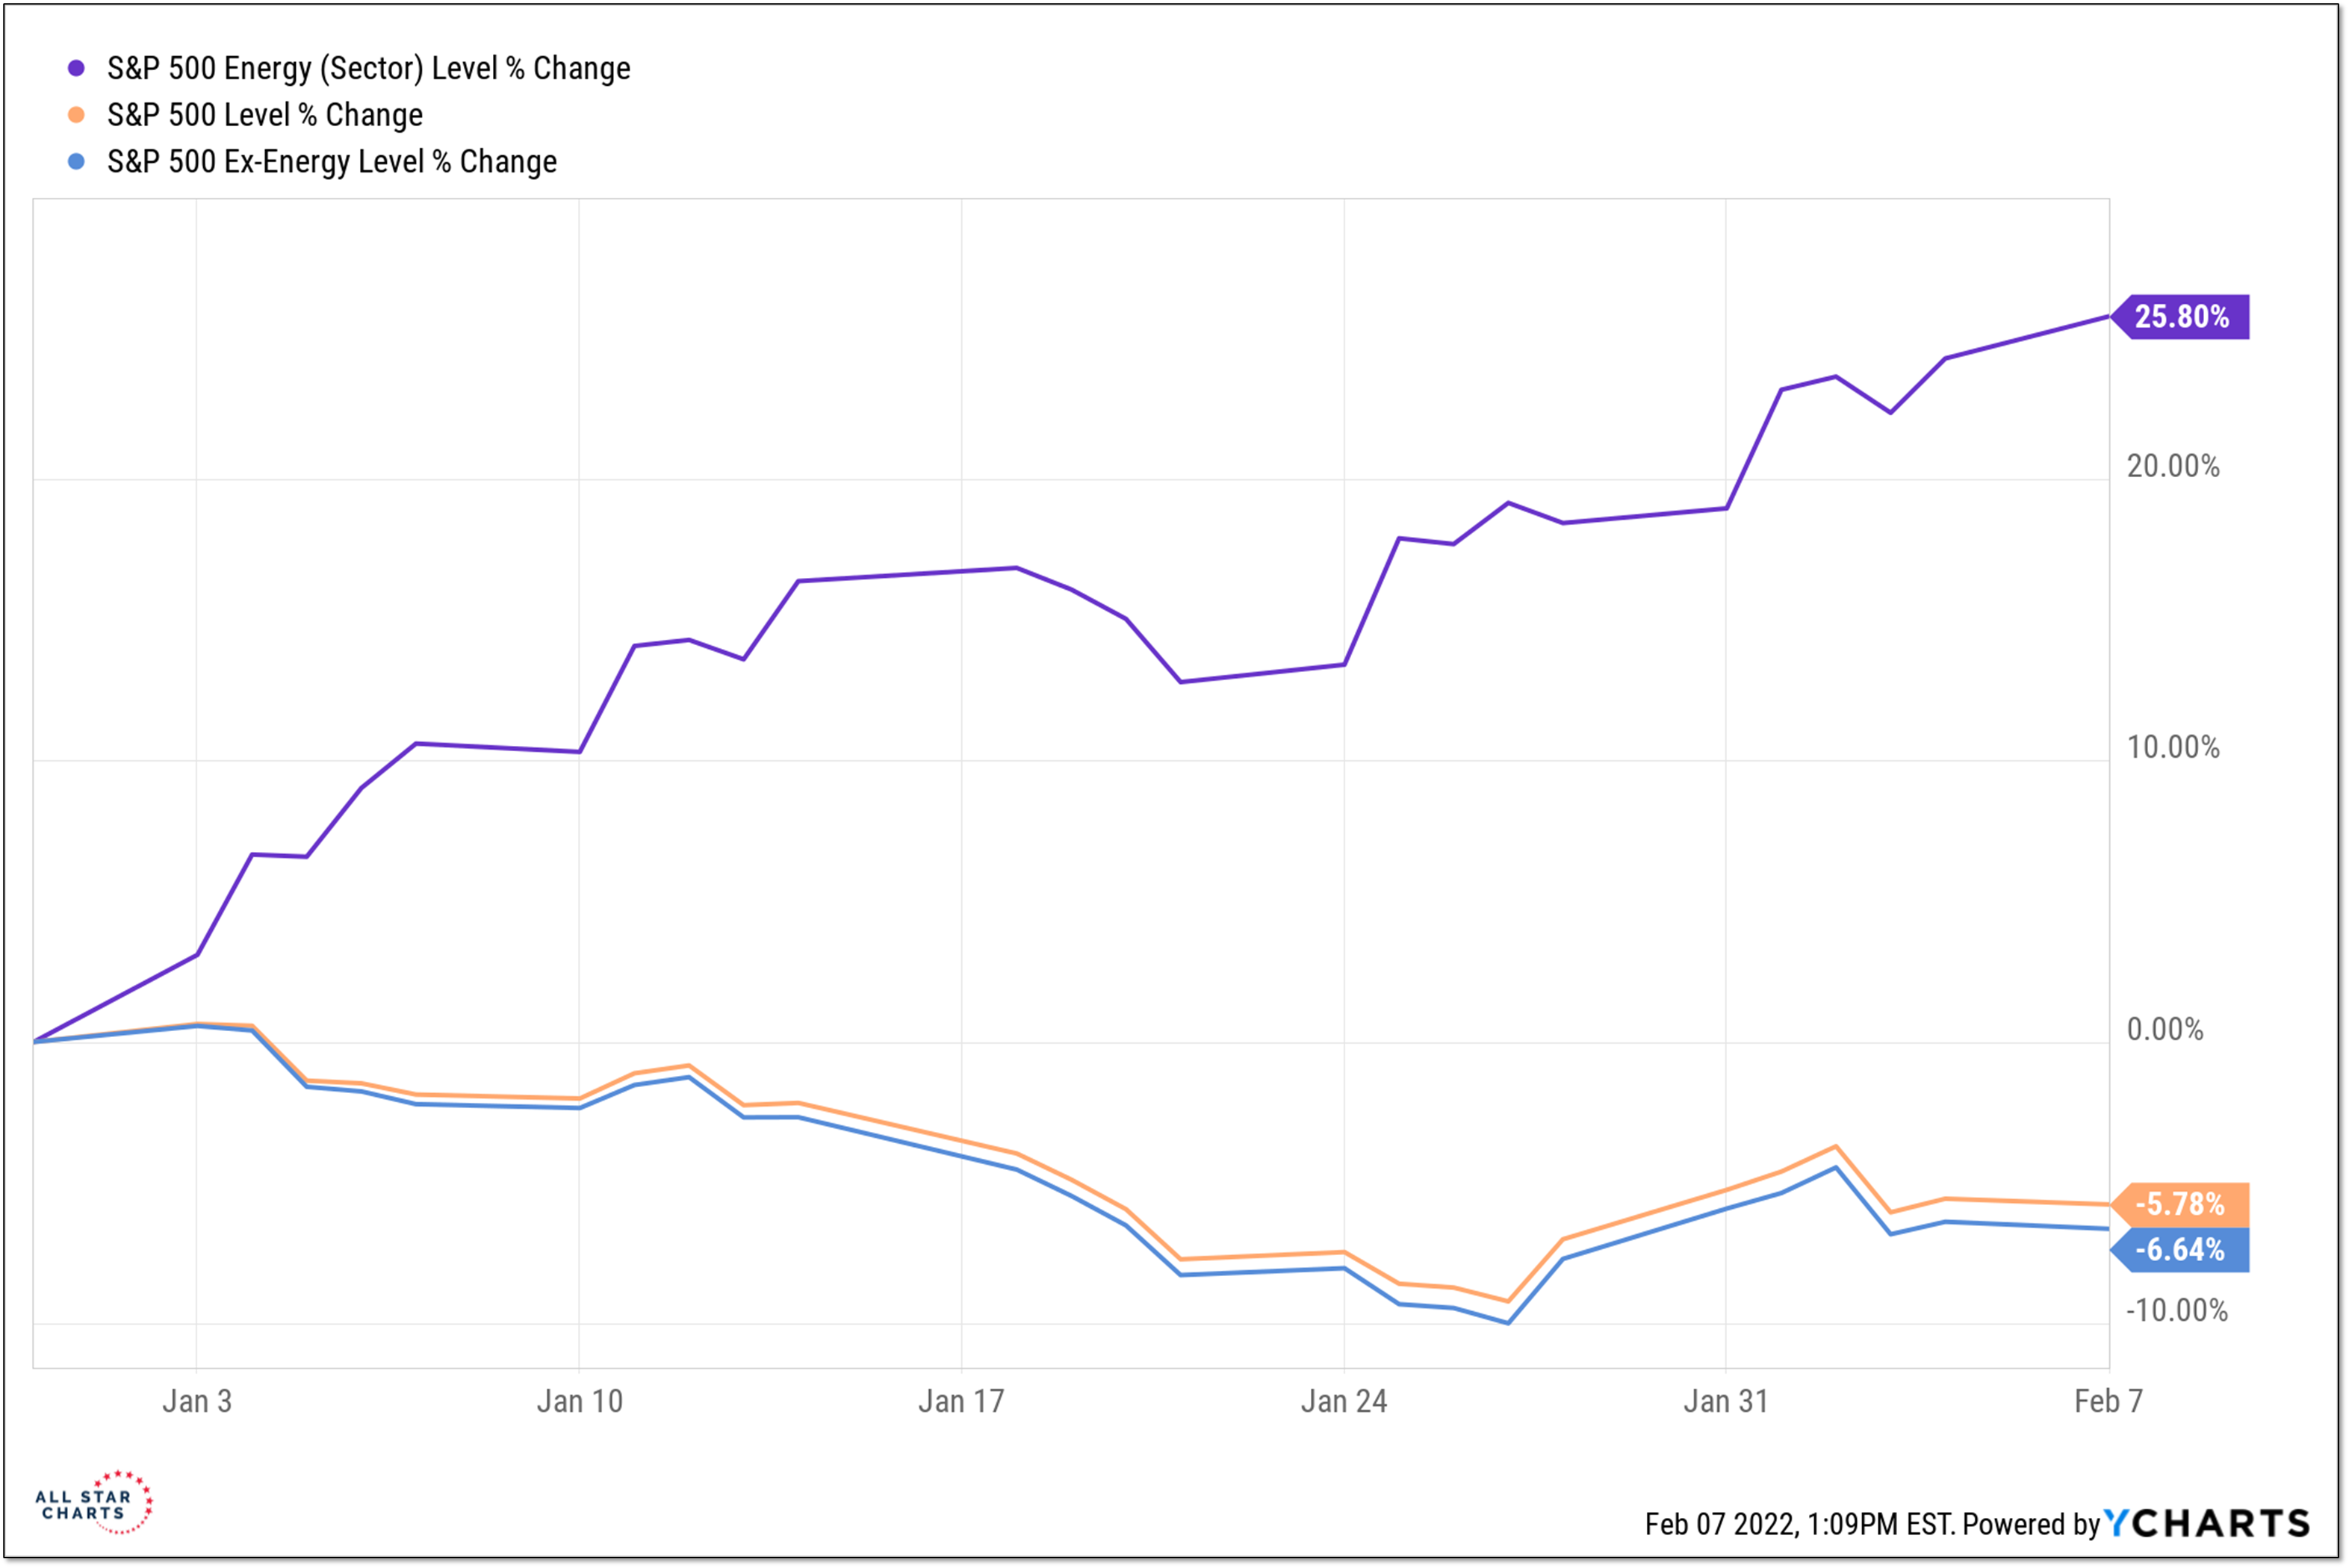
Only two sectors are in positive territory for the year and for one of those it is just barely. The one sector that is up meaningfully (Energy, +25% YTD) is such a small part of the S&P 500 that excluding entirely would drop the indexes performance by less than one percentage point (the S&P 500 is down 5.8% YTD, the S&P ex Energy is down 6.6%).
From the desk of Steve Strazza @Sstrazza
Our Top 10 Charts Report was just published.
In this weekly note, we highlight 10 of the most important charts or themes we’re currently seeing in asset classes around the world.
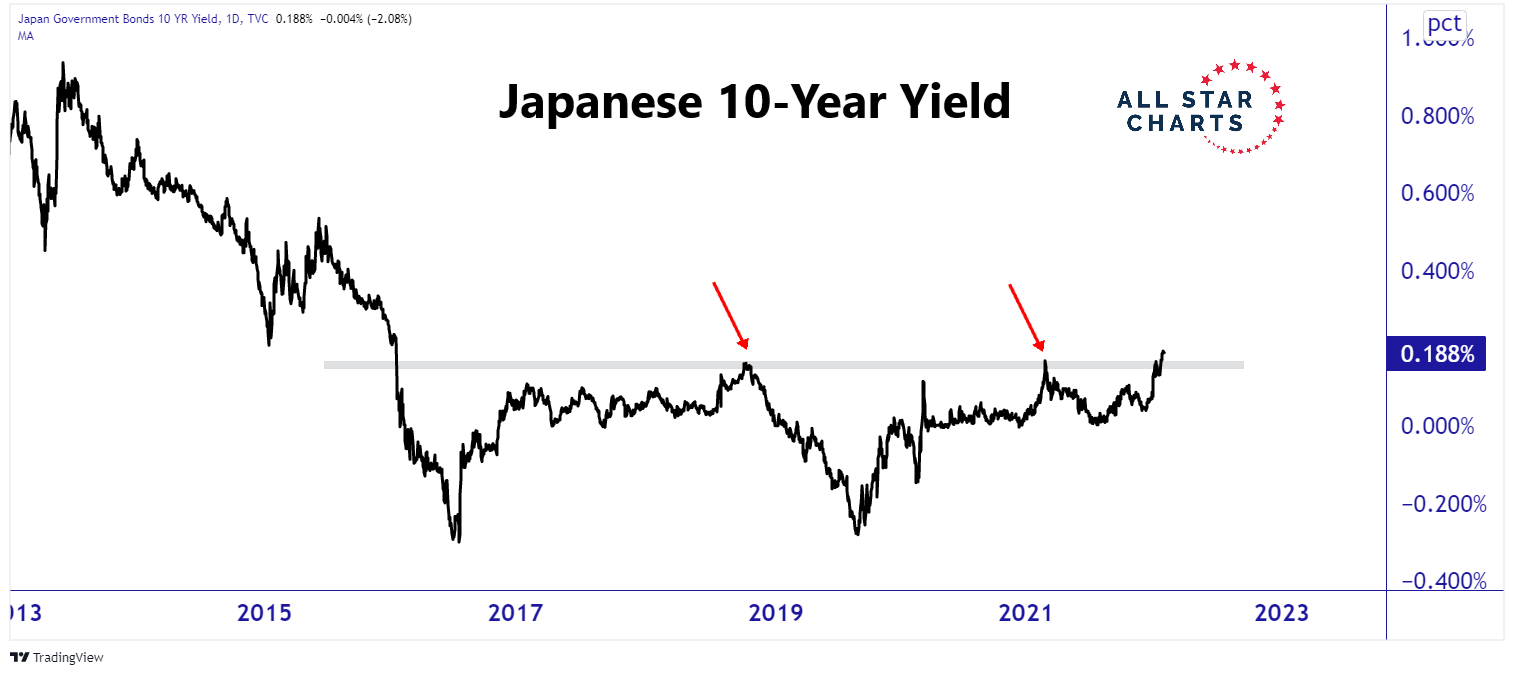
Rates Spike Around The Globe
Interest rates are on the rise, and it’s not just in the US and Europe. The Japanese 10-year yield hit its highest level in over five years last week. Like Germany, Japan is now back in positive territory after a half-decade of offering negative yields. All of this action is supportive of the new highs we’re seeing from the US 10-year yield. With rates on the rise around the world and the question turning into “how high” – as opposed to “if” – the FED will hike, it’s time to look for opportunities in the areas of the market that benefit the most from a rising rate environment.
From the desk of Steve Strazza @Sstrazza
Check out this week’s Momentum Report, our weekly summation of all the major indexes at a Macro, International, Sector, and Industry Group level.
By analyzing the short-term data in these reports, we get a more tactical view of the current state of markets. This information then helps us put near-term developments into the big picture context and provides insights regarding the structural trends at play.
Let’s jump right into it with some of the major takeaways from this week’s report:
* ASC Plus Members can access the Momentum Report by clicking the link at the bottom of this post.
From the desk of Willie Delwiche.
By looking at various ratios relative to where they have been over the past year, we get a sense of investor risk appetite from an intermarket perspective. The pairwise comparisons in our risk off – risk on Range-O-Meter show a decisive tilt toward risk off assets over the past month. A few (Staples vs Discretionary, Large-Cap vs Small-Cap, Yen vs Aussie Dollar) are nearing new 52-week extremes favoring the risk-off side of the ratio. We could get some near-term relief from the intense selling of January, some of that has been seen this week already. But if we are seeing broad and sustainable strength, I expect it will be evident by a decisive move toward the risk-on side of our range-o-meter.