This is the video recording of the September 1st, 2022, Weekly Town Hall w/ Willie Delwiche.
09/01/22 2:00 PM ET [Read more…]
Expert technical analysis of financial markets by JC Parets
This is the video recording of the September 1st, 2022, Weekly Town Hall w/ Willie Delwiche.
09/01/22 2:00 PM ET [Read more…]
From the desk of Willie Delwiche.
The first eight months of the year have been a grind.
A mid-month reversal in August took the S&P 500 from a 4% gain to 4% loss for the month and the early breadth and momentum thrusts now seem like a distant memory. Two-thirds of the way through the year and we are on track for the fewest days of more new highs than new lows observed in the past two decades, and 2022 is just ahead of 2020 (and lagging only 2009) in terms of daily swings of 1% or more on the S&P 500. Weakness in stocks this year has been exacerbated by weakness in bonds, as yields have climbed to new multi-year highs. The 60/40 stock/bond benchmark portfolio is down 14% through August.
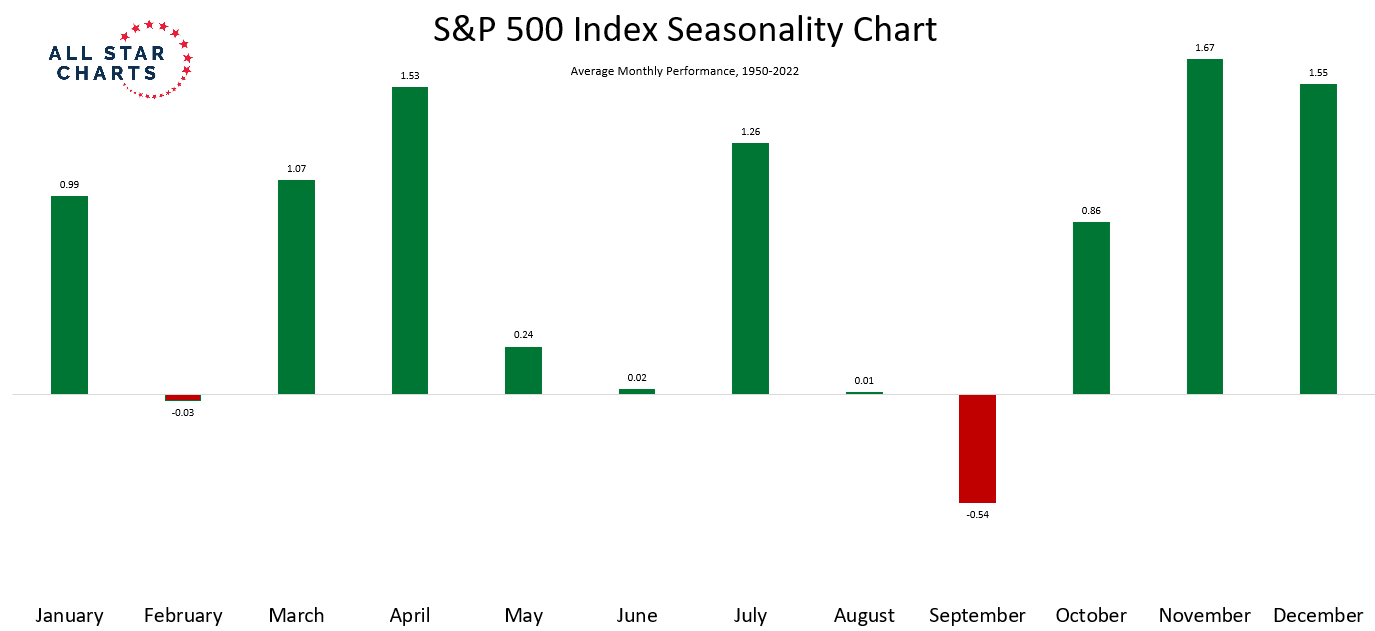
Welcome to September. If you haven’t heard, it’s the worst month of the year for stocks. Since 1950, only two months (February and September) have been down on average. This is a case were we don’t really need to focus on the exact numbers – the large red bar for September says it all:
From the Desk of Steve Strazza @Sstrazza
Regardless of the time frame, we continue to see leadership and relative strength from energy stocks.
Outside of utilities, it is the only sector flaunting positive returns on a year-to-date basis.
Even over the past several weeks, with the broader market coming under increasing pressure, energy stands out as the most resilient group.
When we look at the structural trend for energy stocks, this makes a lot more sense.
While most sectors and indexes are facing downward sloping or sideways 200-day moving averages, indicating that the path of least resistance is lower, energy stocks remain in a strong primary uptrend.
While the corrective action of the past few days has not left energy unscathed, the Energy Sector SPDR $XLE remains above our risk level of 79.
As long as this is the case, the bias is higher for energy, and we want to be looking for the strongest stocks to buy as a way to express our bullish thesis.
This brings us to today’s post.
From the Desk of Steve Strazza @Sstrazza
Welcome to the 2 to 100 Club.
As many of you know, something we’ve been working on internally is using various bottom-up tools and scans to complement our top-down approach. It’s really been working for us!
One way we’re doing this is by identifying the strongest growth stocks as they climb the market-cap ladder from small- to mid- to large- and, ultimately, to mega-cap status (over $200B).
Once they graduate from small-cap to mid-cap status (over $2B), they come on our radar. Likewise, when they surpass the roughly $30B mark, they roll off our list.
But the scan doesn’t just end there.
We only want to look at the strongest growth industries in the market, as that is typically where these potential 50-baggers come from.
Some of the best performers in recent decades – stocks like Priceline, Amazon, Netflix, Salesforce, and myriad others – would have been on this list at some point during their journey to becoming the market behemoths they are today.
When you look at the stocks in our table, you’ll notice we’re only focused on Technology and Growth industry groups such as Software, Semiconductors, Online Retail, Solar, etc.
Then, like any good technician, we filter the list down to those closest to new highs.
This allows the cream of these strong groups to rise to the top and helps streamline our mission to identify technical breakouts in the top-performing stocks.
From the desk of Willie Delwiche.
Key Takeaway: In July, consumer expectations for stocks dropped to their lowest level since March 2009. Excessive optimism is clearly not an issue for stocks right here. But bulls need to be resilient if the market is going to move higher. Recent breadth and momentum thrusts are fodder for optimism, but the persistent downtrend in stocks is dampening rally attempts. The latest numbers from AAII, II and NAAIM suggest questions about bullish resolve are well-founded. All have rolled over and are showing increased caution. If that continues, a broader re-set becomes more likely – one in which positioning (which has been resilient) gets more in line with sentiment.
Sentiment Report Chart of the Week: Expectations For Stocks Have Tanked
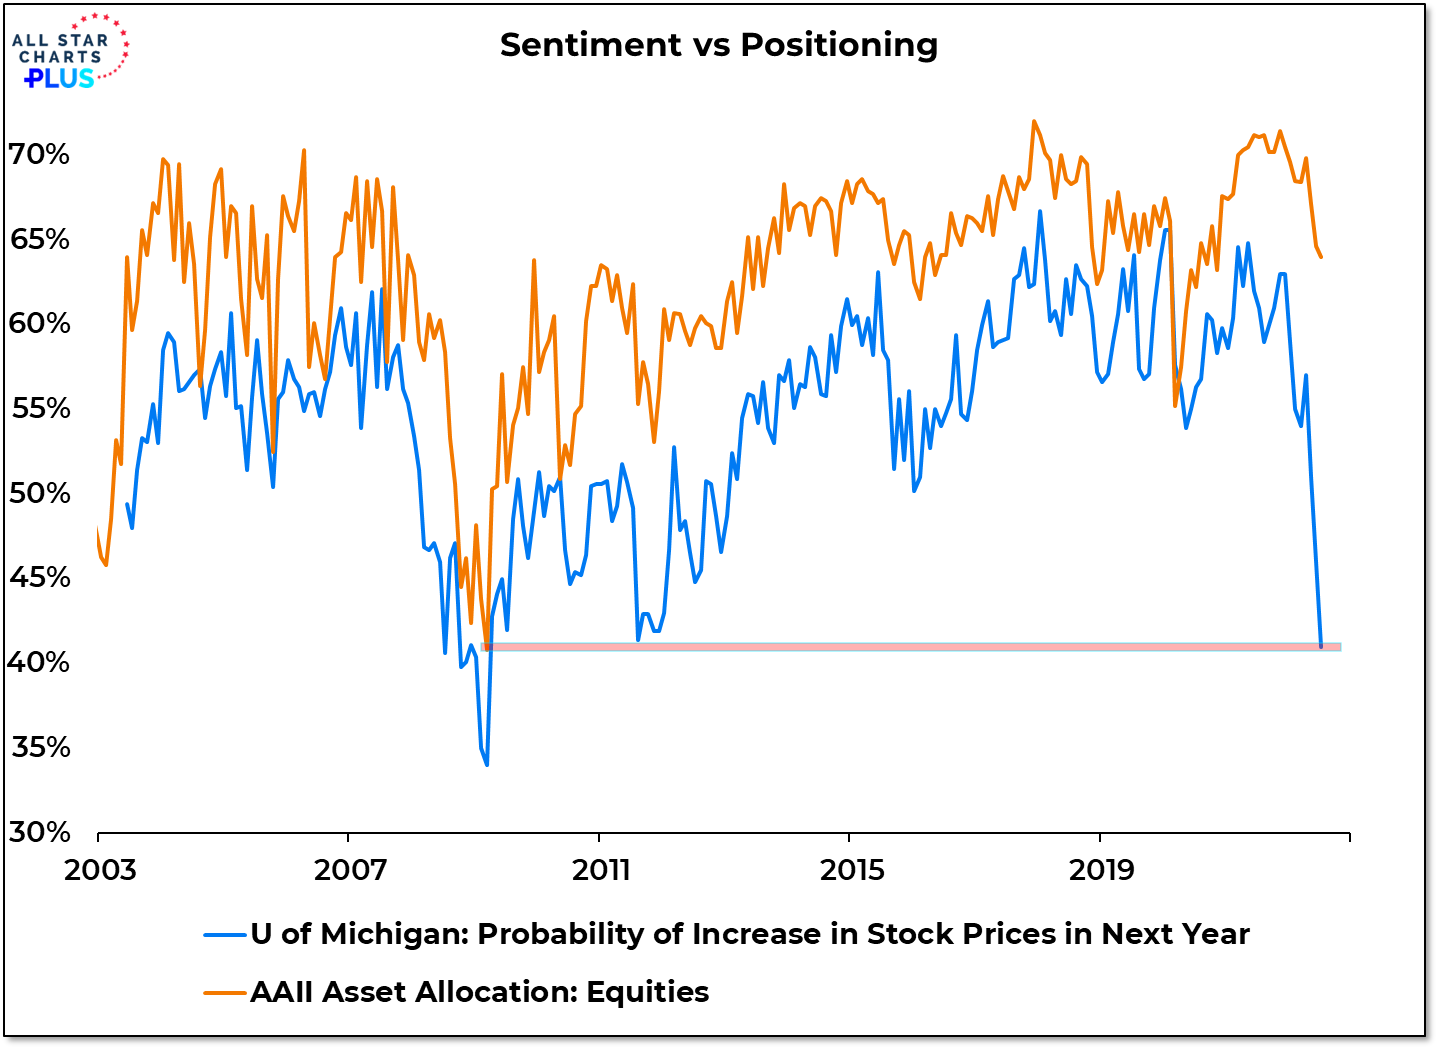
Among the questions asked in the University of Michigan Survey of Consumers is one regarding expectations about the direction of stocks over the coming year. Specifically it asks about the perceived likelihood that stocks will rise over the next 12 months. When that data for July was aggregated, it showed the smallest probability that stocks will move higher since March 2009. That is not too out of line with some of the other sentiment extremes witnessed earlier this summer. But it also highlights the continuing contrast between sentiment and positioning. In March of 2009, the AAII asset allocation survey showed 41% exposure to stocks. In July it was at 64%. Prior to this year, the correlation between these two surveys was better than 80%, but they were further apart than ever in July.
With the rise in $VIX (the “fear gauge”) over the past several trading days continuing to persist, we’ve been on the hunt for options premium selling opportunities. Higher volatility environments lend themselves to better opportunities for premium sellers who can manage their risks and size their positions conservatively.
As such, we’re going to sell some premium in the banking sector to take advantage of elevated premiums and what appears to be a high likelihood of continuing sideways action. [Read more…]
From the Desk of Louis Sykes @haumicharts
One of the hallmarks that’s defined crypto is its sheer innovative and scalable nature.
Blockchains are bringing tremendous benefits to traditional industries; self-sovereignty of massive sums of capital, incredibly efficient payment methods, digital collectibles, play-to-earn, and decentralization are all great examples.
Perhaps one of the more overlooked outcomes of this asset class blossoming is the promotion of finance among disenfranchised youth.
These are the registration details for our Live Monthly Candlestick Strategy Session for Premium Members of All Star Charts.
This month’s Video Conference Call will be held on Tuesday September 6th @ 6PM ET. As always, if you cannot make the call live, the video and slides will be archived and published here along with every other live call since 2015.
Here are the details for Tuesday evening: [Read more…]