It’s been a choppy month so far hasn’t it?
This is classic behavior for February. See here.
Look at this sloppy hot mess. [Read more…]
Expert technical analysis of financial markets by JC Parets
From the desk of Steve Strazza @Sstrazza
We held our February Monthly Strategy Session last week. Premium Members can access and rewatch it here.
Non-members can get a quick recap of the call simply by reading this post each month.
By focusing on long-term, monthly charts, the idea is to take a step back and put things into the context of their structural trends. This is easily one of our most valuable exercises as it forces us to put aside the day-to-day noise and simply examine markets from a “big-picture” point of view.
With that as our backdrop, let’s dive right in and discuss three of the most important charts and/or themes from this month’s call.
This is the video recording of the February 16th, 2023, Weekly Town Hall w/ Willie Delwiche.
2/16/23 2:00 PM ET [Read more…]
From the Desk of Ian Culley
I prefer to focus on price when analyzing markets.
It’s what pays us at the end of the day. And it bakes in all the news and lagging economic data I tend to ignore.
A few weeks ago, I urged investors to track trends, not inflation.
Honestly, I was only half serious. I pay attention to the Fed and CPI data – mainly to stay aware of the increased volatility accompanying important release dates.
But price is king. And when I look at my charts, the narrative of easing inflation appears suspect…
It’s the weekly currency edition of What the FICC?
Despite the overarching range-bound action and intraday indecision across the currency markets, I continue to find trade setups with well-defined risks.
Check it out!
From the desk of Steve Strazza @Sstrazza
Welcome to the 2 to 100 Club.
As many of you know, something we’ve been working on internally is using various bottom-up tools and scans to complement our top-down approach. It’s really been working for us!
One way we’re doing this is by identifying the strongest growth stocks as they climb the market-cap ladder from small- to mid- to large- and, ultimately, to mega-cap status (over $200B).
Once they graduate from small-cap to mid-cap status (over $2B), they come on our radar. Likewise, when they surpass the roughly $30B mark, they roll off our list.
But the scan doesn’t just end there.
We only want to look at the strongest growth industries in the market, as that is typically where these potential 50-baggers come from.
Some of the best performers in recent decades – stocks like Priceline, Amazon, Netflix, Salesforce, and myriad others – would have been on this list at some point during their journey to becoming the market behemoths they are today.
When you look at the stocks in our table, you’ll notice we’re only focused on Technology and Growth industry groups such as Software, Semiconductors, Online Retail, Solar, etc.
Then, like any good technician, we filter the list down to those closest to new highs.
This allows the cream of these strong groups to rise to the top and helps streamline our mission to identify technical breakouts in the top-performing stocks.
From the Desk of Willie Delwiche
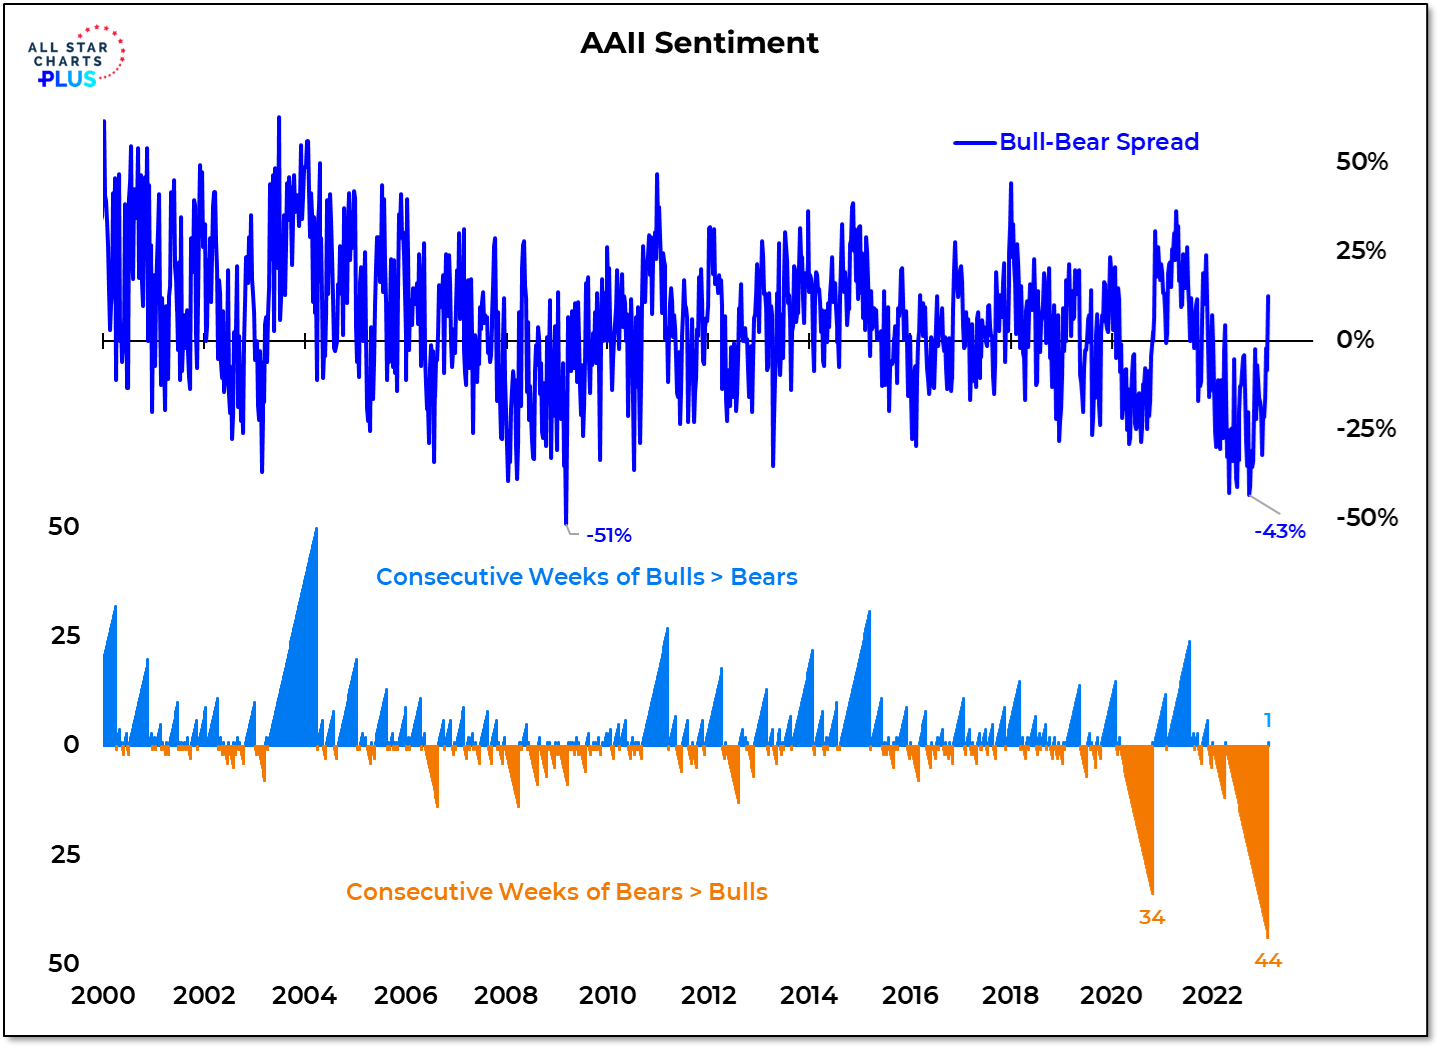
Last week was the first time in 45 weeks that the weekly AAII survey showed more bulls than bears. The most recent stretch of pessimism did not eclipse the Financial Crisis in terms of intensity (the bull-bear spread bottomed last year at -43%, versus -51% in March 2009). But it did set the record for persistence.
Why It Matters: This newfound optimism is leading to some concern that the rally off of last year’s lows has run its course. This is based on the idea sentiment is always best used as a contrarian indicator. Leaning against sentiment tends to be most successful after it has reversed at extremes. The path higher for stocks becomes more clear as bulls replace bears. Rallies that are accompanied by rising optimism tend to be more sustainable. Optimism becomes a headwind after it becomes excessive and begins to fade. While on the watch for excesses, mostly we are seeing investors finally beginning to embrace stock market strength. At this point in the cycle, strength fuels optimism and optimism fuels strength. Increasing optimism after persistent pessimism is a welcome sight.
In this week’s Sentiment Report we take a closer look at how we need bulls to have a bull market and where to look for early signs that optimism could be getting excessive.