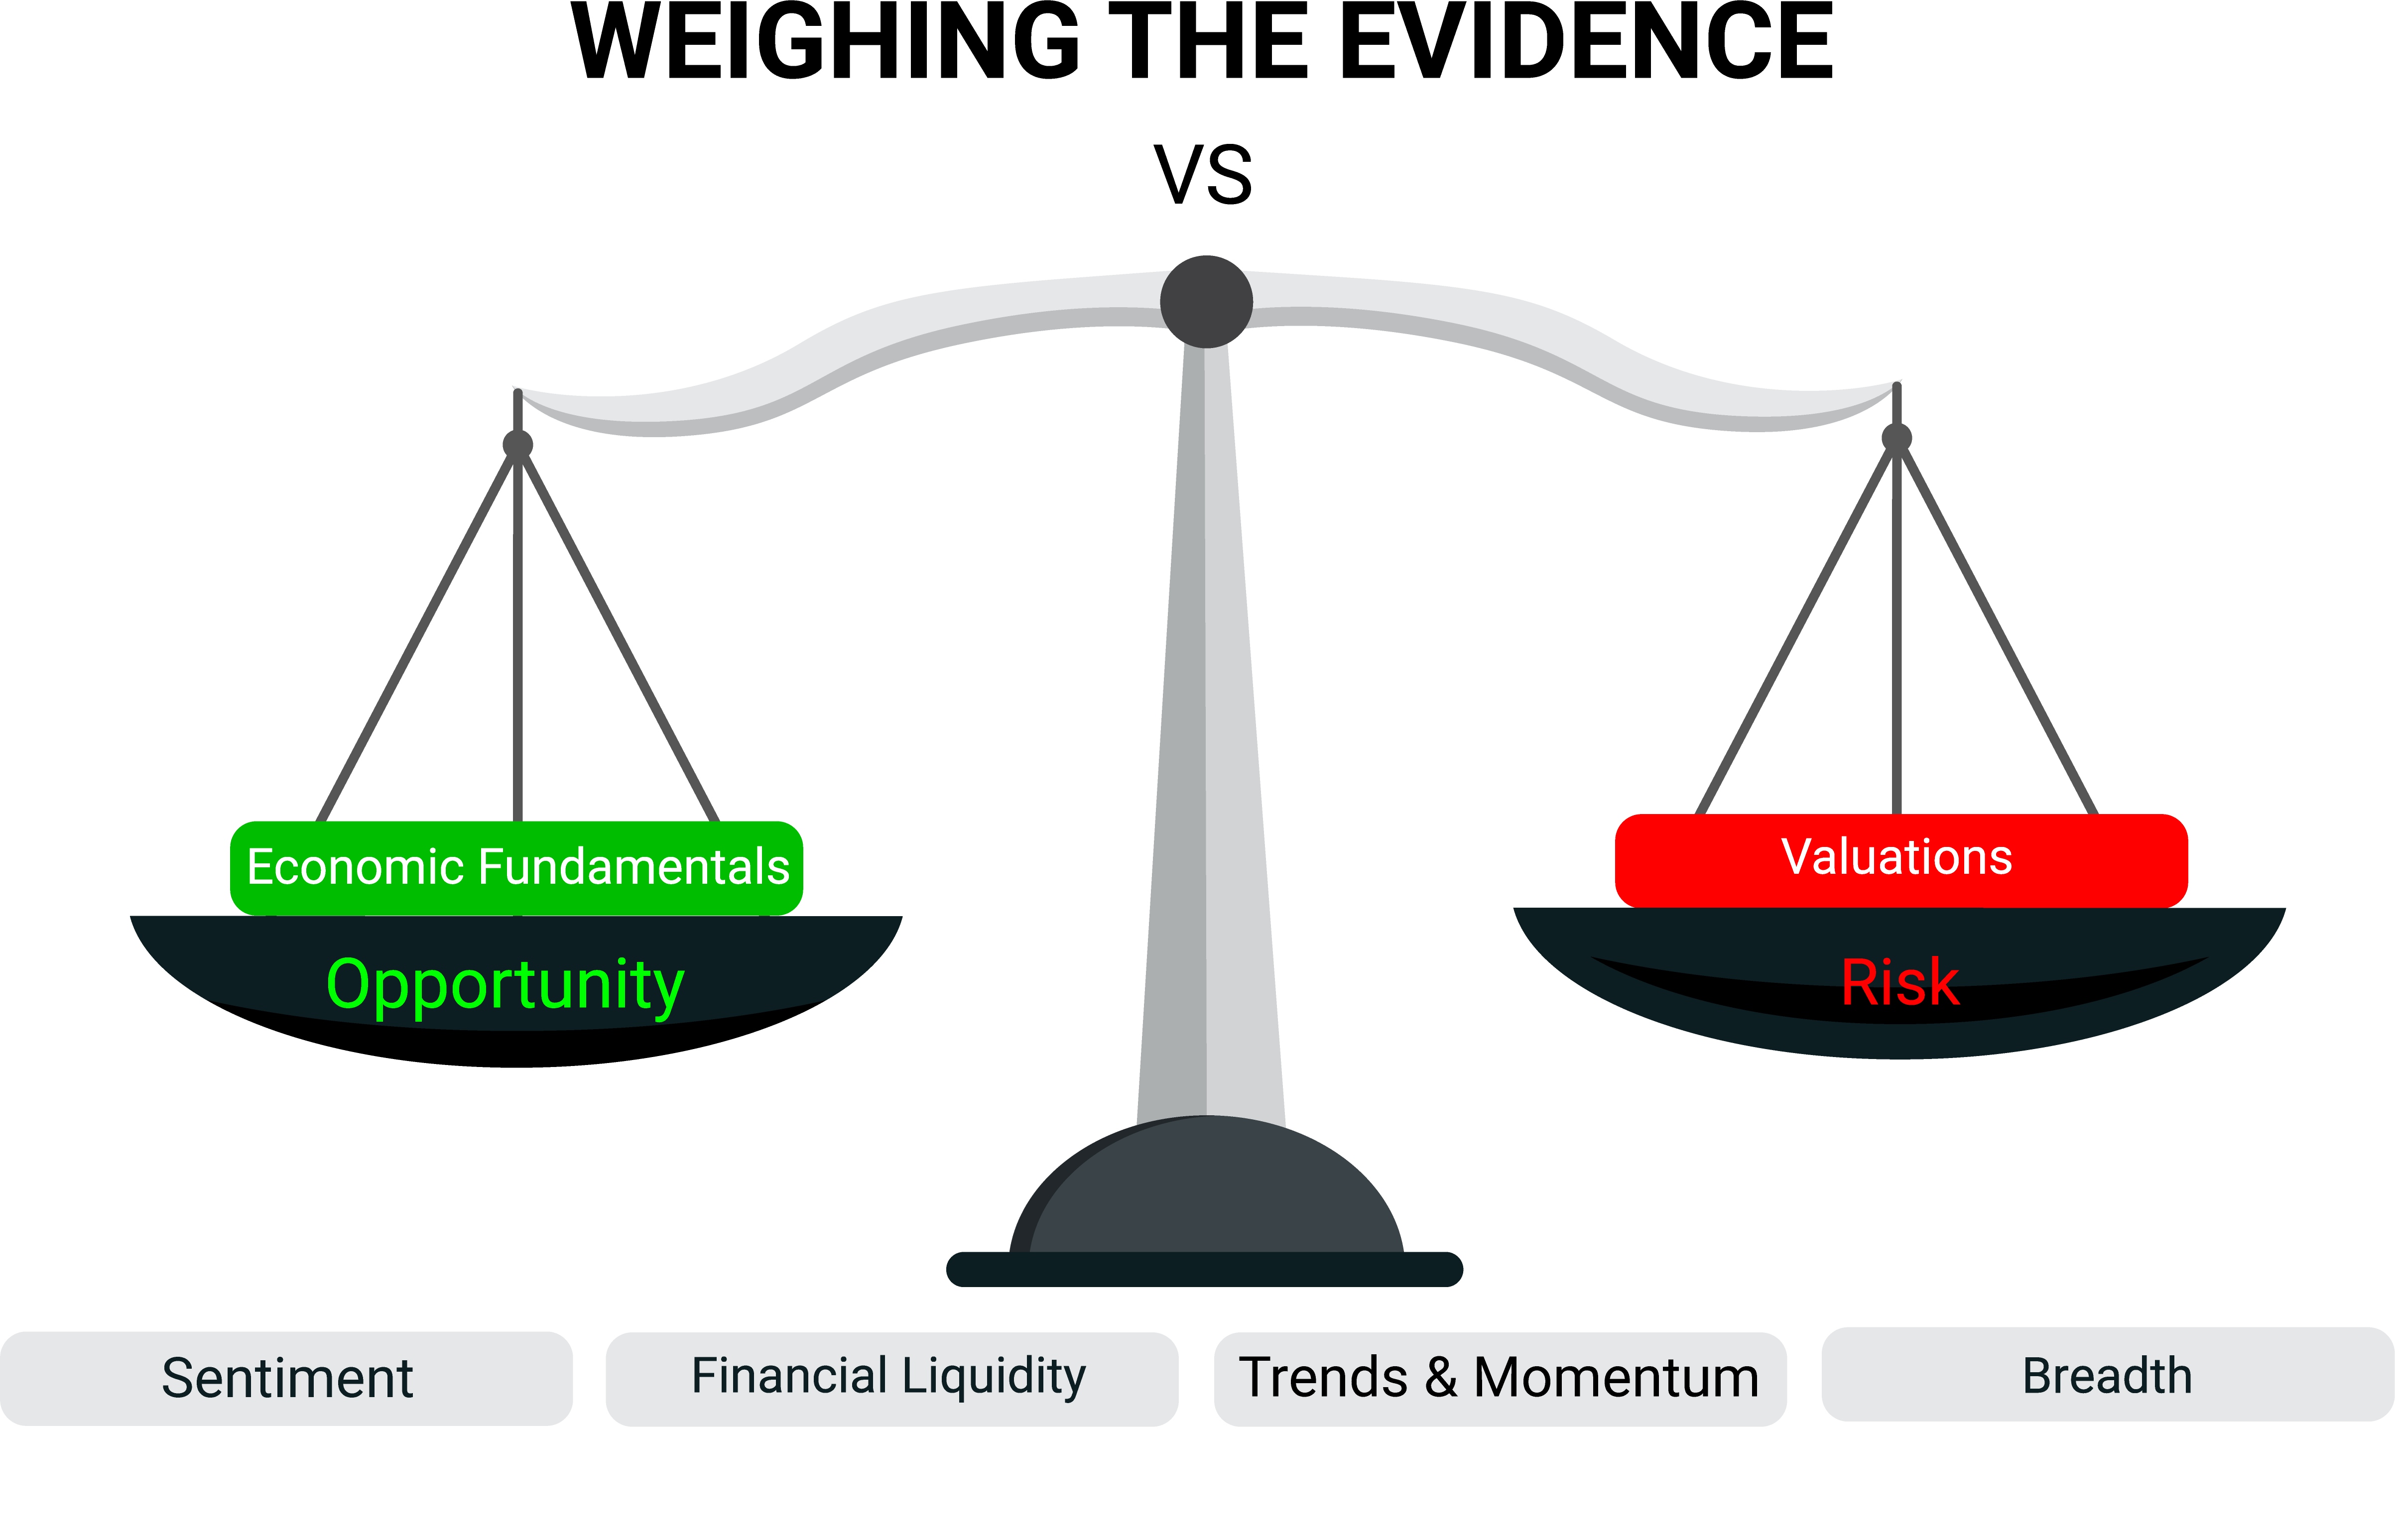
With our latest Weight of the Evidence Dashboard improving and now signaling a neutral stance, we have put cash to work across our portfolios to reflect a more balanced approach.
Expert technical analysis of financial markets by JC Parets
With our latest Weight of the Evidence Dashboard improving and now signaling a neutral stance, we have put cash to work across our portfolios to reflect a more balanced approach.
Key Takeaways:
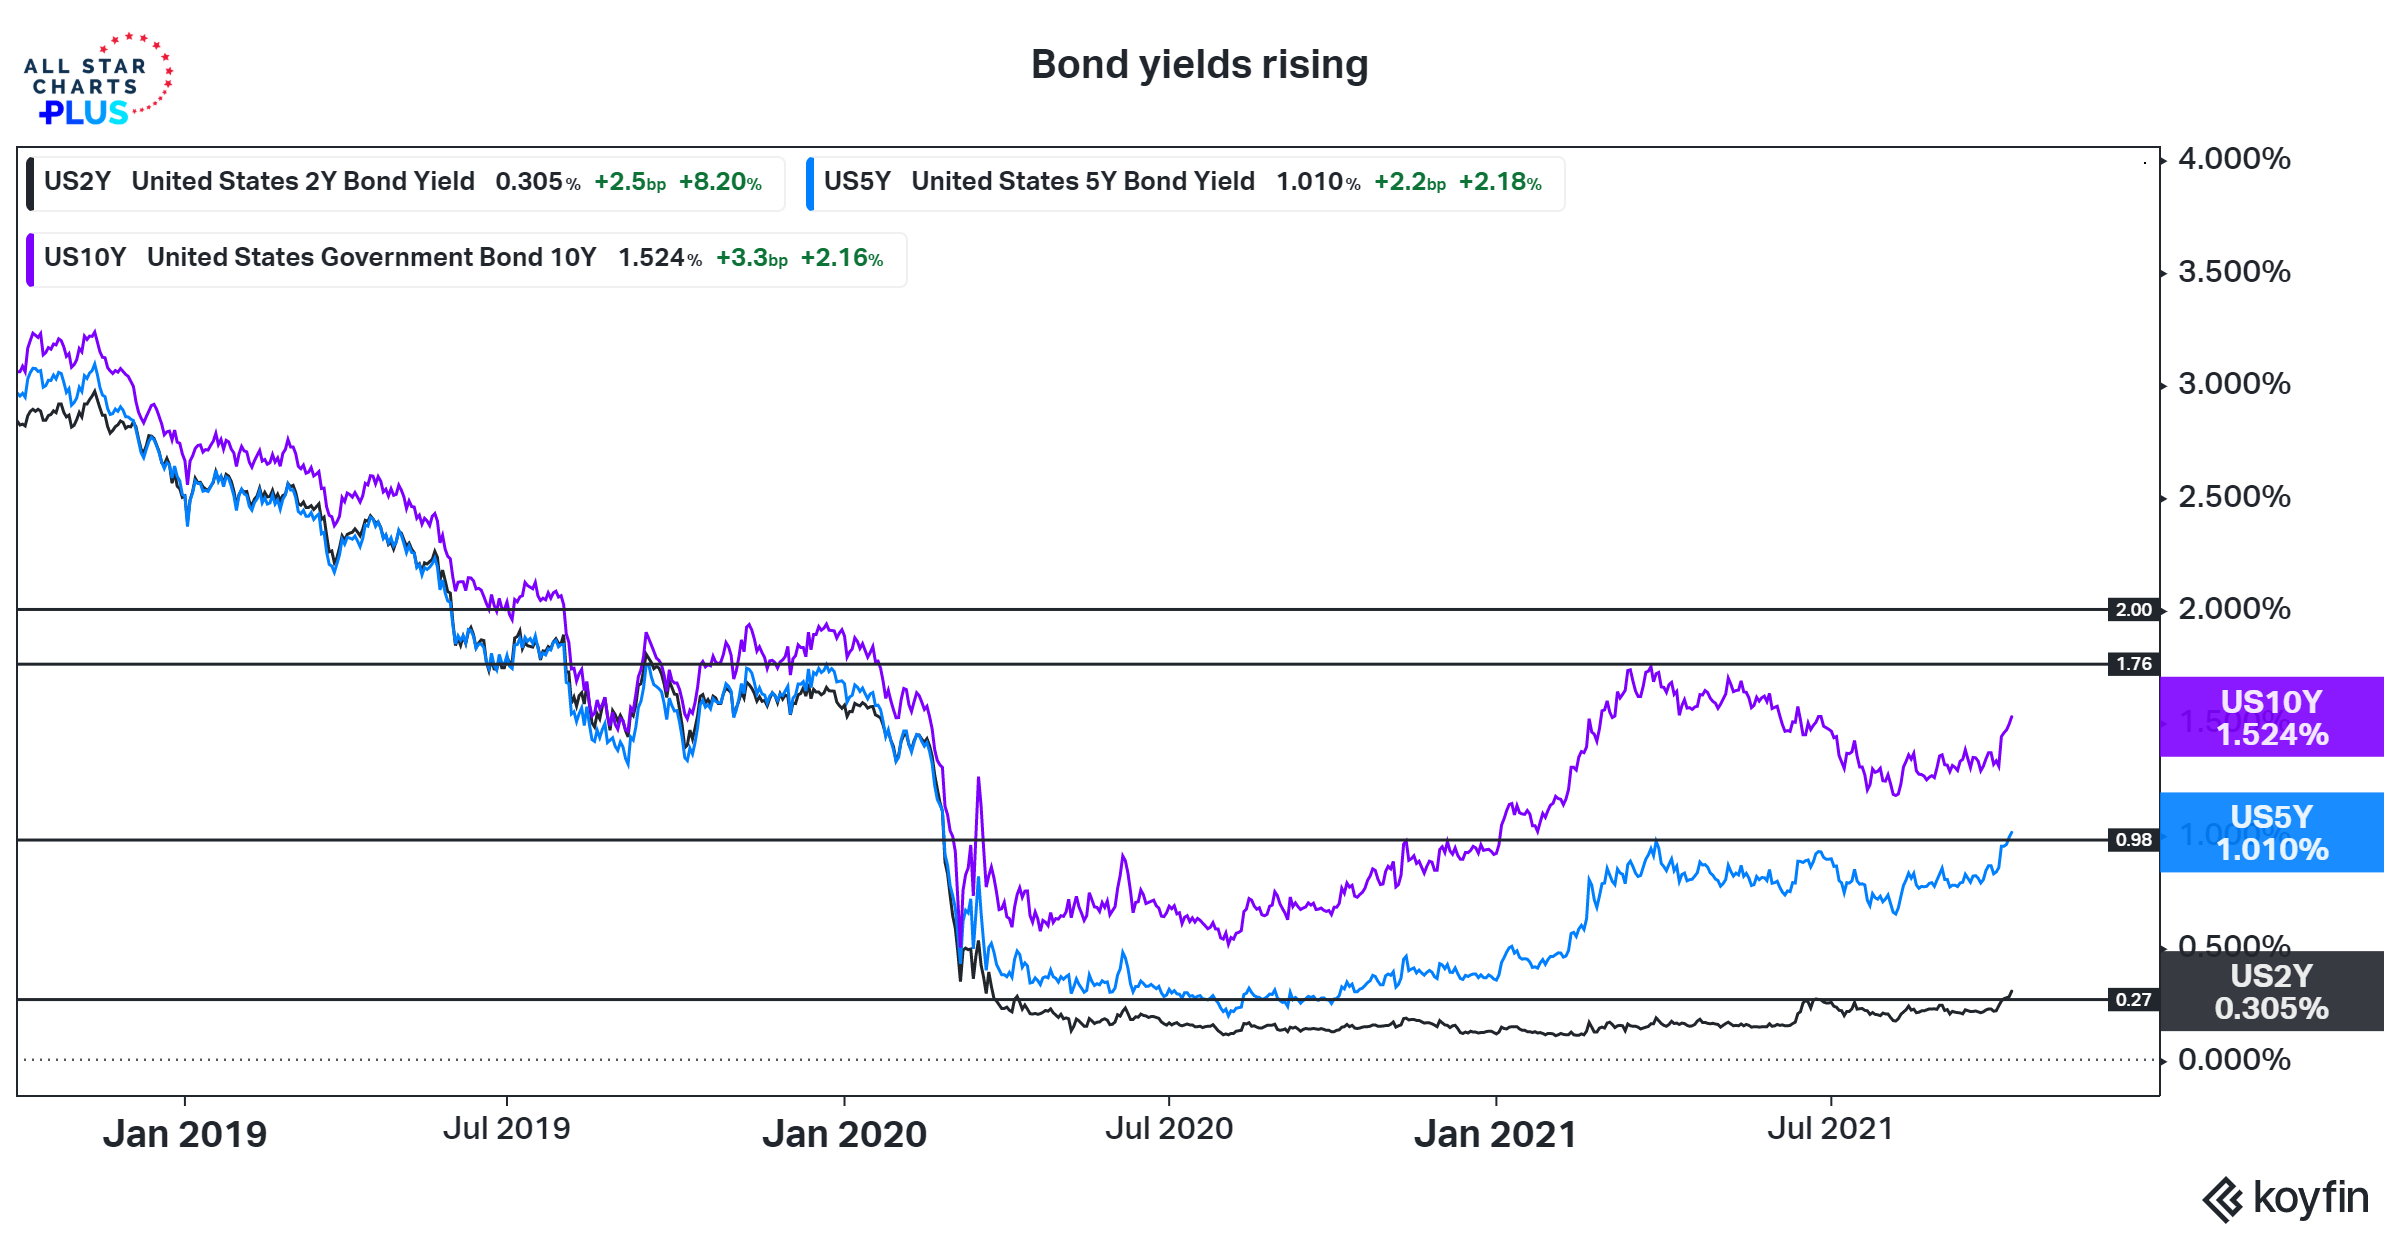
Make no mistake about it, bond yields are rising. Yields on 2-year and 5-year T-Notes have surpassed their 2021 highs and are at levels not seen since their Q1 2020 COVID-related breakdown. The yield on the benchmark 10-year T-Note is above 1.50% and appears headed toward a test of the early 2021 high near 1.75% sooner rather than later.
How high yields could rise in Q4 remains an open question. A two-handle by the end of the year does not seem far-fetched. As recently as 2019, 2’s, 5’s and 10’s all had yields above 2%. With inflation pressures showing little evidence of meaningfully subsiding the path of least resistance for bond yields appears higher.
As we get ready for the final quarter of the year, we need to remember that while guesses are great, we don’t want to get ahead of what is actually happening. Evidence > Assumptions.
When volatility picks up, there can be a natural desire to review and reconsider or reduce all long exposure. This impulse reflects the reality that for many, risk tolerance is higher in periods of strength than in periods of weakness. Our view is that proactive risk management can lead to better outcomes than reactionary decision-making.
That is a major reason why we spend so much time reviewing and discussing the weight of the evidence. We don’t know what the future will hold, but we can increase the odds of looking in the right direction by watching where the wind is blowing. While always open to new information, we do not want to over-react to a situation that has already been accounted for.
Key Takeaways:
As discussed in yesterday’s Market Notes, last week’s rally has us questioning whether we remain in the choppy market that has been experienced on many levels for the past few months or if we are poised for some degree of resolution to the upside. Today, we’ll take a closer look at what that could mean across stocks, bonds and commodities. As market depth evaporates ahead of the Labor Day weekend, there is no reason to believe that what we talk about has to happen this week.
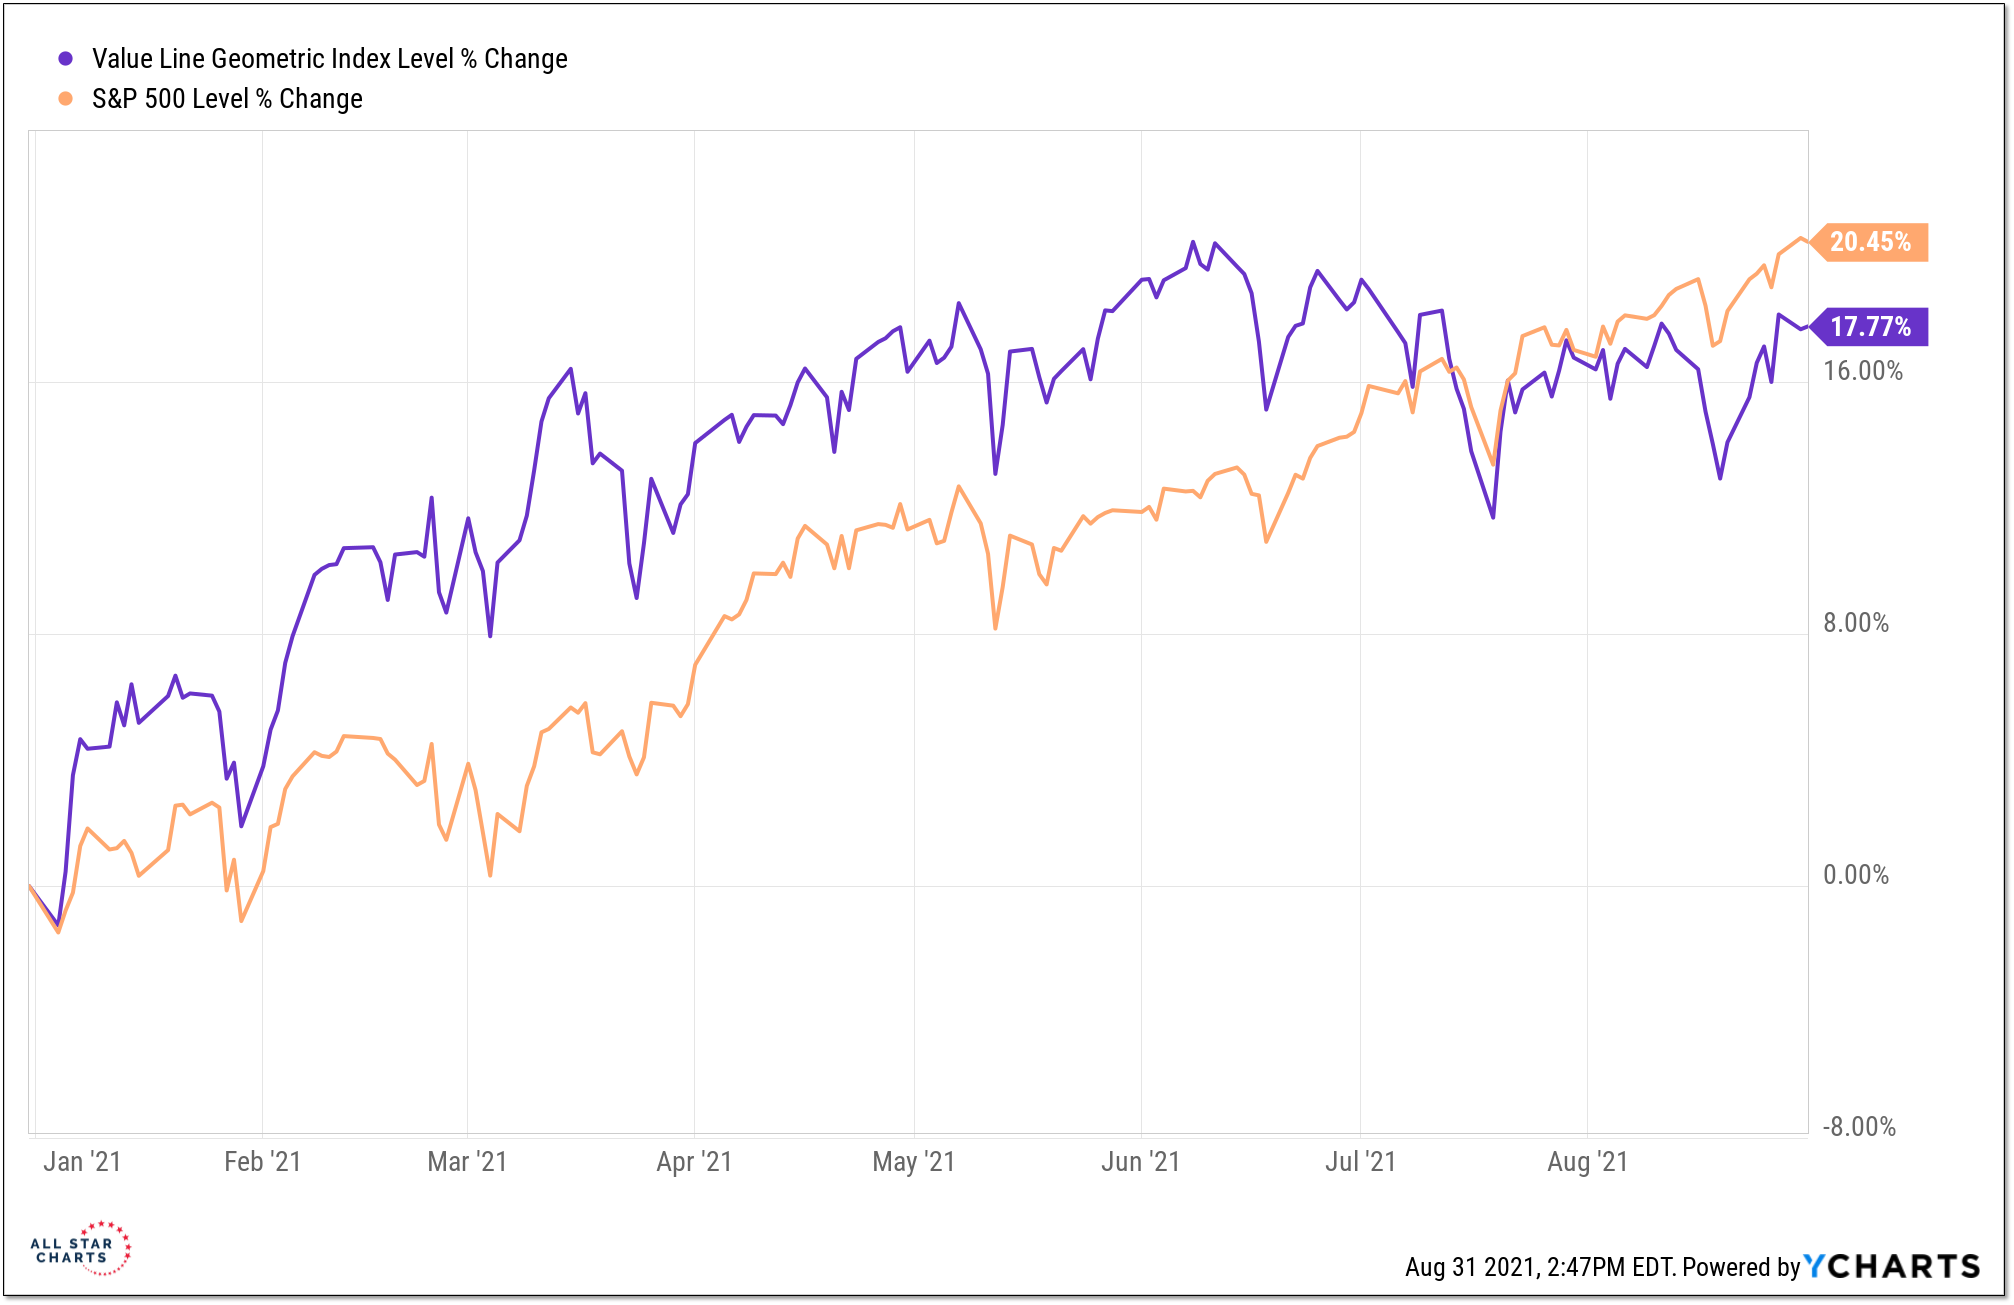
The S&P 500 is getting plenty of press these days for the number of new highs it has made in 2021 (over 50 at this point). I’m more focused, however, on what the Value Line Geometric Index is doing. This index has gone nowhere over the past three months (while the S&P 500 has risen nearly 8%). A new high by this index (and a return to leadership on a YTD basis) would be evidence of the type of broad strength that tends to be sustainable. It’s trying to move in that direction, but there is more work to be done.
Key Takeaways:
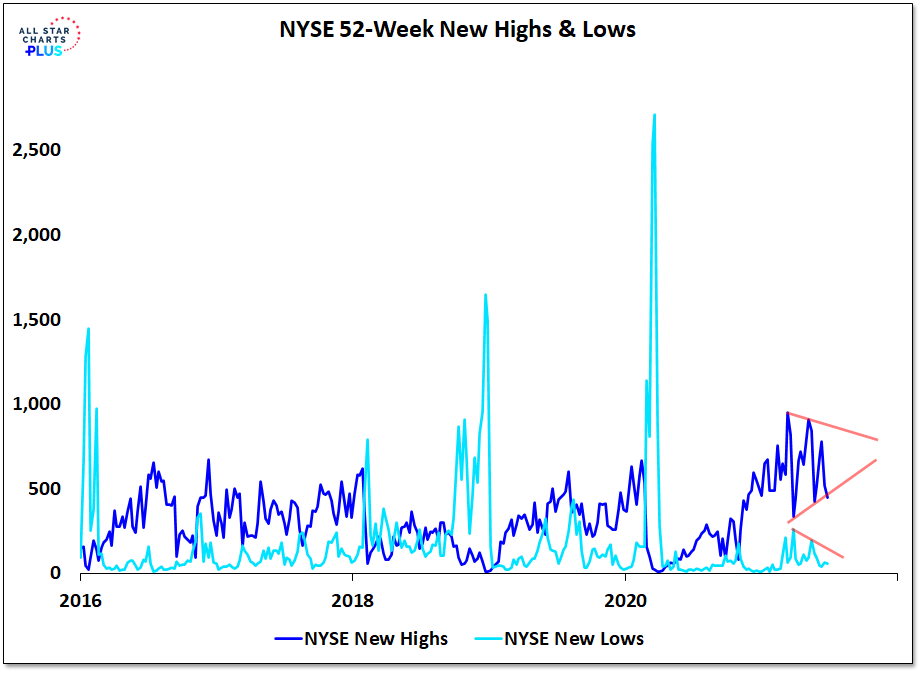
Here in the US, a handful of mega-cap stocks are pushing the indexes to new highs, while beneath the surface many stocks are languishing. The NASDAQ Composite began this week by making a new all-time high, but it was the first time in eight days that there were actually more stocks making new highs than were making new lows. The S&P 500 is trading in record territory, while nearly 40% of its stocks aren’t even above their 50-day averages.
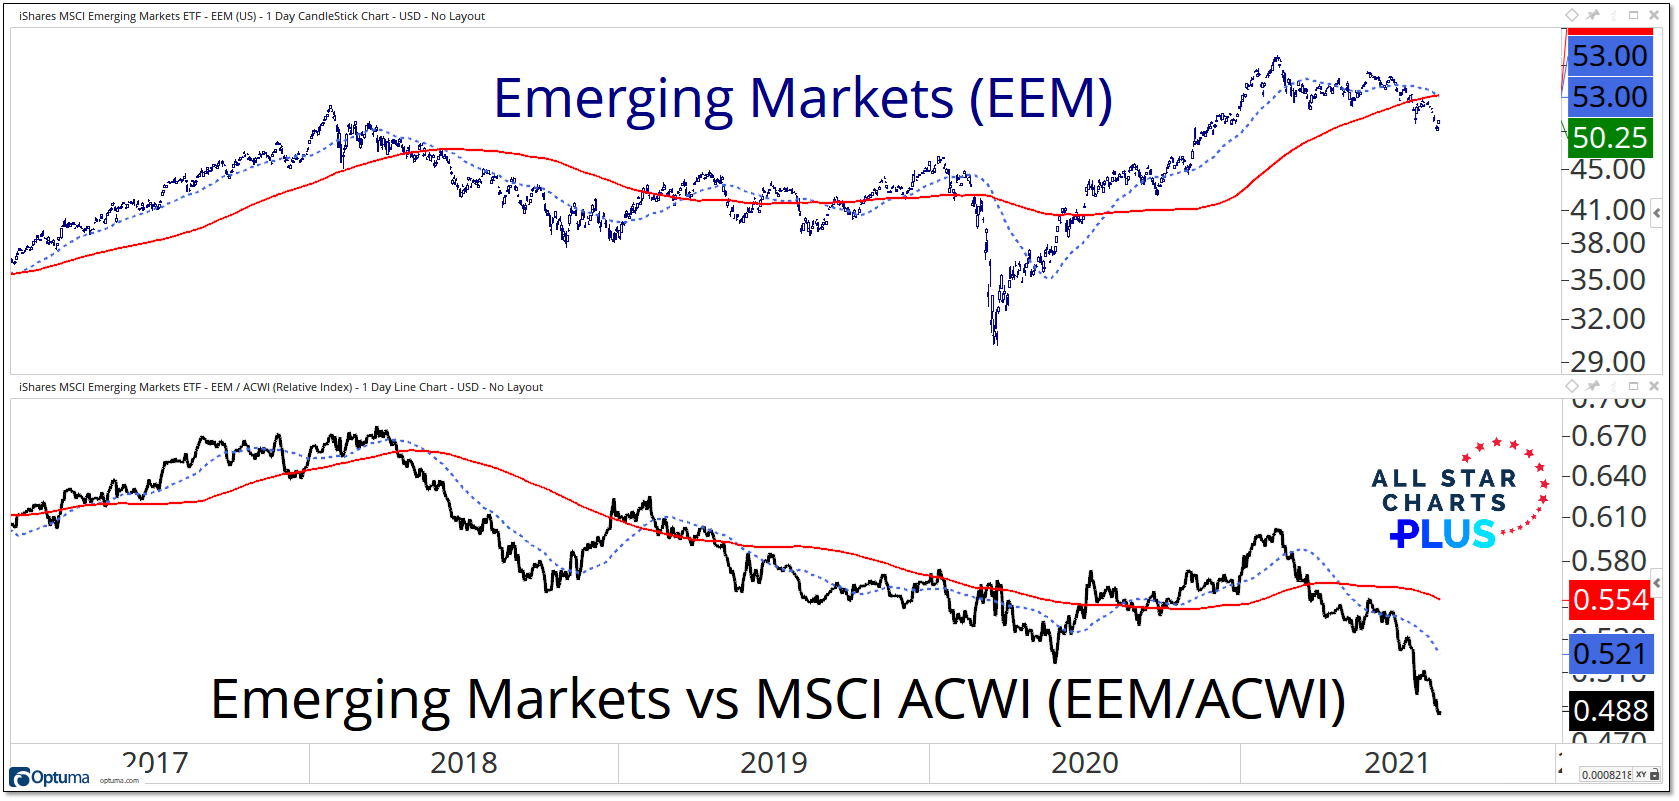
When we look overseas, what’s happening in Emerging Markets is the inverse of what we’re seeing within the US indexes. For EM, the weakness is at the top, in the countries that make up the largest weightings within the EM indexes. China accounts for more than a fifth of the weighting in EM indexes and is down nearly 15% over the past six weeks. India is the only country among the top six in the index that’s up over the past six weeks. Overall, EM has fallen 7% in that time period, moving into negative territory for the year and making new lows versus the rest of the world.
Most markets are holding up better than EM indexes would suggest. The median Emerging Market is down less than 1% over the past six weeks. During that same period, the median Developed Market is basically flat. For as weak as the Emerging Markets in the Asia-Pacific region have been, those in Europe and the Middle East have been even stronger. Seven of the top 11 markets (across EM and DM) over the past six weeks have been Emerging Markets in the EMEA region, which overall have a median return of 4.7%, the best within our regional breakdown across EM and DM. Our ACWI relative strength rankings help identify leadership trends by country. While we’re discussing negative divergences from a breadth perspective at home, we’re seeing positive breadth divergences in Emerging Markets. China has found a bid to begin the week. Strong EM breadth could provide it with a strong foundation on which to build a sustained rally.
Key Takeaways:
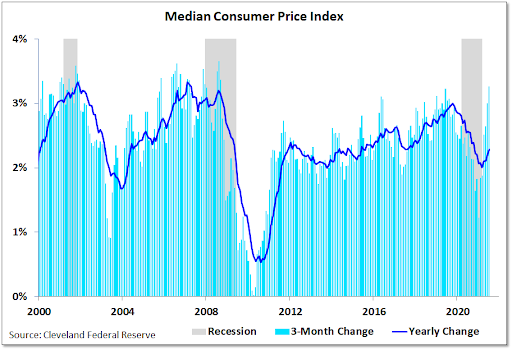
With inflation, first it shocks you then it sneaks up on you. That is the way it has played out in 2021. This Spring, when the yearly inflation numbers started to heat up, newspapers ran banner headlines announcing the news and inflation-related Google searches exploded. In the months since, inflation has moved out of the headlines and searches related to it have fallen. What has shown little sign of letting up is inflation itself.
In the latest round of inflation report (for data through July) there was some easing in some niche inflation components (e.g. used car prices) but the overall trend remains higher. The three-month change in the median CPI, which by definition is not influenced by outliers on either end of the distribution, has risen to its highest level in over a decade and the yearly change (which itself was at the highest level in a decade prior to COVID) is re-accelerating. The narratives have shifted from there is no inflation to its here but transitory to its not transitory but its a net positive. The reality is that it is not a positive (for the economy or the market), it is persistent, and after bottoming over a decade ago we are now seeing a meaningful acceleration.
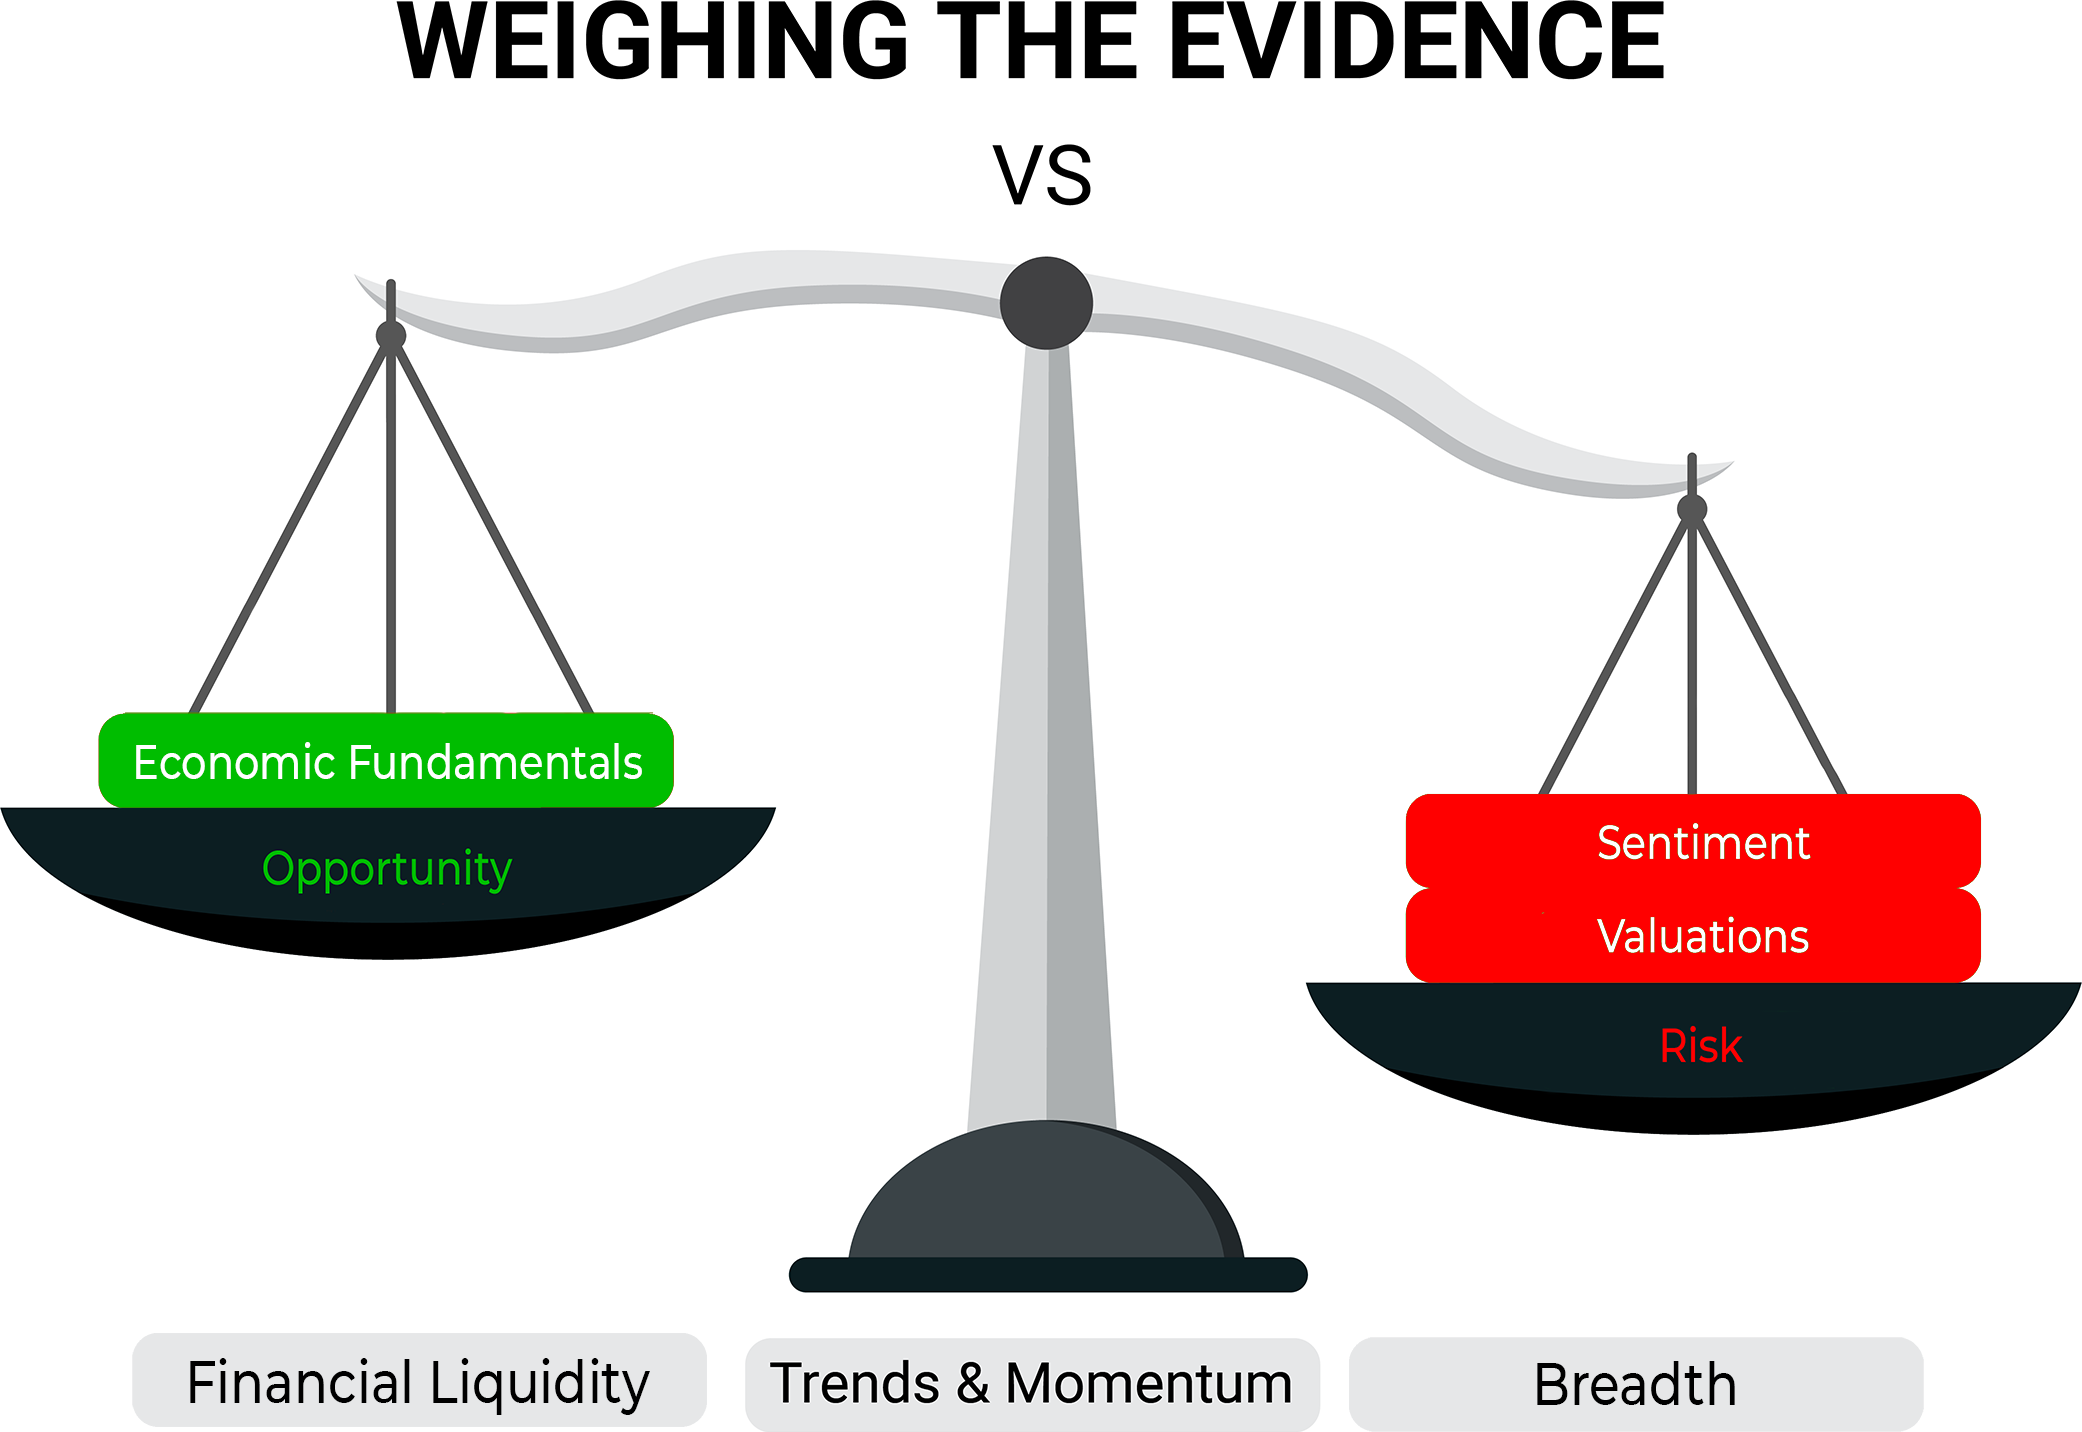
The divergences between what has been seen in the popular averages and what is happening beneath the surface have become significant enough that we have moved breadth to neutral in our weight of the evidence framework. This leaves the scales tilted away from opportunity and toward risk.
The most recent breadth thrust regime expired in early June and since then the percentage of global markets trading above their 50-day averages has fallen from the upper 80’s to now just 20%. One-third of the markets are not even above their 200-day averages. US industry group trends have also faltered. The percentage trading above their 10-week averages is breaking down while the percentage making new 13-week lows is breaking out.
As 2021 began, the strong trends that emerged in 2020 were intact. But as we get ready to make the turn to the second half, we find ourselves looking at a muddled mess of stalled out trends and conflicting signals. How these resolve will go a long way toward dictating the paths that the market and the economy take over the second half of the year.
The NASDAQ and S&P 500 have continued their foray into record territory, but find themselves without much support. Take this week for example. New highs in the indexes on Monday & Tuesday came with a continued contraction in NYSE & NASDAQ new highs and more stocks declining than advancing on the S&P 500. The lack of strength has been noteworthy, but so too has been the lack of weakness. We are seeing lower highs in terms of new lows as well as higher lows in terms of new highs. Even on a shorter time frame, weakness has not gained traction. We’ve seen spikes in new 21-day lows but they have not made their way to the new 63-day low lists.