This is the video recording of the June 30th Weekly Town Hall w/ Willie Delwiche.
06/30/22 2:00 PM ET [Read more…]
Expert technical analysis of financial markets by JC Parets
This is the video recording of the June 30th Weekly Town Hall w/ Willie Delwiche.
06/30/22 2:00 PM ET [Read more…]
From the desk of Willie Delwiche.
Earlier this week, I laid out some similarities between now and 2008. From a price, liquidity, breadth and sentiment perspective, the echoes are there.
The comparisons keep popping up.
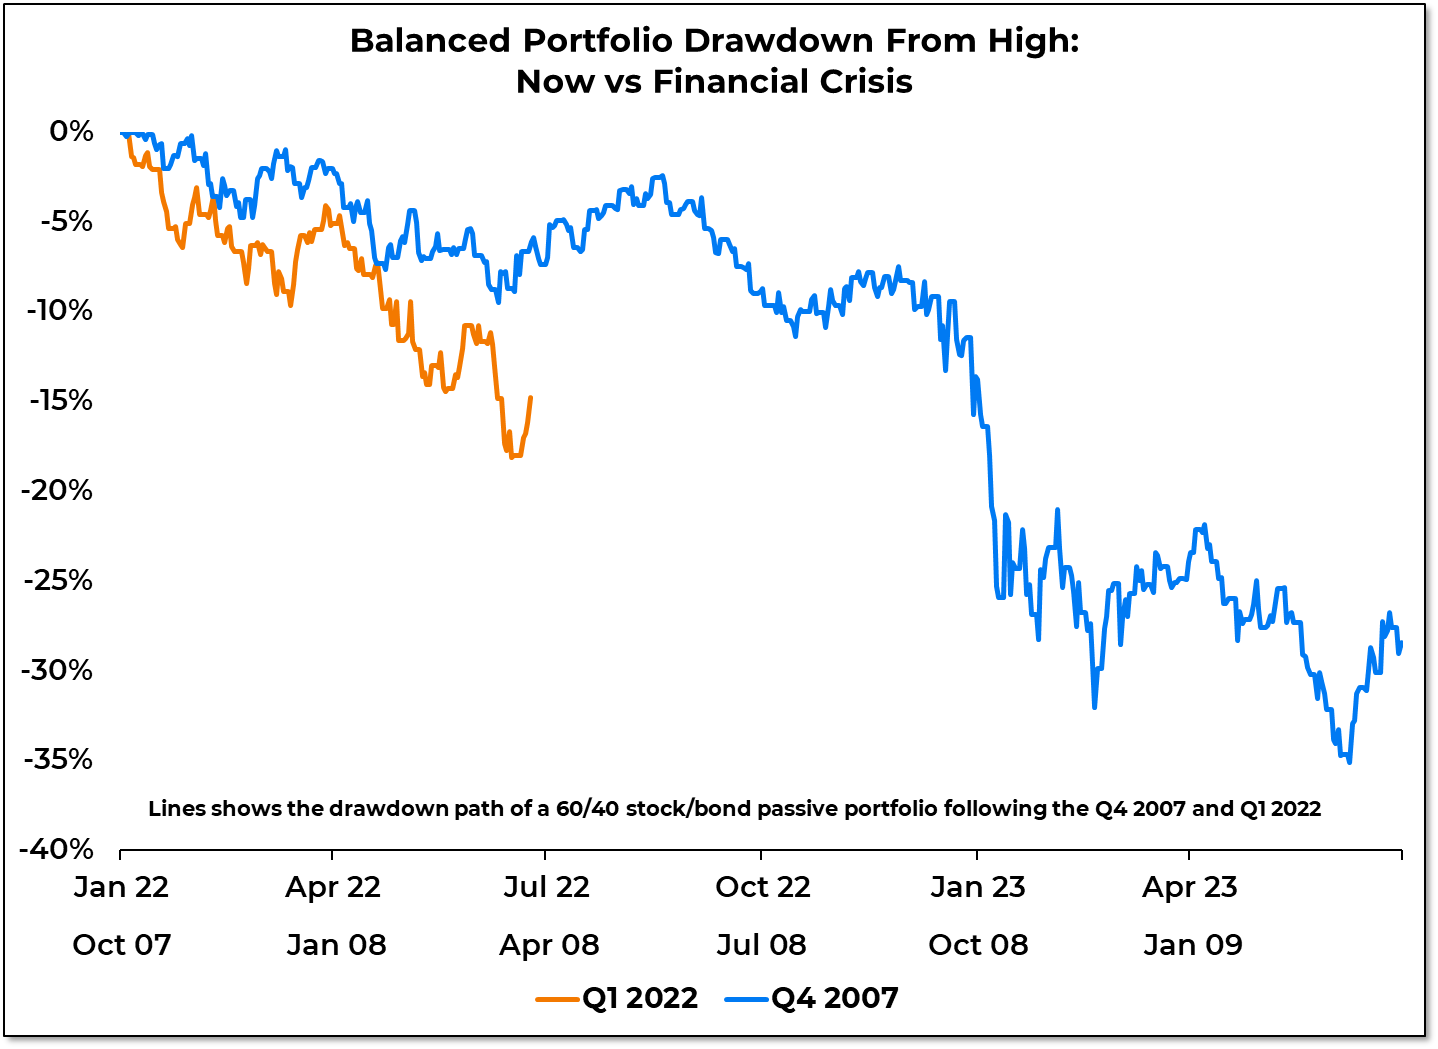
A couple of days ago, there was a chart showing that the ongoing decline in equity market value (relative to GDP) exceeds any other drawdown in the past 40 years with the exception of what was experienced during the Financial Crisis.
Today, it’s data from Gallup showing economic confidence is at levels only seen in 2008-2009.
I’m not saying that the market and the economy need to follow the course laid out in the wake of the Q4 2007 highs. But the more similarities we see, the more worthy it is of consideration. Put another way, until bulls provide proof that we are not following that path, it would be foolish (and perhaps expensive) to ignore it as a possibility. Don’t discount reality because it doesn’t fit with the narrative.
From the desk of Willie Delwiche.
Key Takeaway: With pessimism at levels that elicit comparisons to the financial crisis, conditions are set for a meaningful bounce in equities. But at this point, the similarities appear closer to what prevailed in the first half of 2008 than what was seen as stocks moved toward their final lows in March 2009. With the NYSE and NASDAQ still seeing more new lows than new highs (31 weeks and counting) and breadth thrusts conspicuously absent, the backdrop offers little about which to get excited. Recent leaders are experiencing newfound weakness and new leaders are more defensive in nature. Investors have endured a succession of failed rallies in recent months, but that patience may wear thin. The burden of proof is on the bulls. Rally attempts that increase hope but offer little strength would fit the pattern seen during the financial crisis
Sentiment Report Chart of the Week: Mixed Messages From Bonds
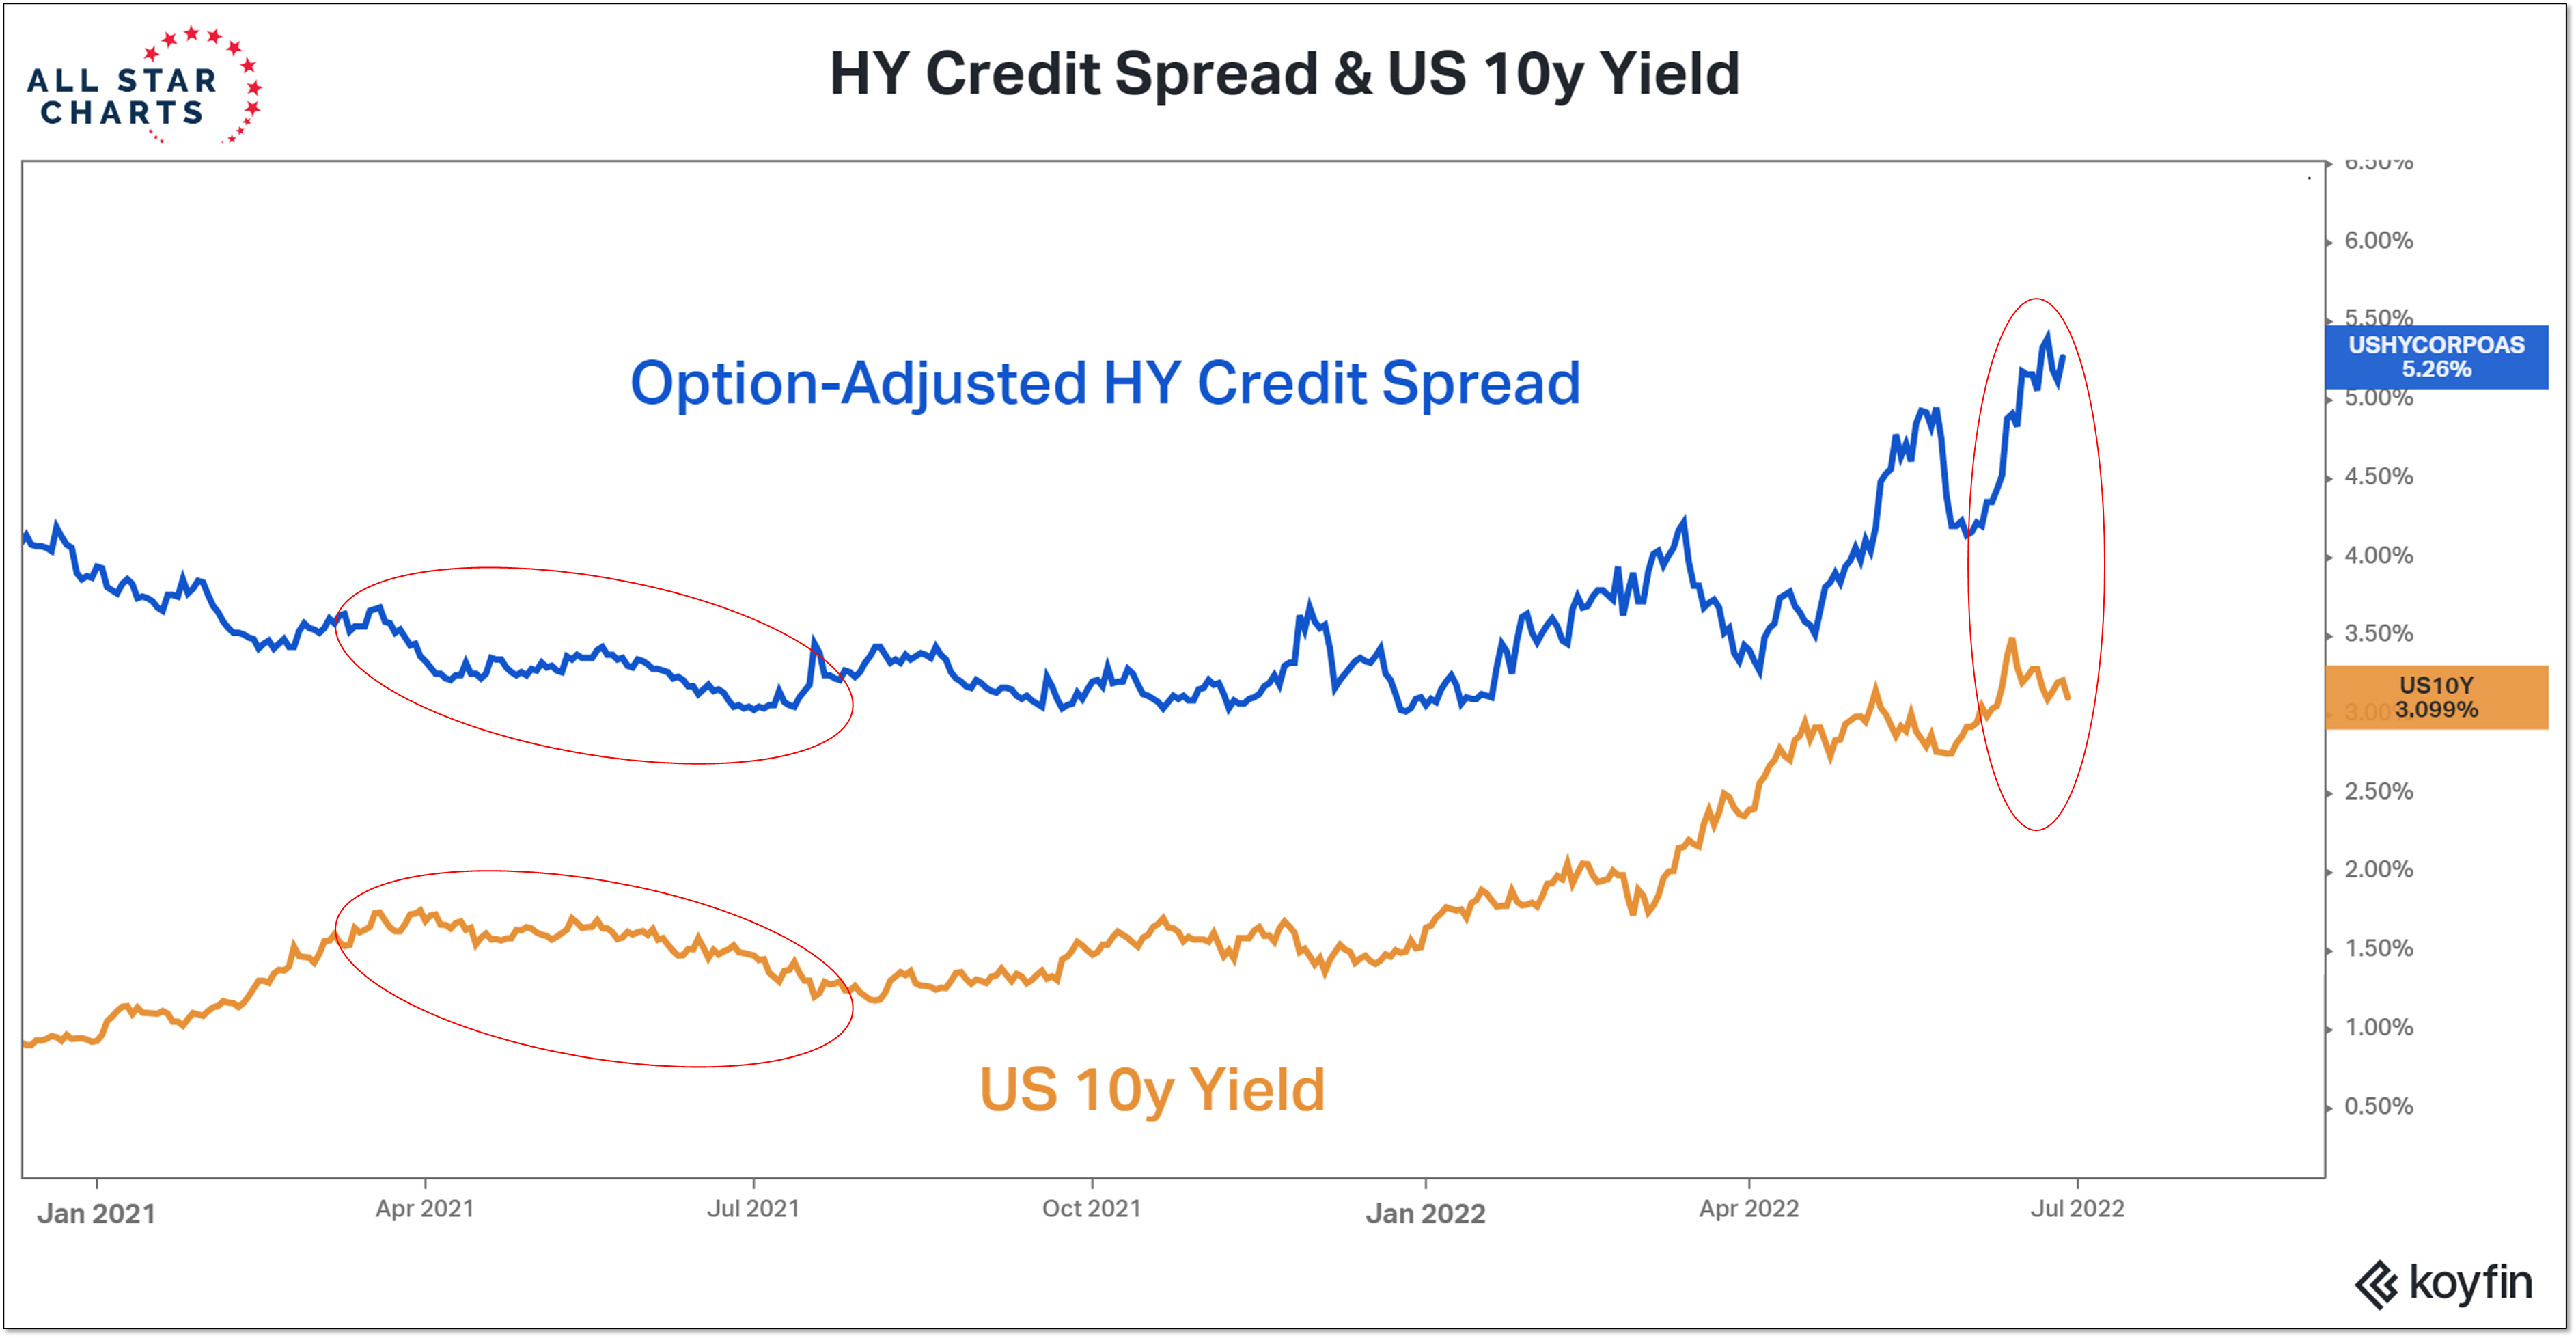
It’s been a rough first half for bonds. For now at least, Treasury yields have stopped crashing. When Treasury yields stopped rising and started to move lower in the first half of 2021, investor moods improved and risk appetites increased. Back then, however, lower Treasury yields were accompanied by narrowing credit spreads. Now, while Treasury yields have pulled back from their highest levels in over a decade, High Yield spreads are climbing to levels not seen since the COVID crisis. Junk bond ETF’s are trading at their lowest levels in more than two years. In this scenario, lower Treasury yields might not be a green light for growth areas of the market, but a move to safety that could include a re-evaluation of overall equity exposure (of which households have historically high levels) and/or an increased preference for defensive areas of the market.
Identifying recessions is an academic exercise for historians. It usually requires the passage of time to gain the necessary perspective. The December 2007 business cycle peak was not identified as such (by the NBER) until December 2008. While June 2009 would eventually be identified as the business cycle trough, NBER did not make this determination until September 2010.
For those allocating capital in real-time, this becomes more than just an academic discussion. Whether the economy is in recession or not can impact the length and severity of bear markets. Bear markets that occur independent of recession tend to last 7 months, with an average peak-to-trough drawdown of 23%. If there is a recession involved, bear markets tend to last for well over a year and the average pullback is 33%. The recession question was a hotly debated topic in early 2008 and there are certainly echoes of those conversations now.
The Fed and other central banks are still aggressively raising rates even as growth slows dramatically. Manufacturing and New Orders indexes from the Richmond Fed (showing activity for June) are at levels never seen outside of recessions. Time will tell whether the NBER eventually labels this environment a recession – but incoming data and financial market activity suggest that’s becoming more likely.

Key Takeaway:
At this point, we cannot know whether the current environment will ultimately end up bearing more than a passing resemblance to the 2008/09 financial crisis. There are, however, enough similarities between now and then that the comparison is worth considering.
Consider what we are seeing from a price perspective and across a handful of other indicators:
Price: Failed rallies have been followed by lower lows on the S&P 500 since the index peaked in January of this year. A similar pattern developed following the market peak in October 2007. The damage done to a 60-40 passive portfolio has been greater this year than at a similar post-peak point during the financial crisis, but it’s perhaps not a coincidence that prior to this year, the only time in the past quarter century that both stocks and bonds were underwater in back-to-back quarters was in 2008.
Liquidity: Currently more than three-quarters of all global central banks are raising rates. The last time equities contended with a globally coordinated tightening cycle of this magnitude were in the years leading up to the financial crisis.The current upward momentum in corporate bond yields has been seen in just one prior period in the past 40 years. The fall of 2008. Downward pressure on equities did not abate until after bond yield momentum had peaked and central banks had moved into easing mode.
Breadth: Despite impressive index level gains last week, every day had more stocks making new 52-week lows than new 52-week highs on the NYSE+NASDAQ. The 31 weeks in a row of more new lows than new highs (stretching back to Nov 2021) is the second longest such stretch in the past 40 years, eclipsed only by the 45 week stretch from May 2008 to Apr 2009. Rally attempts in early 2008 failed to produce breadth thrusts and, so far at least, that has been the case in 2022.
Sentiment: Bull-bear spreads on the AAII and Investors Intelligence surveys, as well as the NAAIM exposure index, are strikingly similar to the levels seen in Q1 2008. Earnings estimates were moving lower in early 2008 and that is the case currently as well.
As strong as stocks appeared last week, precious little was done to disrupt the trend or argue in favor of the emergence of a persistent rally. We will watch both our bull market re-birth checklist and tactical risk management models for evidence that this is changing, but the burden of proof at this point is on the bulls. Given the similarities to the past and risks in the present, we need signs of strength at this point, not merely hope in the continued absence of weakness.
From the desk of Willie Delwiche.
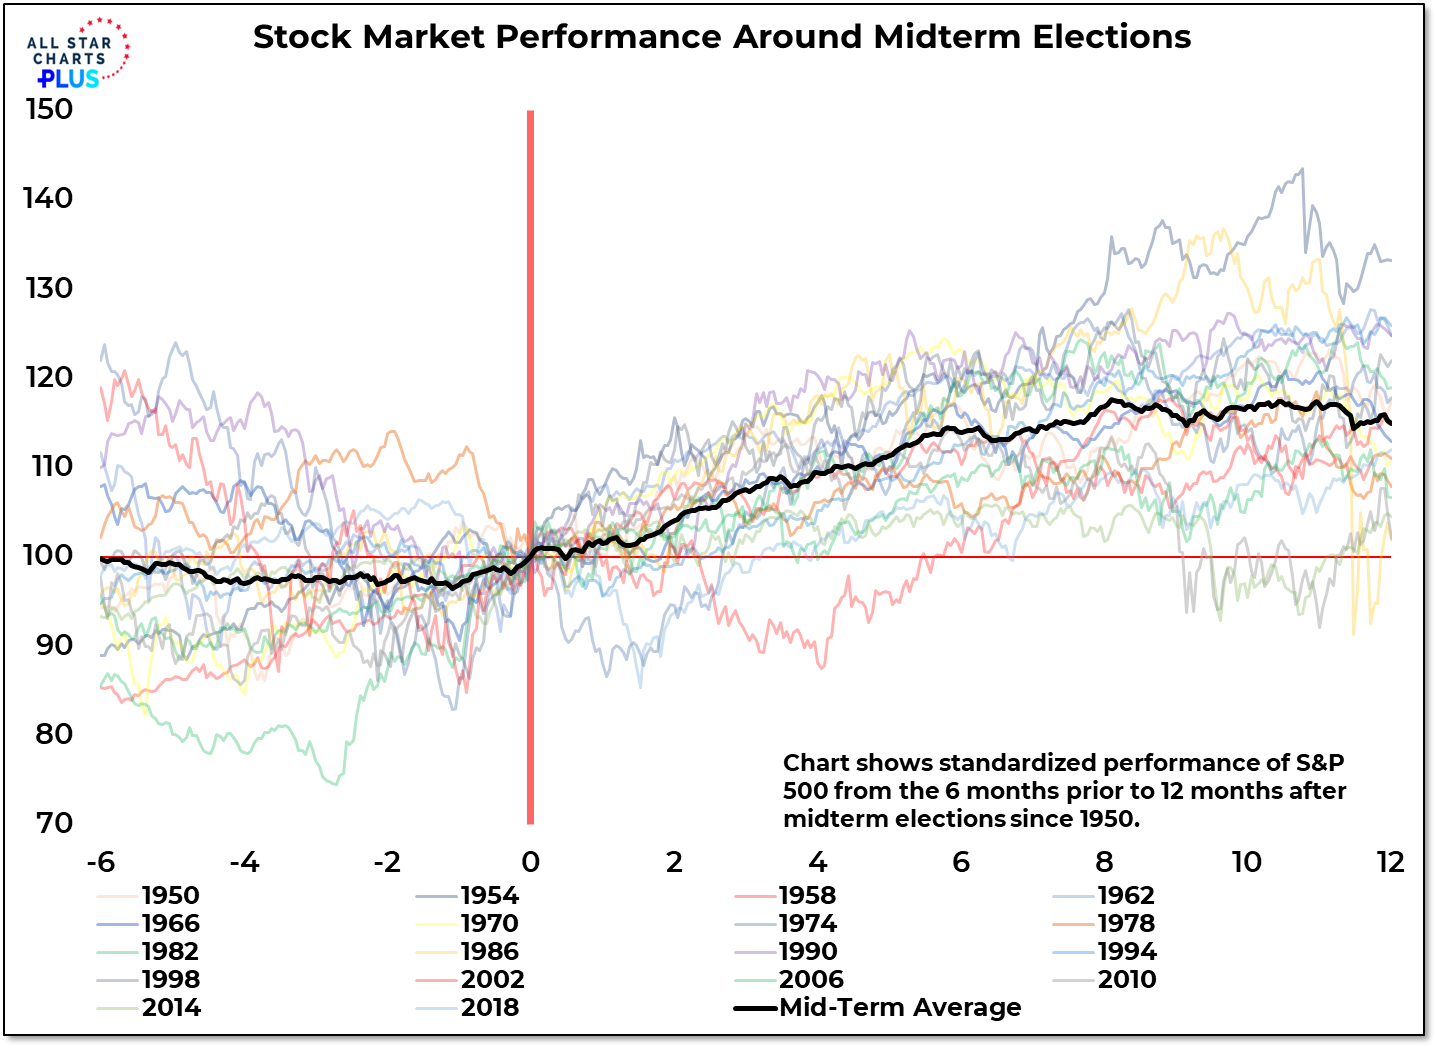
This is a good time to think about what could happen after the midterms because the run-up to this fall’s elections could be almost unbearable. The Fed, the Supreme Court and lingering fights over the 2020 election will provide candidates of all stripes with plenty of political fodder. The public mood is already dour and an onslaught of negative ads is not likely to help. History and conventional wisdom suggest stocks could struggle for traction over the summer, find a low prior to the election and then rally as the outcome becomes evident. The S&P 500 has been higher 12 months after every single mid-term election since at least 1950. The problem with that information is that it is being widely discussed. The data is what it is and the past is all we have to go on. Nonetheless, the words of Bernard Baruch seem relevant right now: “Something that everyone knows isn’t worth anything.”
An alternative view is that the pattern of the S&P 500 since its early year peak is not dissimilar to what was seen after its October 2007. If that period is a roadmap for now (and there are enough similarities for me to not immediately discount the possibility) the S&P 500 could rally off and on into mid August before resuming its downtrend as we move to and through the midterm elections. That pattern would catch many off guard. It’s up to the bulls to prove that it is not a likely path.
This is the video recording of the June 23rd Weekly Town Hall w/ Willie Delwiche.
06/23/22 2:00 PM ET [Read more…]
From the desk of Willie Delwiche.
Monday was an unexpected break. Markets were closed for Juneteenth Day, which is now a Federal holiday. I didn’t realize that would be the case until the middle of last week. It has made for a short week in the market after a long weekend for doing whatever it is you do to get refreshed after staring at computer screens all day. For me, it meant more time in the garden.
The garden has provided its own share of unexpected developments recently, and I’m not just talking about volunteer cantaloupes (though there are several of them around).
In the pond, a spike in ammonia levels necessitated an overdue and unexpectedly extensive cleaning. Not only is it now a healthier environment in which the fish can thrive, but in the process we discovered a baby fish that we hadn’t known about.