This is the video recording of the July 21, 2022, Weekly Town Hall w/ Willie Delwiche.
07/21/22 2:00 PM ET [Read more…]
Expert technical analysis of financial markets by JC Parets
This is the video recording of the July 21, 2022, Weekly Town Hall w/ Willie Delwiche.
07/21/22 2:00 PM ET [Read more…]
From the desk of Willie Delwiche.
The world is an uncertain place.
But that doesn’t make it altogether random. Trends persist – right up until the point that they don’t. If we’re going to move beyond irrefutable narratives and successfully navigate reality, we need to develop feedback mechanisms that can keep us on the right path (and get us back on the path when we stumble into the weeds).
Operating in the world as it is and not as we would like it to be requires an ability to test viewpoints, an awareness that sometimes the ground shifts beneath our feet and a willingness to consider scenarios from both directions.
From the desk of Willie Delwiche.
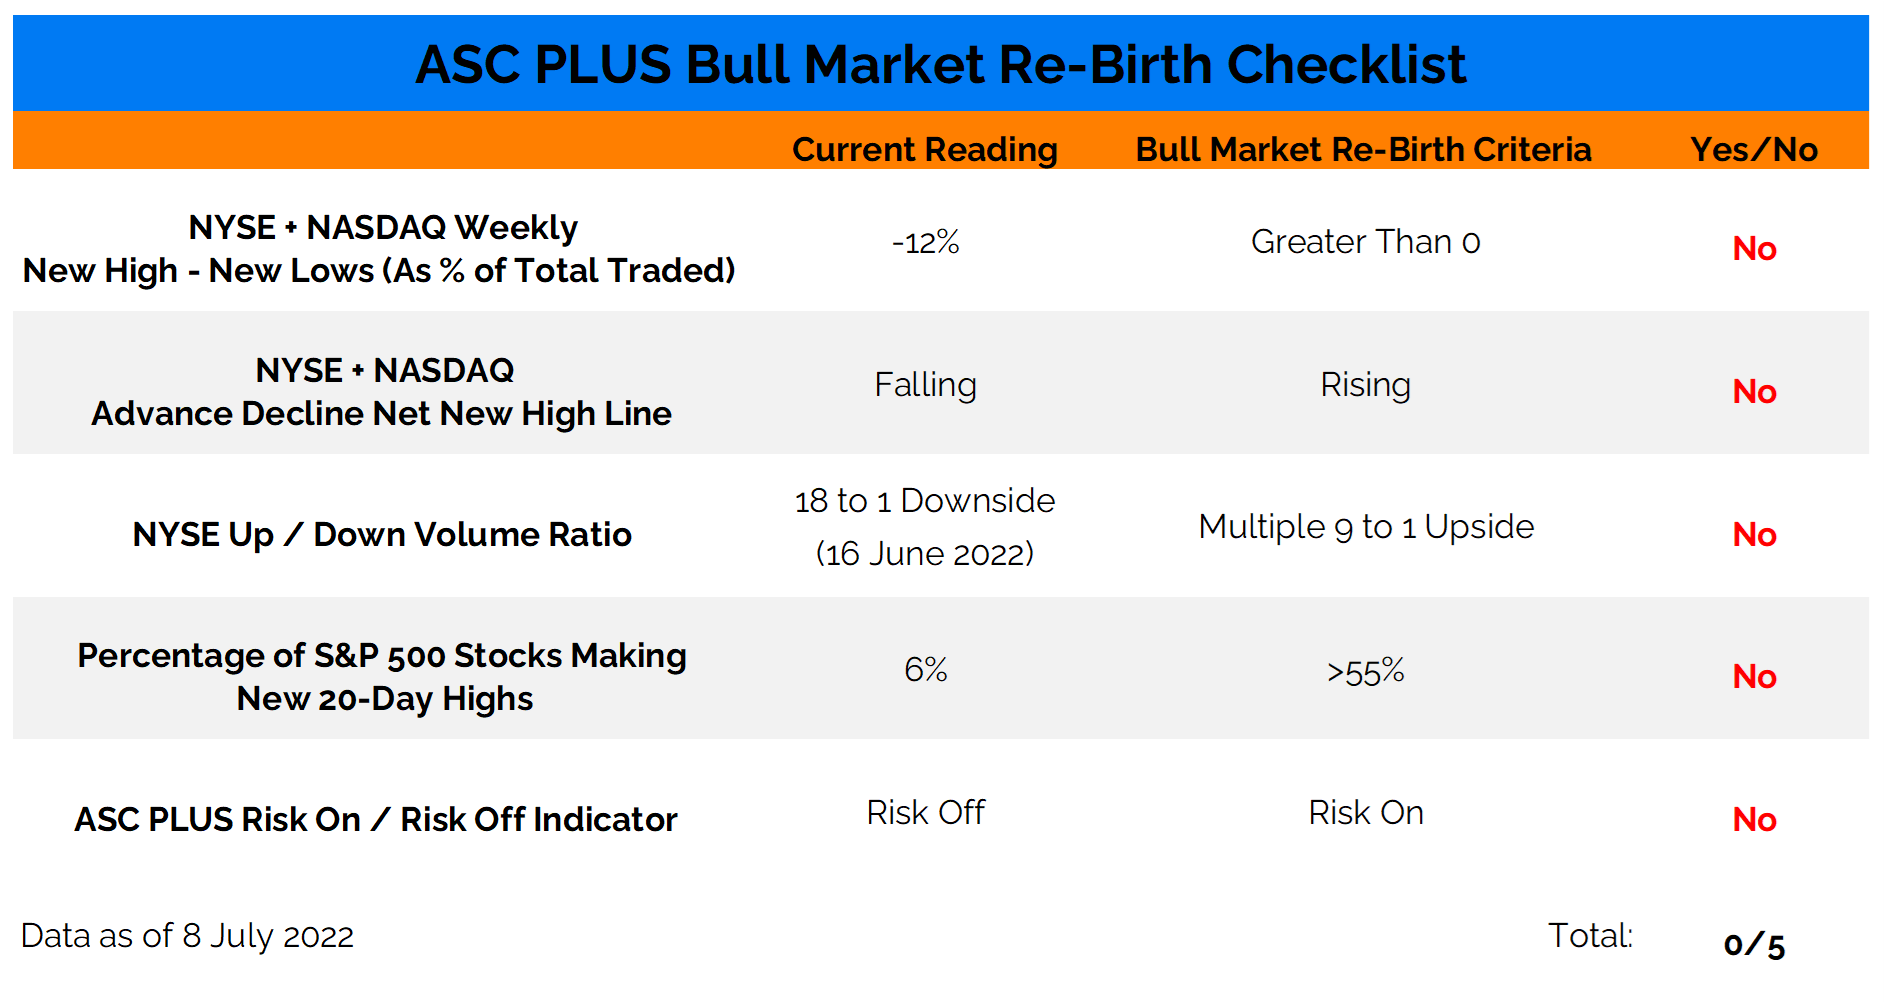
Key Takeaway: It’s been bears on parade all year, starting with significantly less optimism coming into this year than was seen at the beginning of 2021 or 2020 and continuing through lengthy stretches of more bears than bulls on both the II and AAII surveys. Persistent pessimism among advisory services has now been broken and it’s time for the bulls to show what they’ve got left in their tank. The clock is ticking, though, as they’ve used so much of their limited firepower and yet we continue to see more stocks making new 52-week lows than 52-week highs. Bulls have put together two days of better than nine-to-one upside volume (on July 15 and again on July 19). That checks off one box (out of five) on our bull market re-birth checklist, but there is more work to be done before concluding that any uptick in optimism is well-placed.
Sentiment Report Chart of the Week: Recession Fears Misplaced?
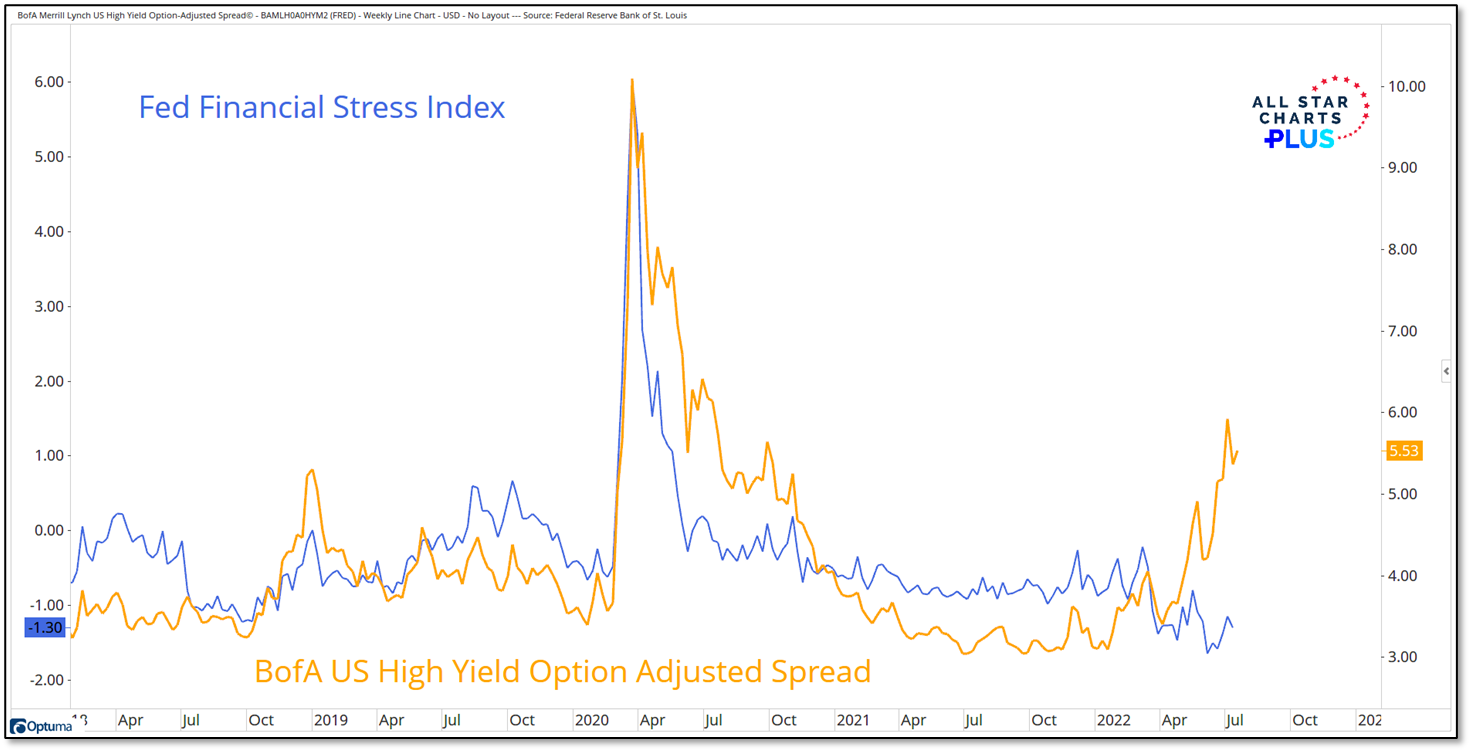
High yield spreads moving higher tends to be a reliable sign that liquidity conditions are deteriorating and economic prospects are worsening. This usually means more stress in the financial system. There is plenty of evidence of that in the current situation as incoming data shows activity is cooling rapidly and conditions that are consistent with (or may lead to) recession are more widespread. Pushing back against all that is the Fed’s Financial Stress Index, which is actually below where it was when the Fed began raising rates in March. It may be that the Fed’s index moves more slowly than some of the other indicators (like high yield spreads) or it could also be that the fear reflected in widening yield spreads (and the inversion between 2-year and 10-year Treasury yields) is misplaced. The burden of proof is on the bulls to prove that it is the later and not the former.
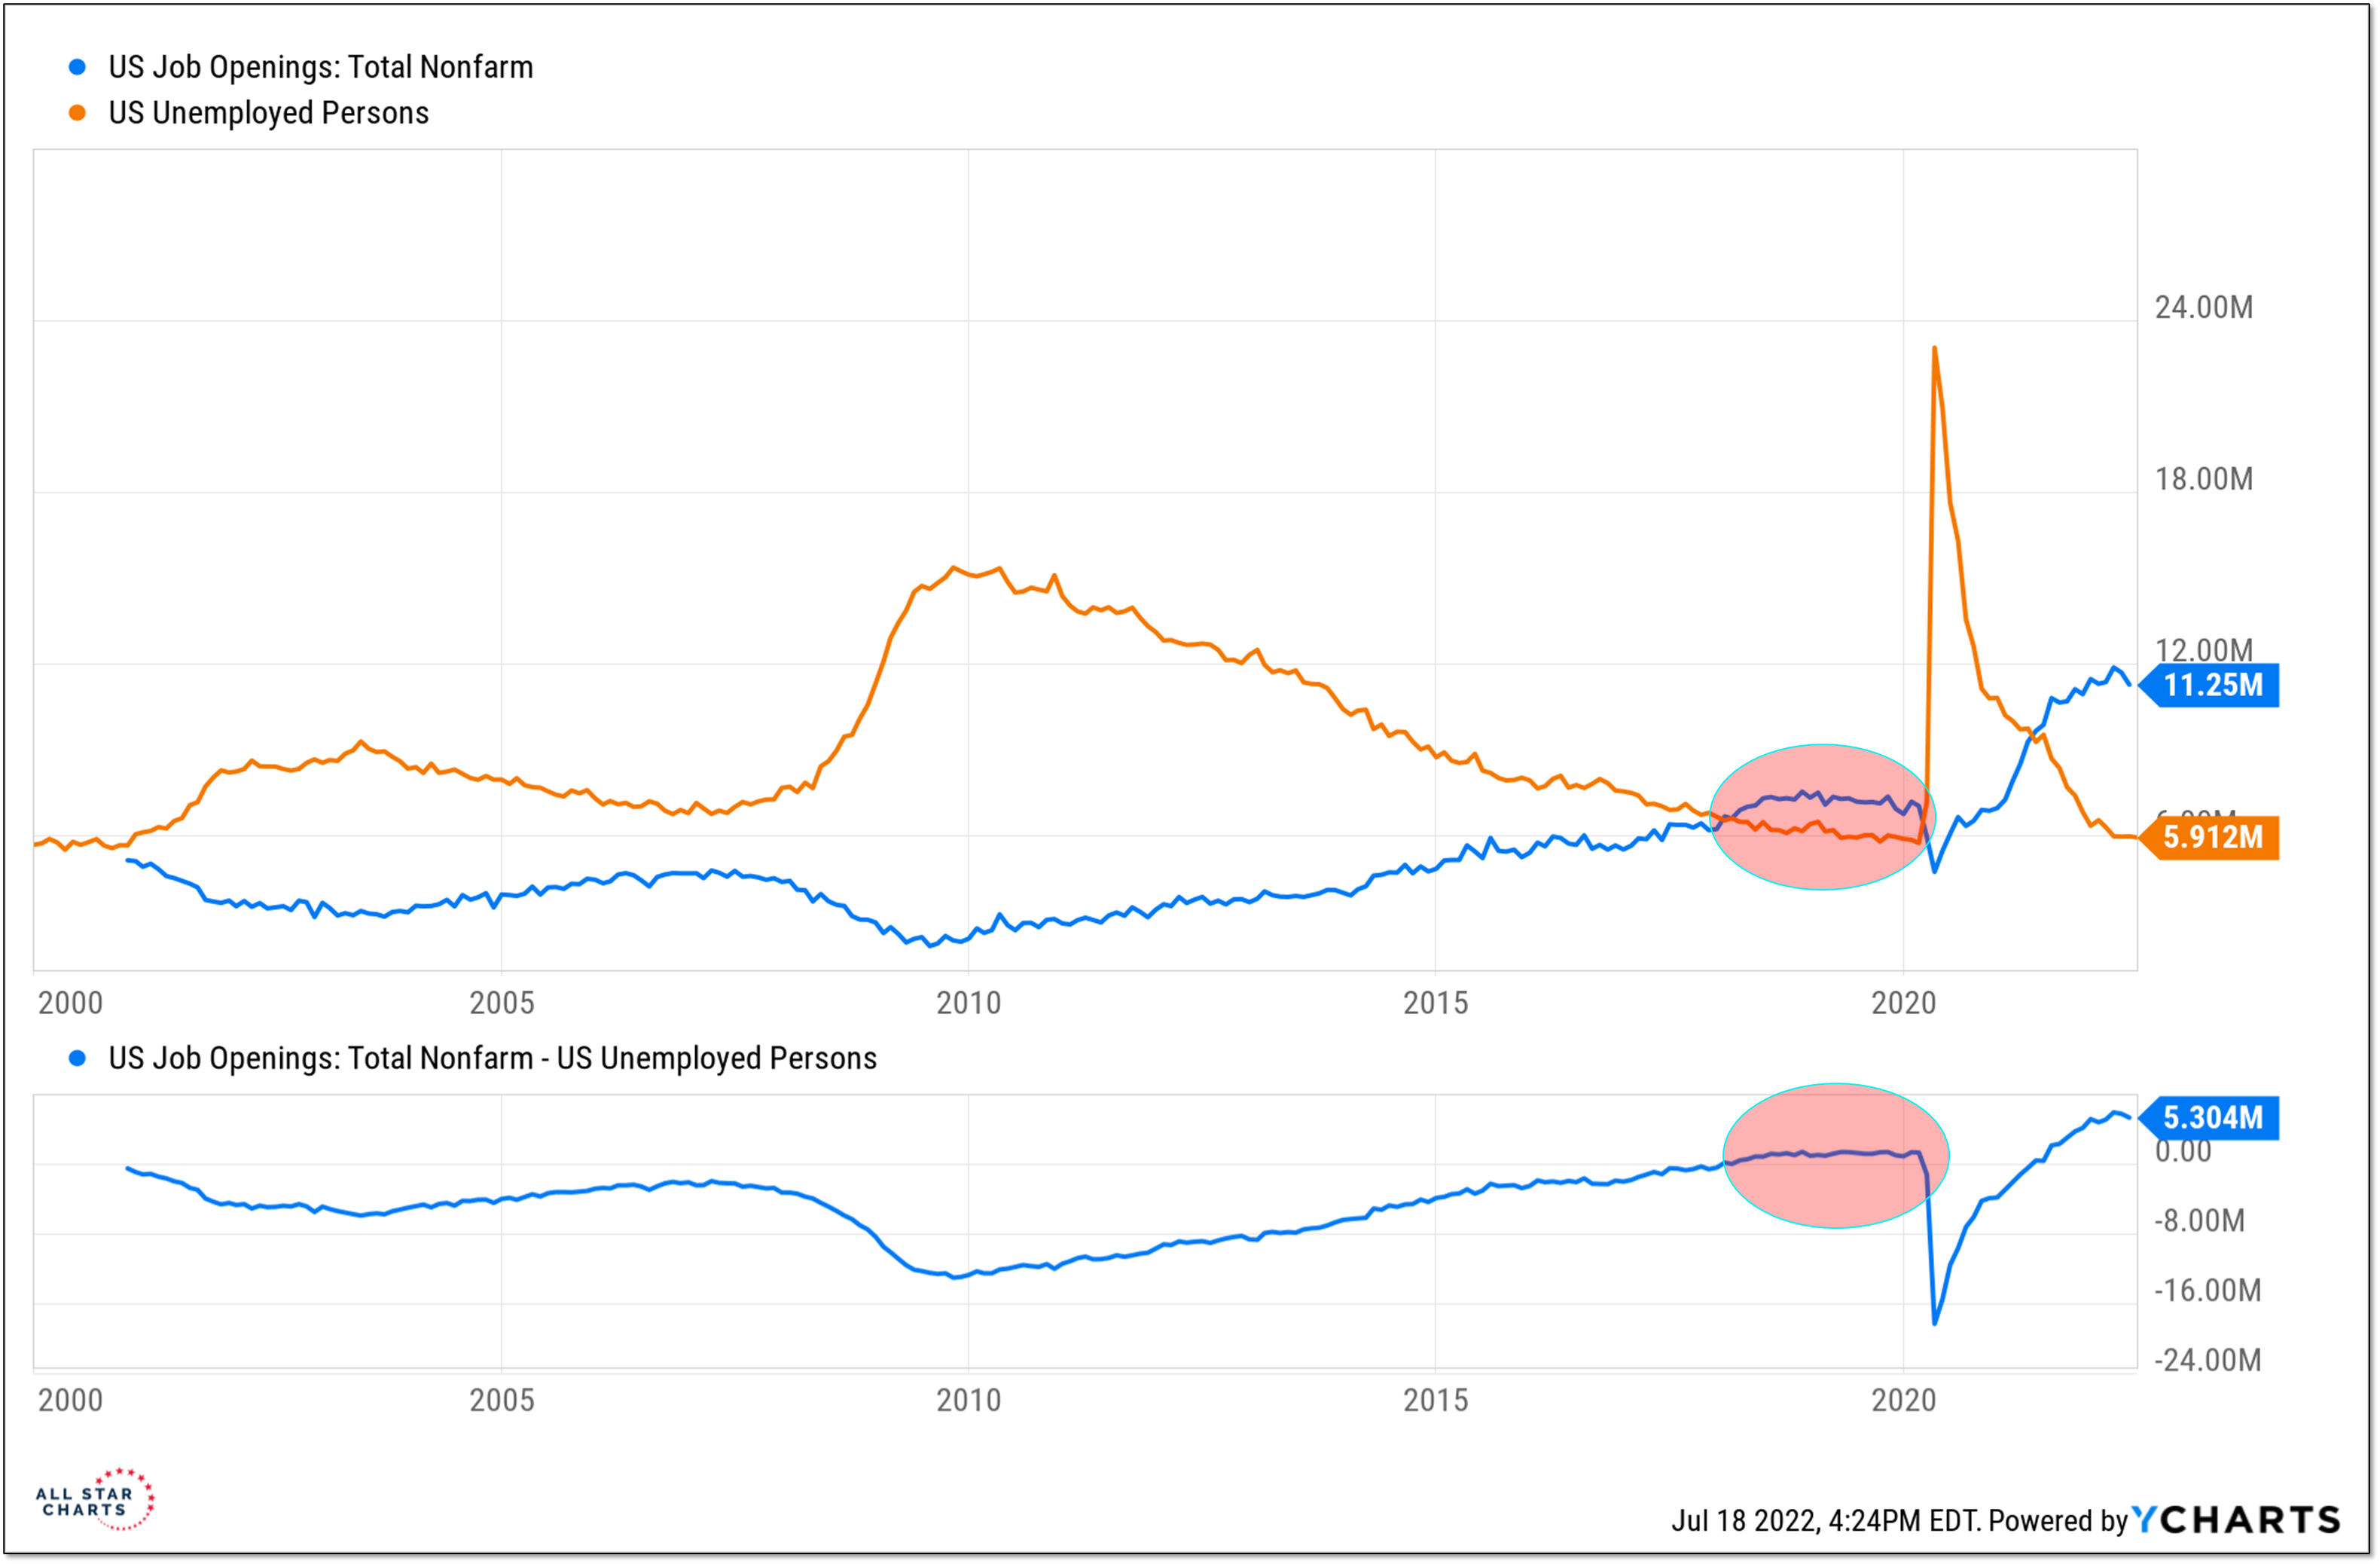
The current imbalance between job openings and unemployed persons gets plenty of attention. That there are twice as many job openings as there are people looking for a job is a historically unique situation. Having more job openings than job searchers, however, is not unprecedented. That was also the situation in 2018 and 2019, though the emergence of COVID seems to have washed that from our collective awareness. I can still clearly recall discussing skilled worker shortages with small business owners in the Midwest. The policy responses (both fiscal and monetary) to COVID exacerbated these imbalances, but the seeds of the current wage and price pressures were being sown before lockdowns and social distancing became a reality.
This suggests a more deeply embedded issue for the economy in terms of reducing wage and price pressure than many (even those at the Fed) appreciate. The relative scarcity of workers may also mean that employers will be less likely to reduce headcount in the face of economic headwinds than they have in the recent past. Looking at average weekly hours and aggregate hours worked indexes may be more useful than watching payroll data.
From the desk of Steve Strazza @Sstrazza
Our Top 10 Charts Report was just published.
In this weekly note, we highlight 10 of the most important charts or themes we’re currently seeing in asset classes around the world.
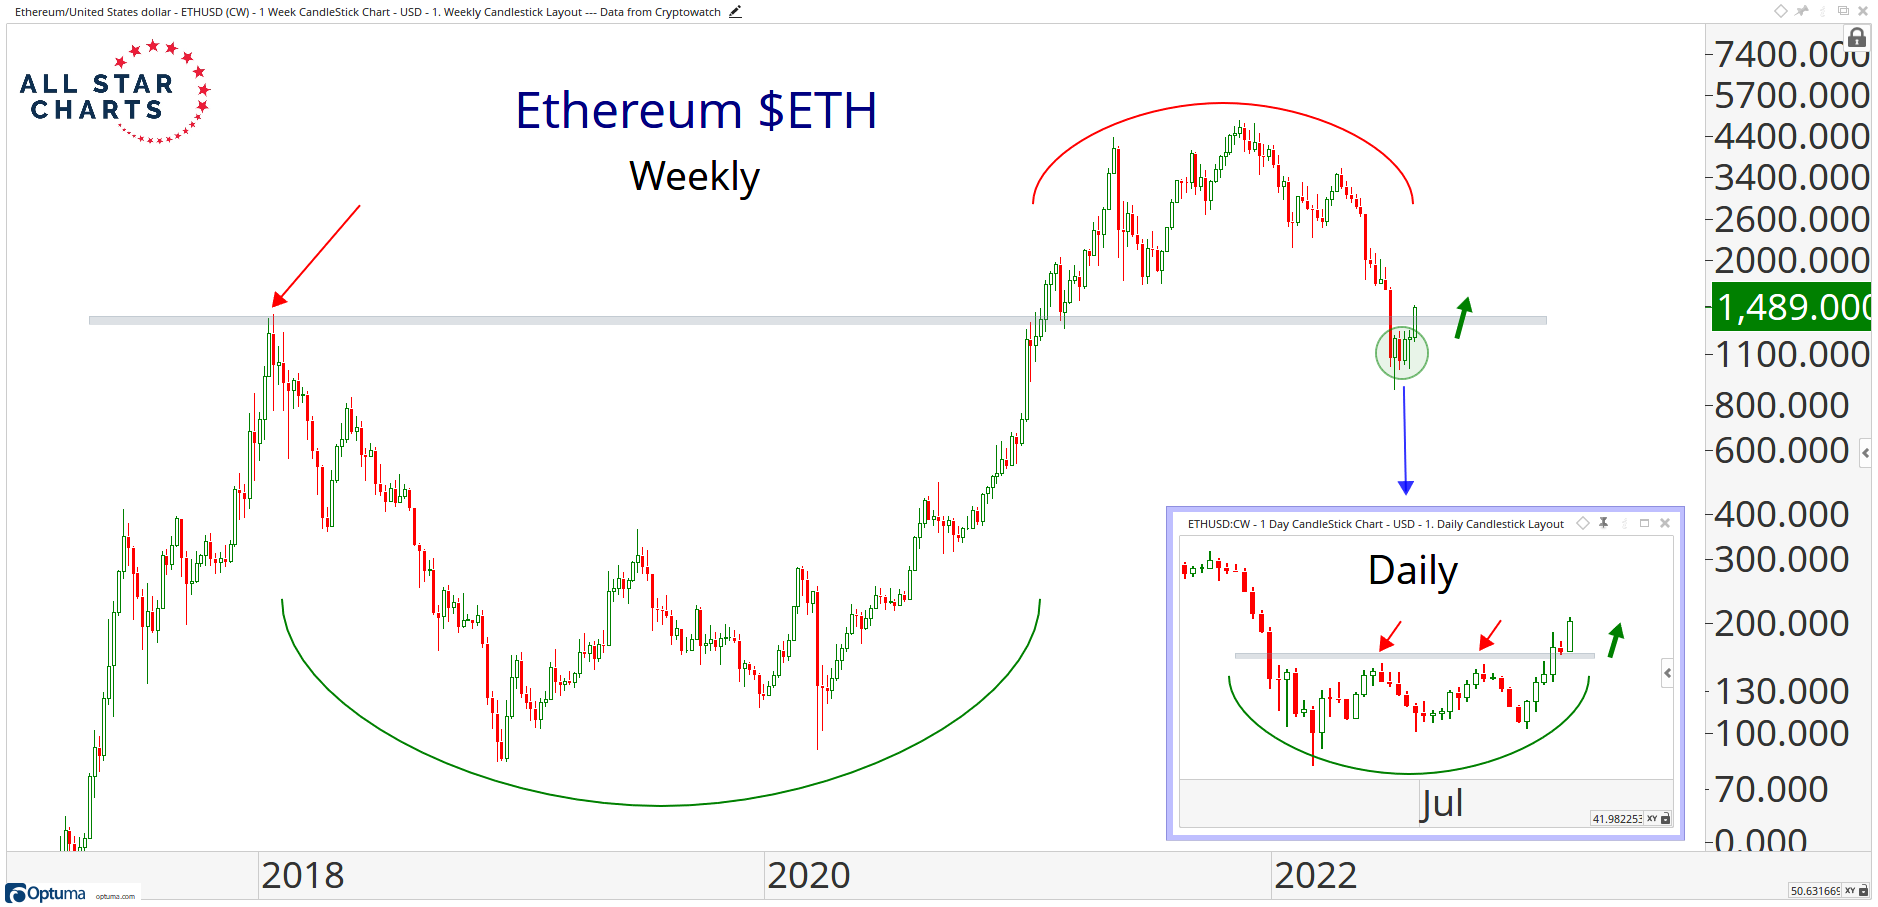
ETH Kicks Off Crypto Rally
It was a busy weekend for cryptocurrencies, and Ethereum, in particular. The world’s second-largest crypto just resolved higher from a bearish continuation pattern right at a key polarity zone.
When patterns fail, it’s always great information. In this case, a downside resolution in the direction of the underlying trend was the higher probability outcome, but it didn’t happen that way. Instead, buyers took control and forced an upside resolution. Another thing that makes this price action stand out is where it took place. Ethereum just dug in and reversed after a brief shakeout beneath the 2017 highs. As long as we’re back above the prior-cycle peak of 1400, the bias is higher.
Key Takeaway:
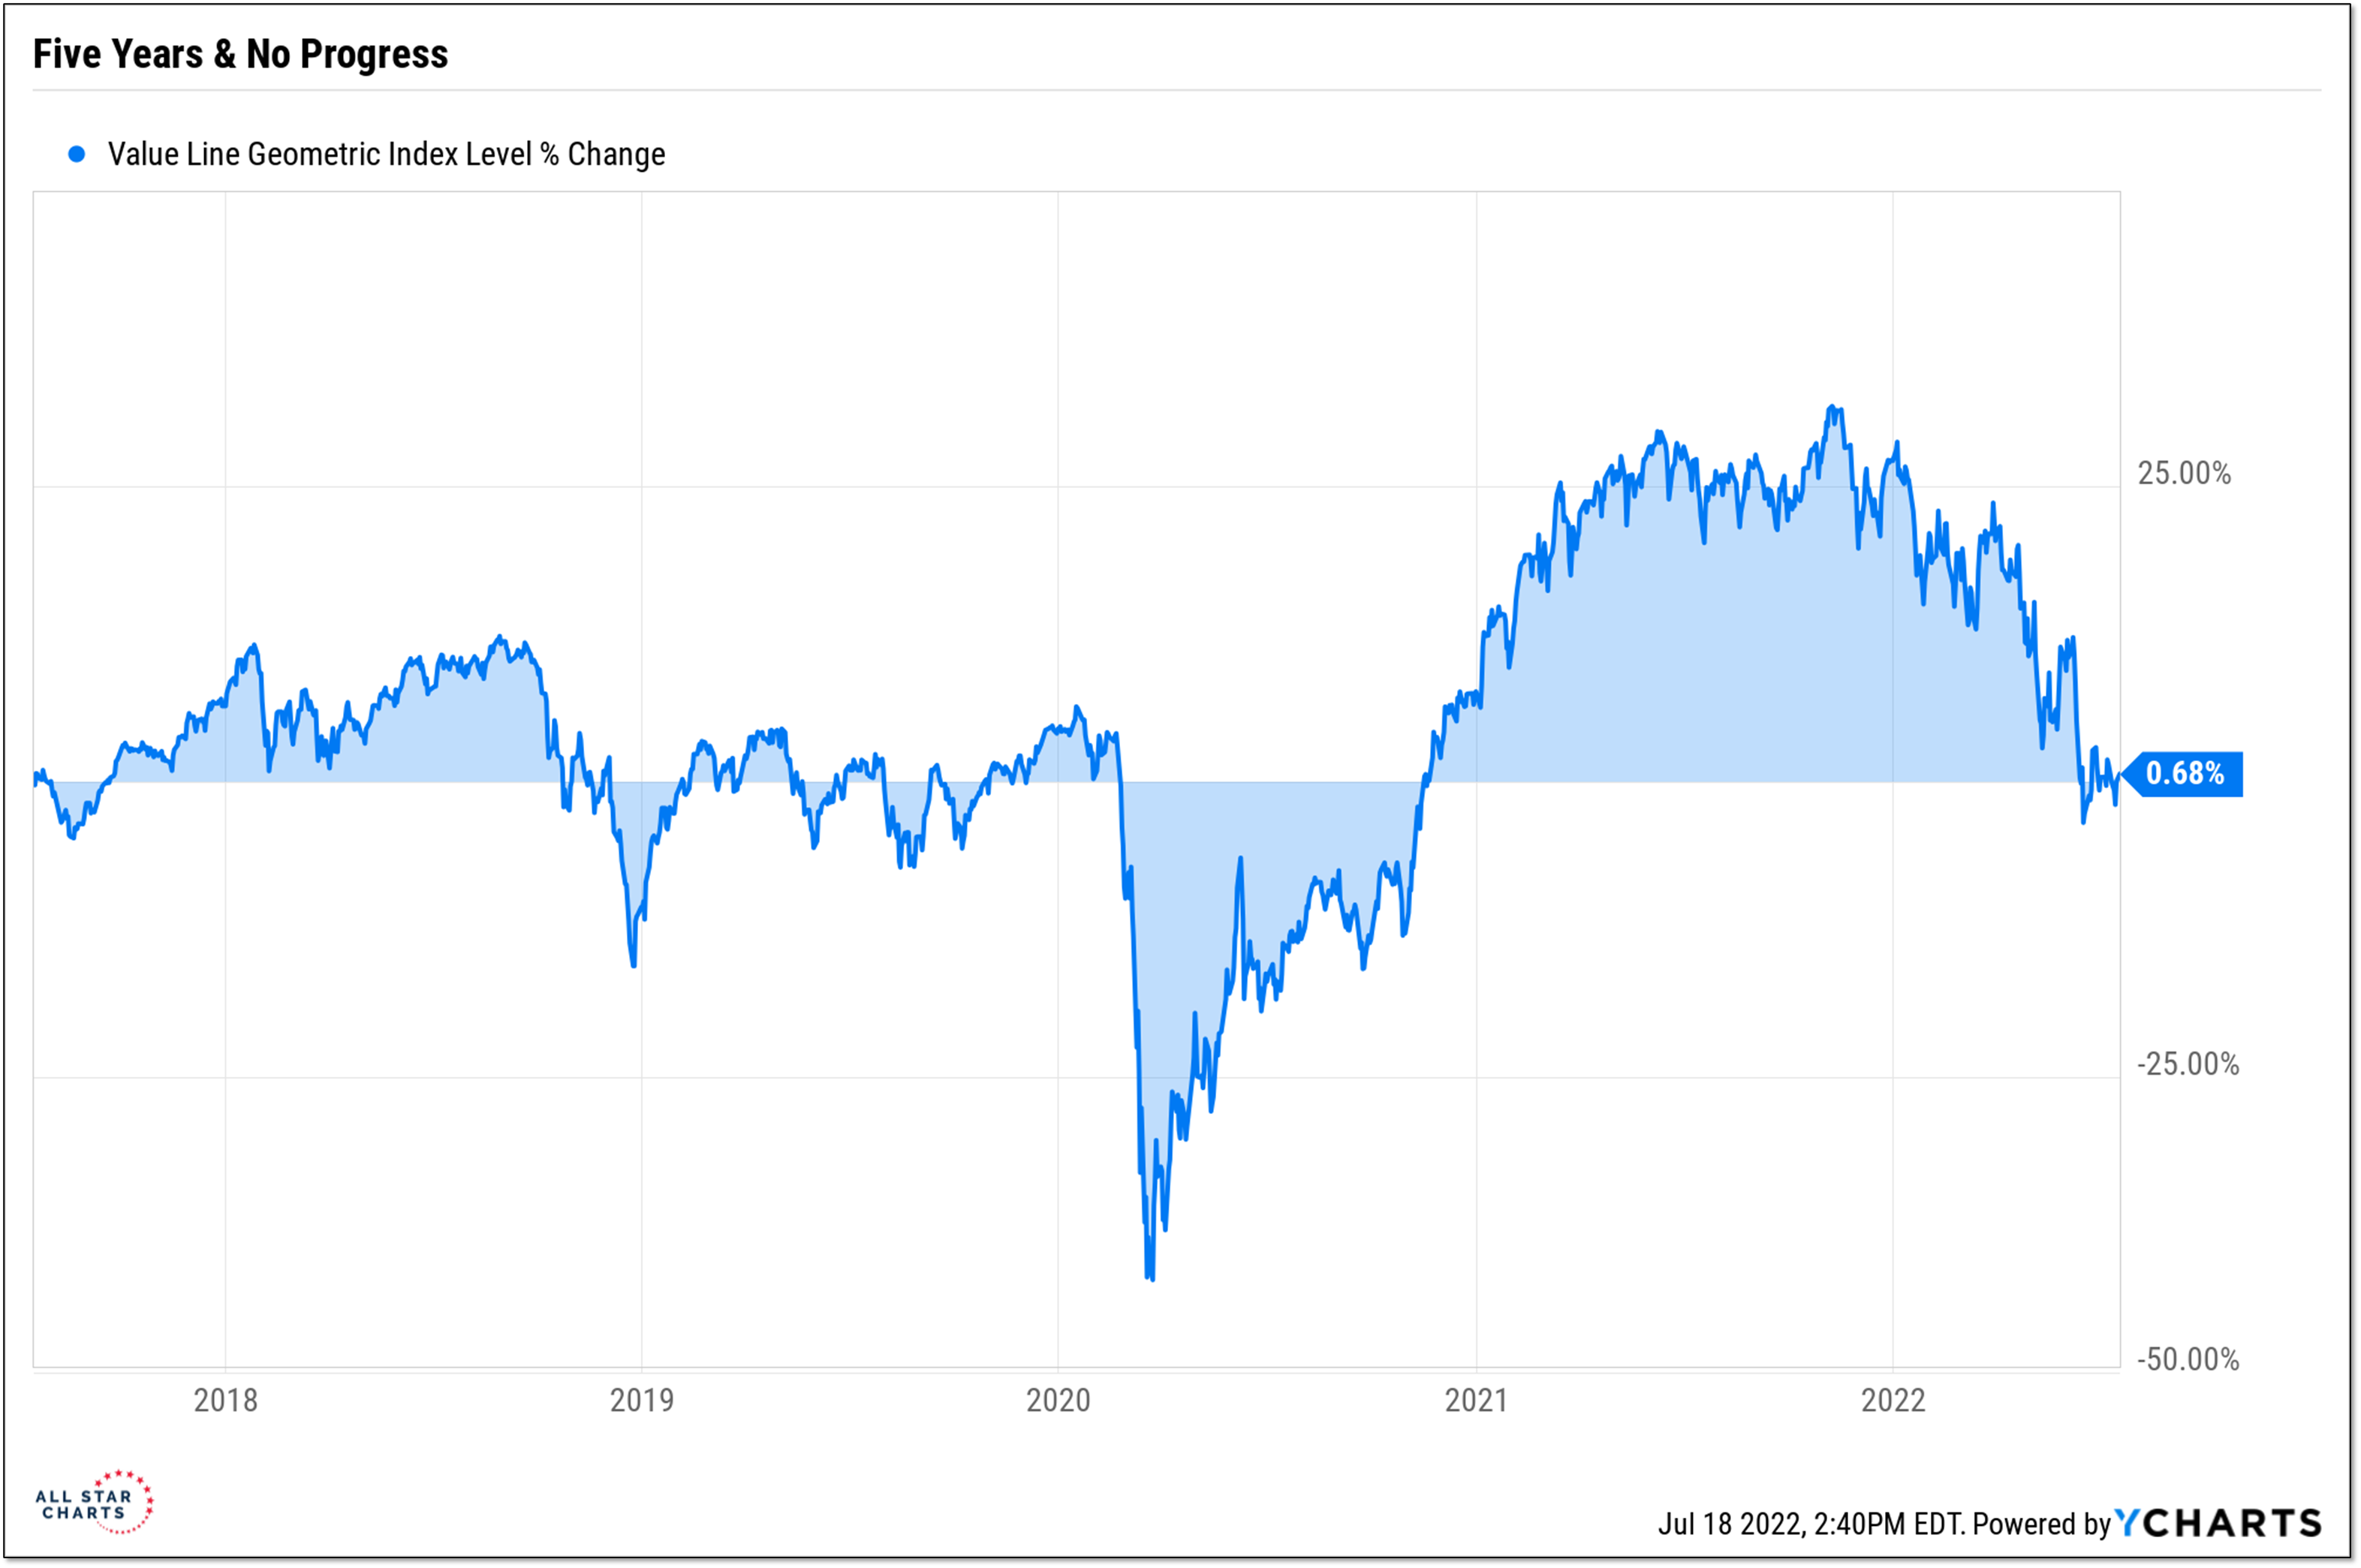
When new lows have exceeded new highs for 34 weeks (and counting) and the Value Line Geometric Index (a proxy for the median US stock) is no higher now than it was five years ago, even small amounts of good news get celebrated. We saw some of that on Friday.
A decline in the longer-term inflation expectations number in the University of Michigan Consumer Sentiment Survey helped fuel a broad stock market rally. Recall that it was an unexpected uptick in inflation expectations in the preliminary June data that prompted the Fed to raise rates by 75 basis points last month. Odds of a 100 basis point rate hike at next week’s FOMC meeting had been on the rise following the release of unexpectedly hot readings for CPI and PPI. By the end of the week there were sighs of relief as the consensus was back to “just” another 75 basis point rate hike.
Regardless of the reasons, the reality is that upside volume on the NYSE outpaced downside volume by more than 9-to-1 on Friday. This was the first 9-to-1 up-day we have witnessed since mid-May. A second one, without an intervening 9-to-1 downside day, would give us the first hard evidence that a bull market could soon be in the process of being re-born.
From the desk of Willie Delwiche.
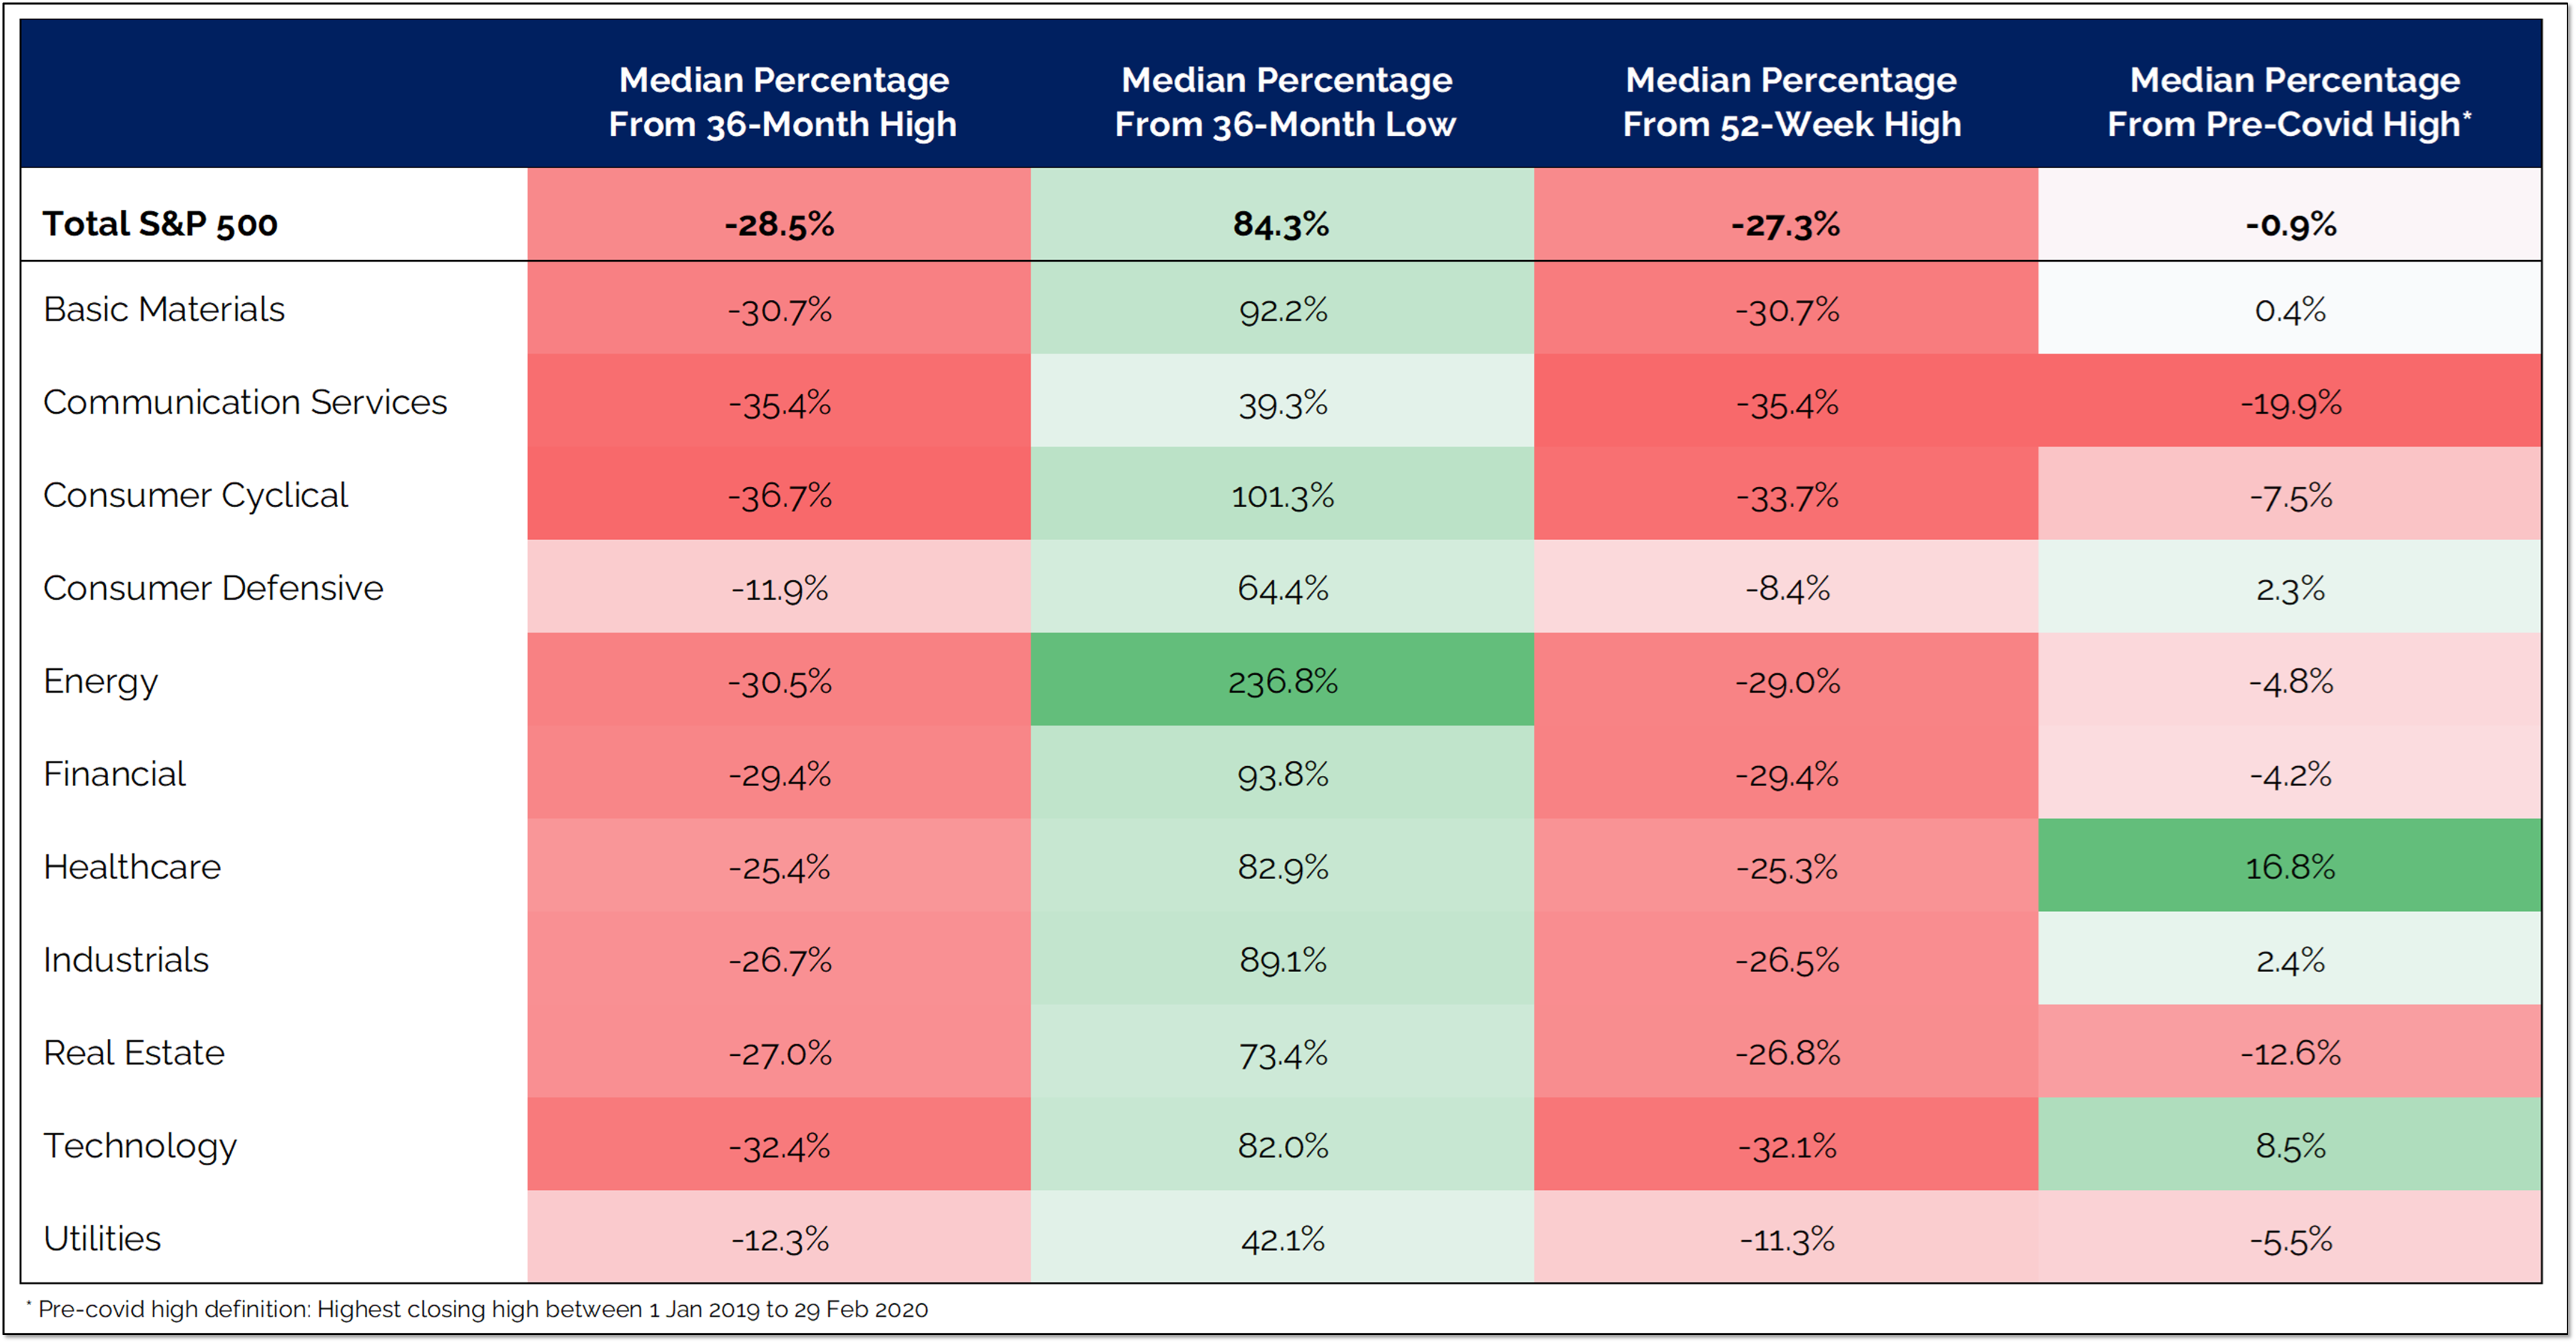
The S&P 500 index is 20% off its early 2022 high, but remains nearly 14% above its pre-COVID peak. The median stock in the index, however, is now trading just below its pre-COVID high. The last several years have been an experience of tremendous volatility with no upside progress for the median stock. The numbers are even more startling among mid-caps and small-caps. Both the mid-cap S&P 400 and small-cap S&P 600 are nearly 10% above their pre-COVID peaks, but the median mid-cap stock is 10% below its pre-COVID high and the median small-cap stock is 20% below its pre-COVID high. This brings us to commodities. The median commodity is 30% below its high, but remains 20% above its pre-COVID peak. Whether it’s stocks or commodities (or bonds for that matter) there is plenty of volatility in the current environment. The volatility in commodities is in the context of an underlying up-trend. With the median stock in the S&P 500 returning to its pre-COVID high (and the Value Line Geometric Index where it was in 2018), it’s been an unrewarding roller coaster ride for stocks.
I’m away for a few days enjoying Wisconsin’s Door County Peninsula. It’s been great to camp and explore in what is widely known as “the Cape Cod of the Midwest.”
I’ll be back Thursday for our regularly scheduled Town Hall but in the mean time, here’s a quick look at our latest Bull Market Re-Birth Checklist.