From the desk of Willie Delwiche.
Key Takeaway:
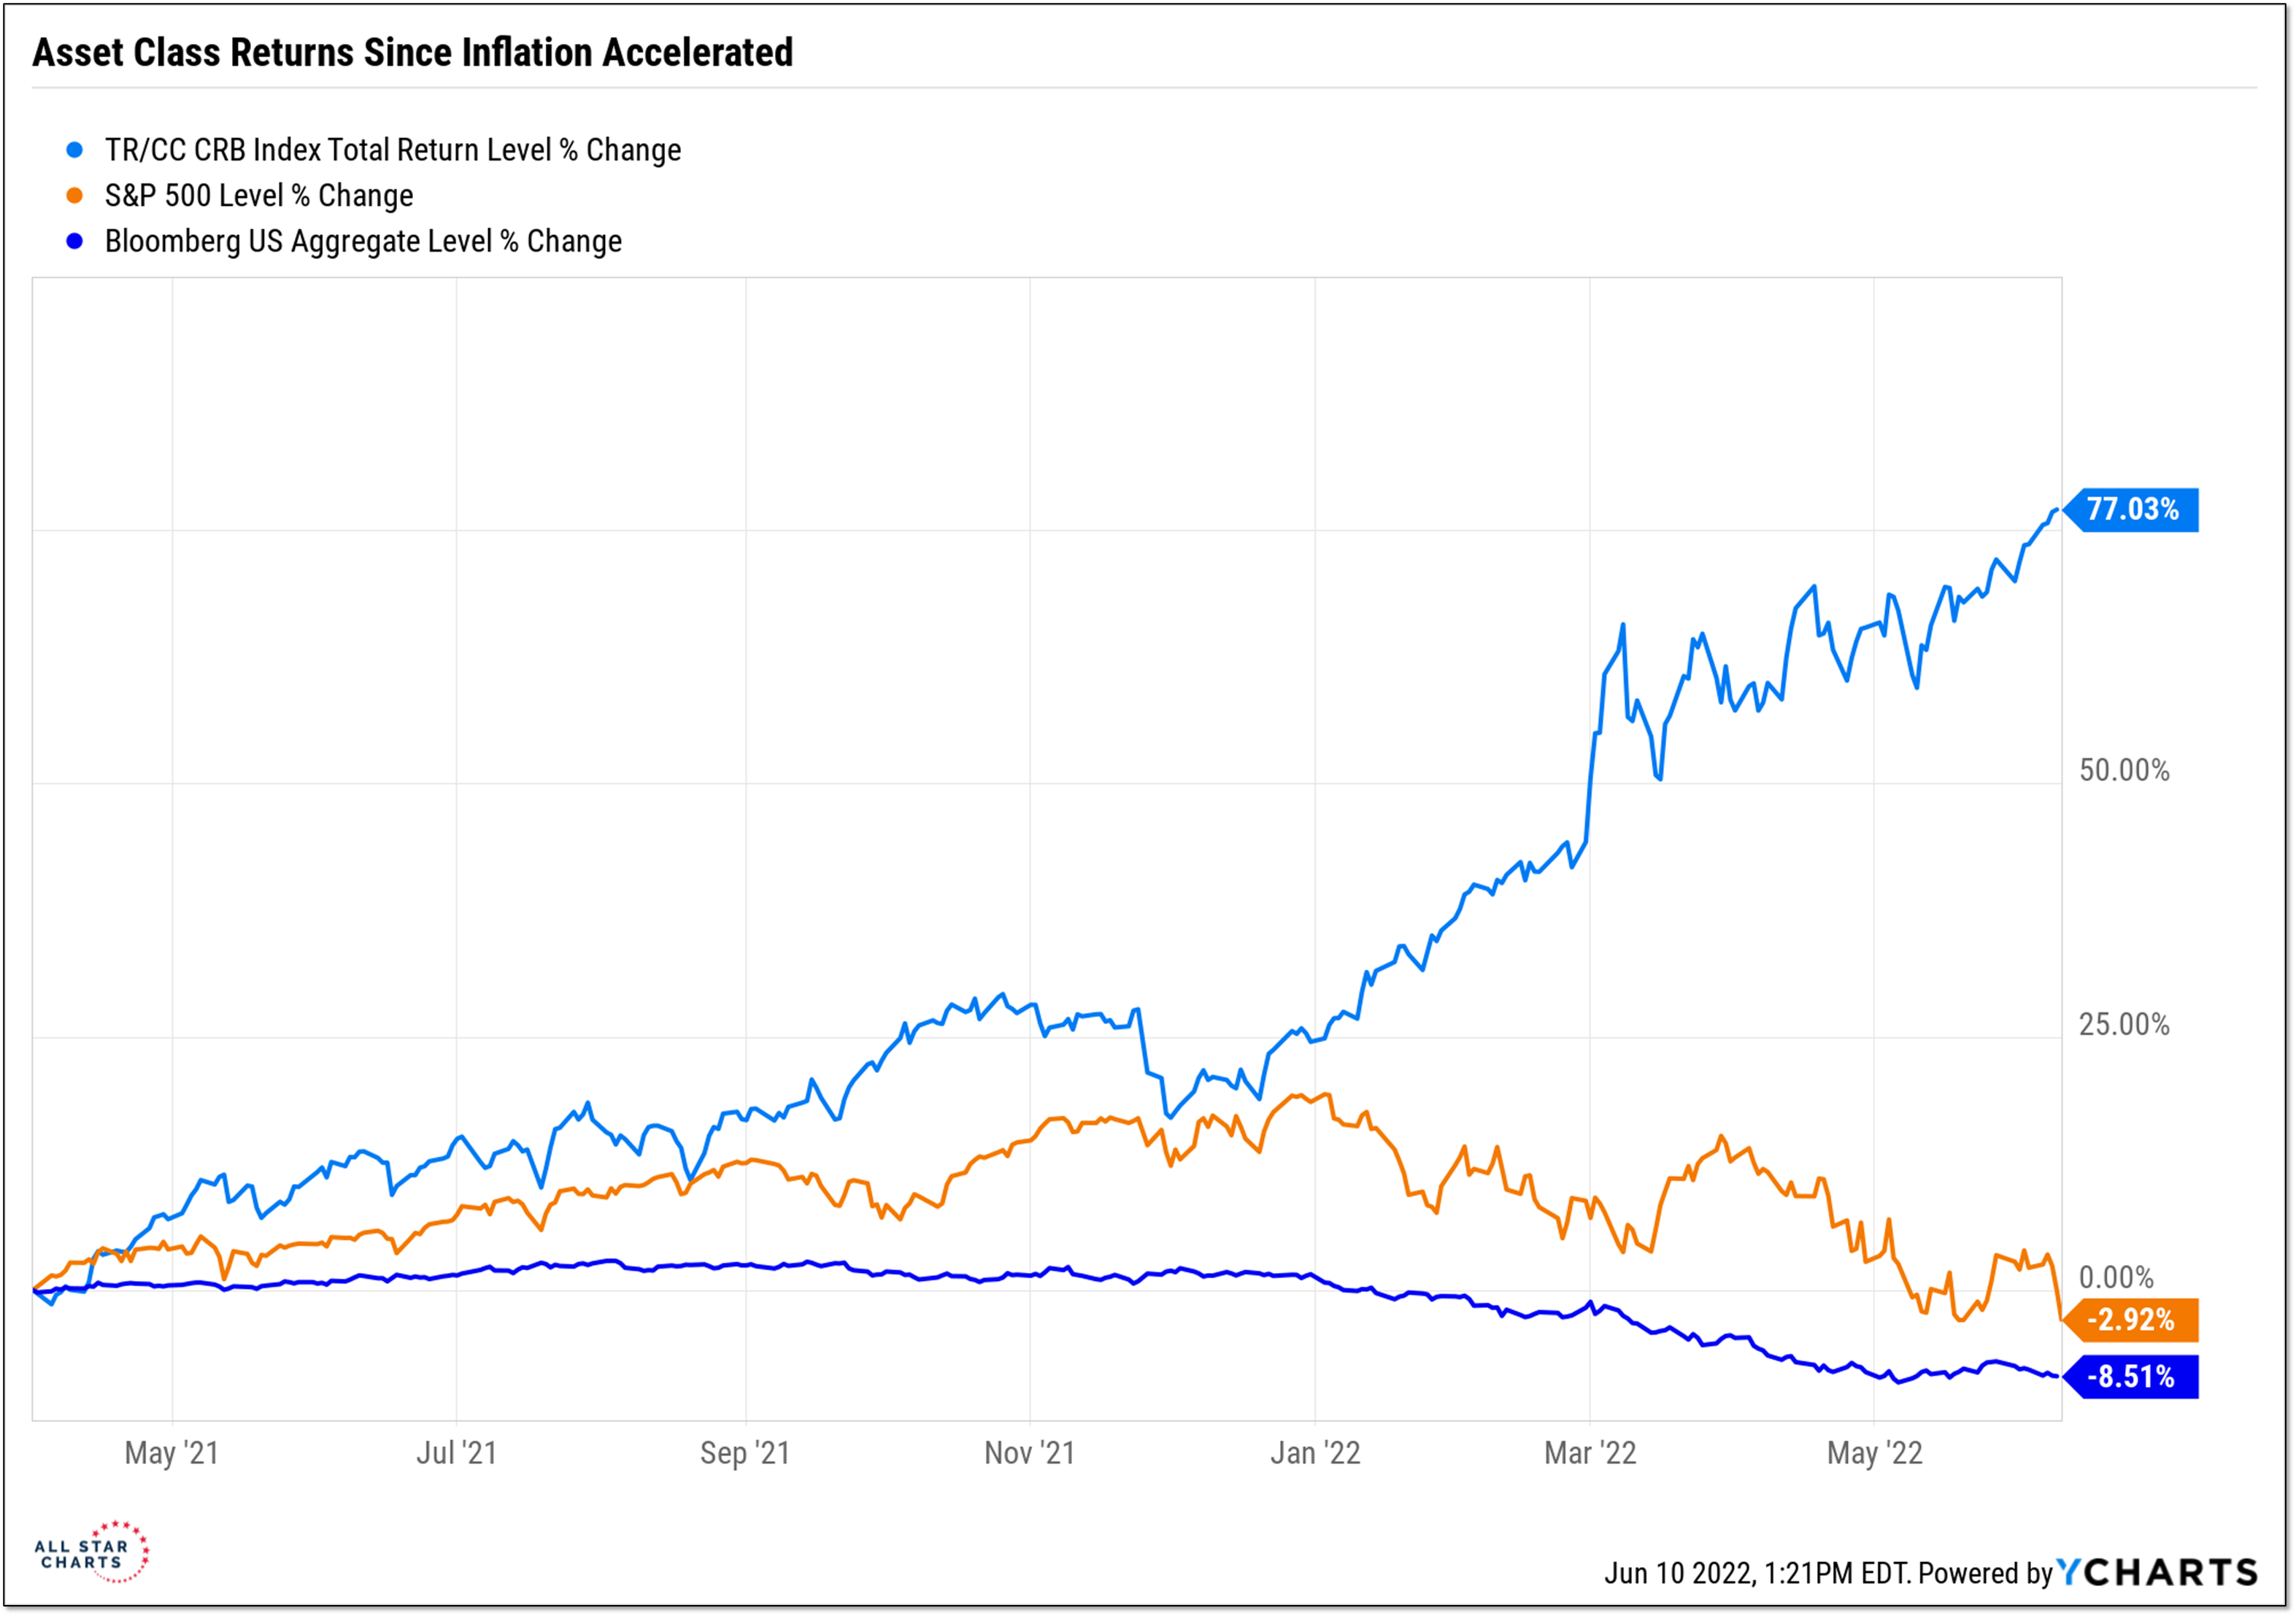
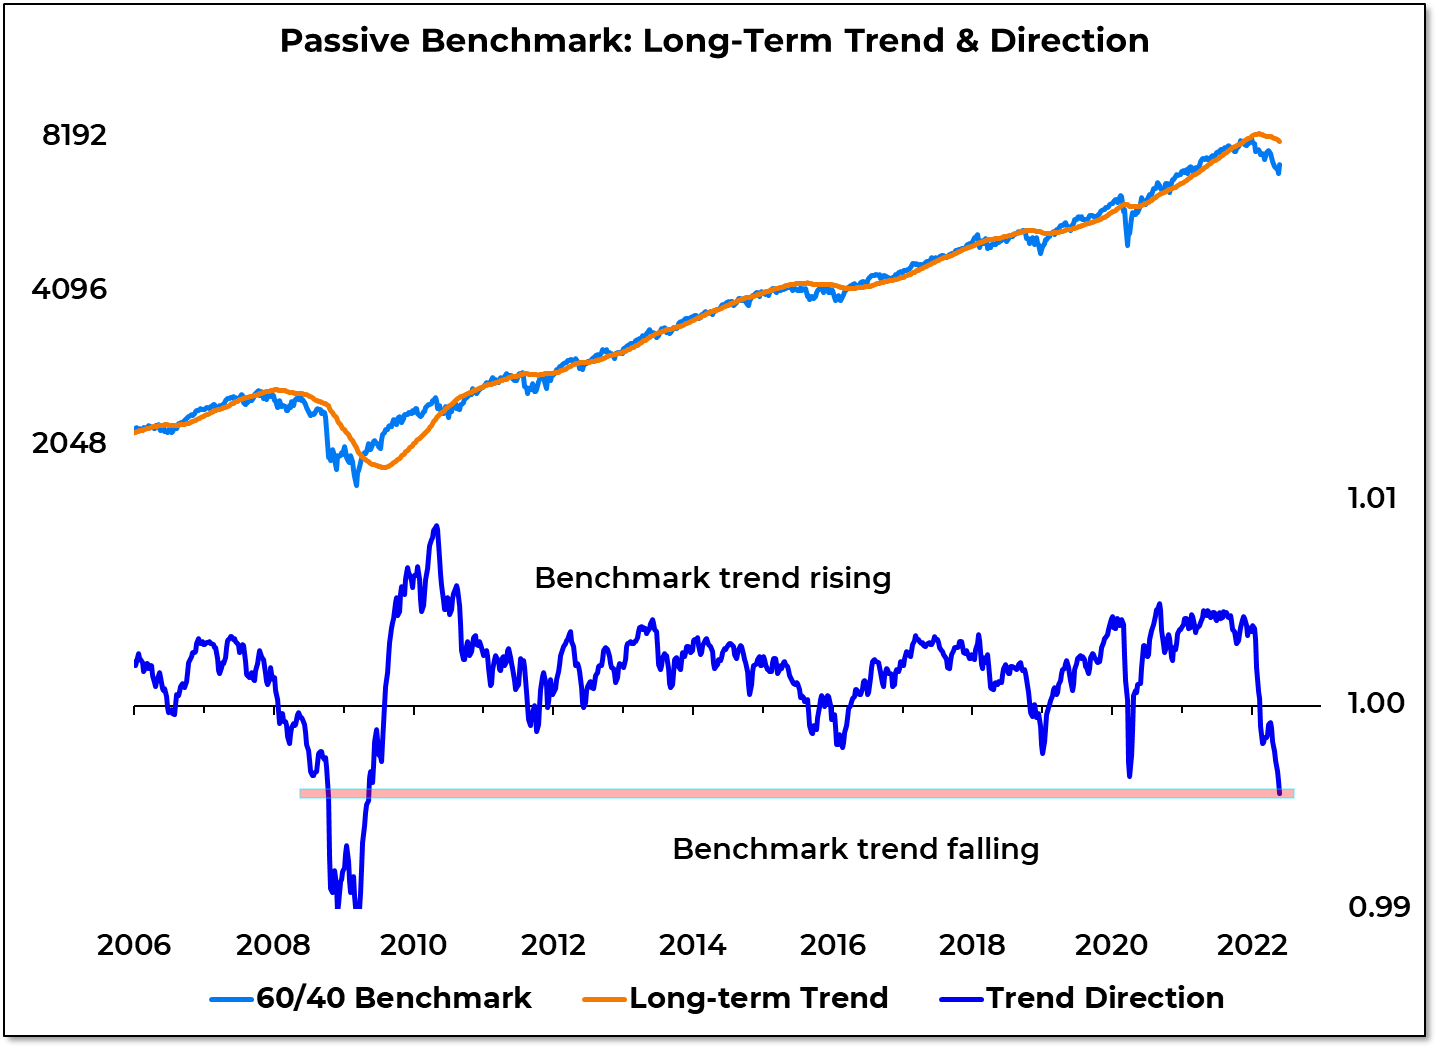
- Stocks and bonds weighing on portfolios.
- Federal Reserve faces a credibility test of its own making.
- Turmoil usually ends after something gets broken – this time it may be investor resolve.
It’s clear now that the late-May bounce and early-June consolidation was more an absence of selling (in both stocks and bonds) than a meaningful increase in appetite for these assets. Now that selling pressure has re-emerged, stoked by persistent inflation, stocks have moved to new lows for the year and bond yields have surpassed their 2018 highs. For many investors, particularly those in 60-40 (or similar) stock/bond allocations, this is producing a market environment that is virtually without precedent in the past quarter century.
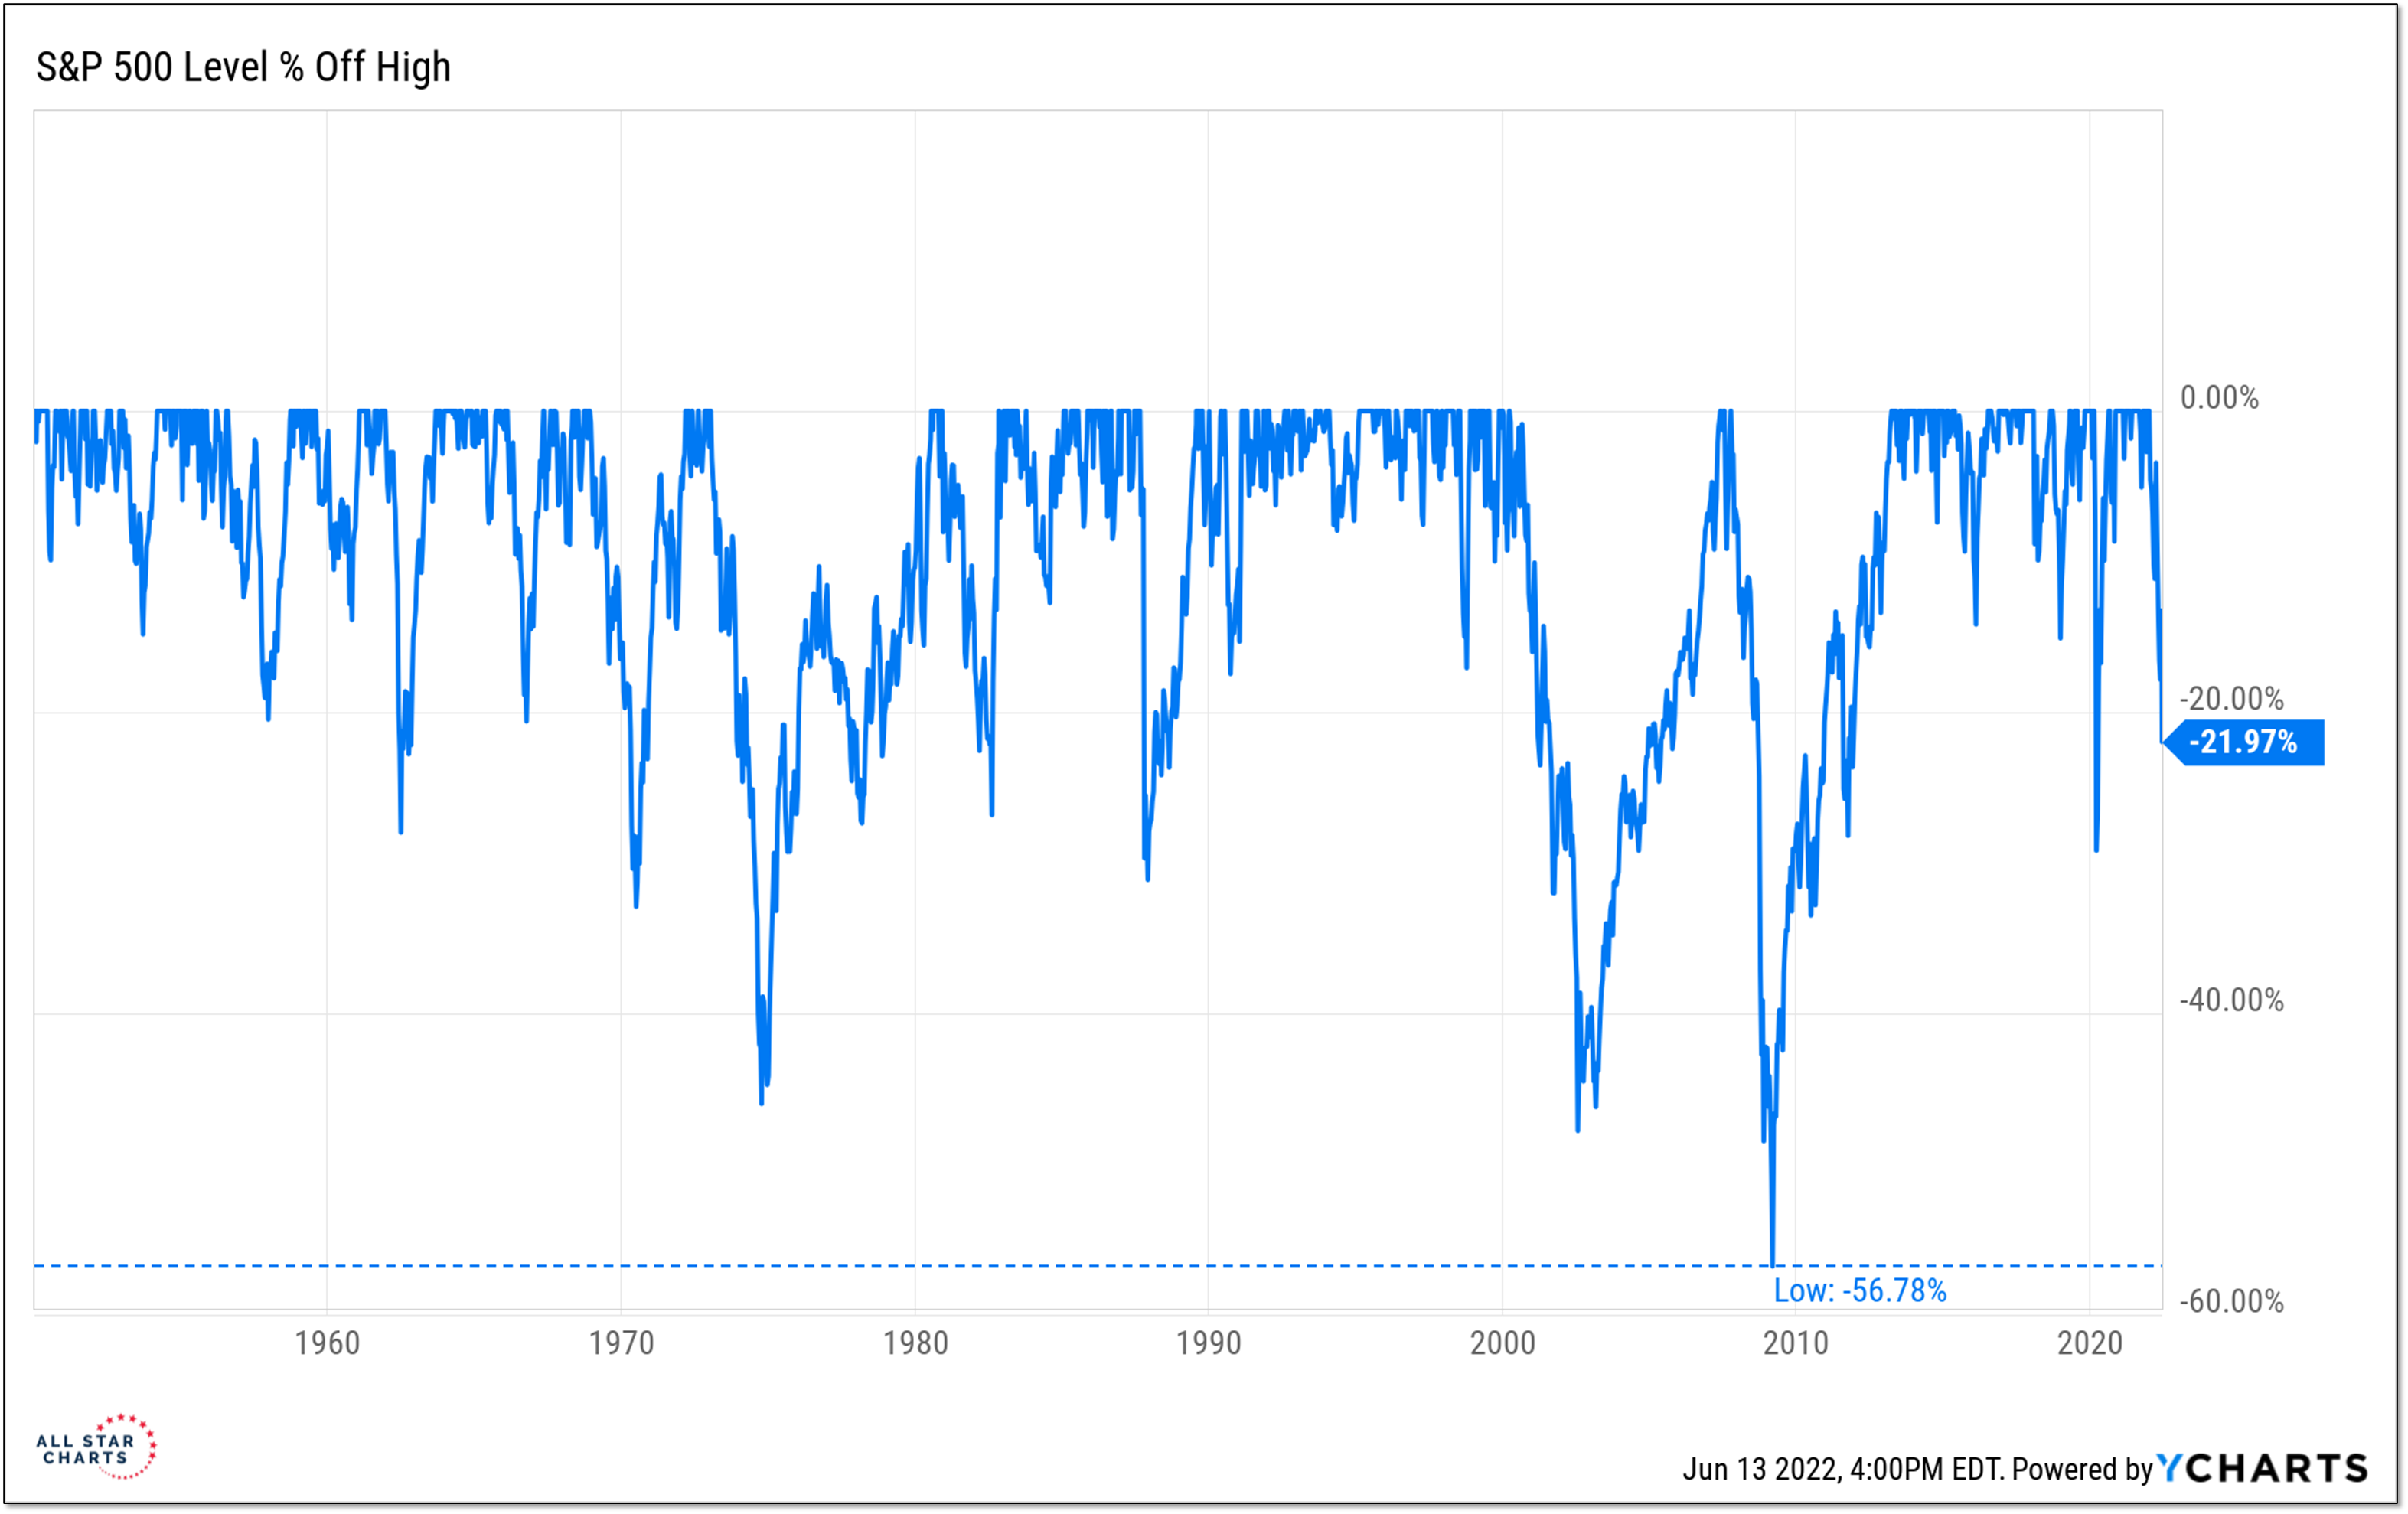
Comparisons to the Financial Crisis come to mind. Perhaps that is not surprising given that the 29 consecutive weeks (and counting) of more new lows than new highs on the NYSE+NASDAQ is the longest such stretch since 2009. The current pullback in the S&P 500 has now exceeded 20% (thus, in the eyes of some, making this an official bear market) but that is less than half of the peak to trough drawdown experienced from October 2007 to March 2009.