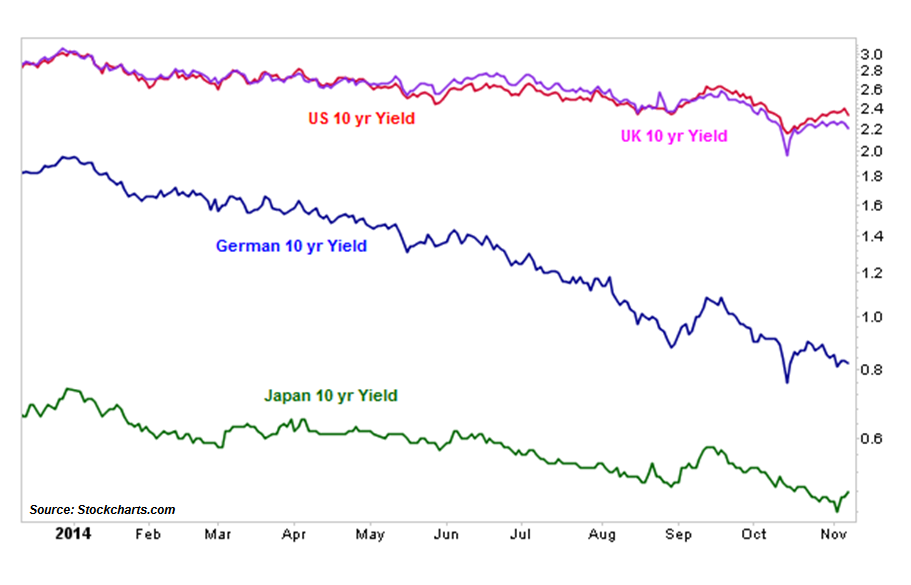
You guys who have followed my work over the years know how many charts I look at on a daily and weekly basis. Believe it or not, it’s probably even more than you think. Some things pique my interest more than others, of course, but it’s the collective weight of the evidence that allows me to formulate a thesis given all of the available information. The specifics include price and sentiment data from stock, bond, commodity and forex markets around the world, most represented visually in chart form.
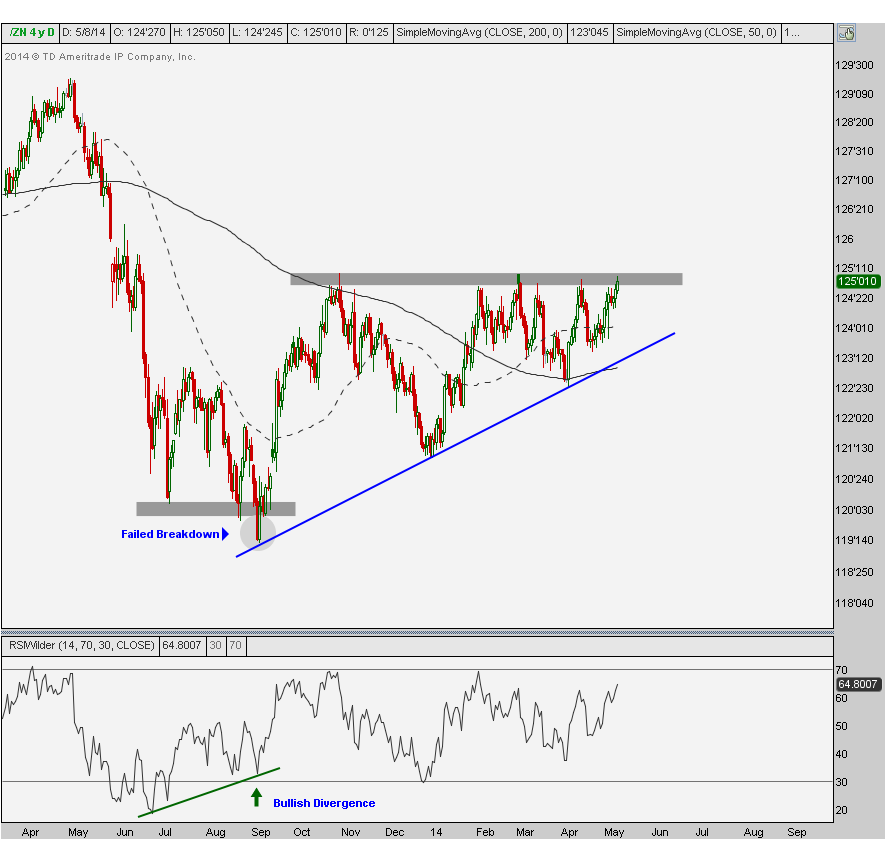
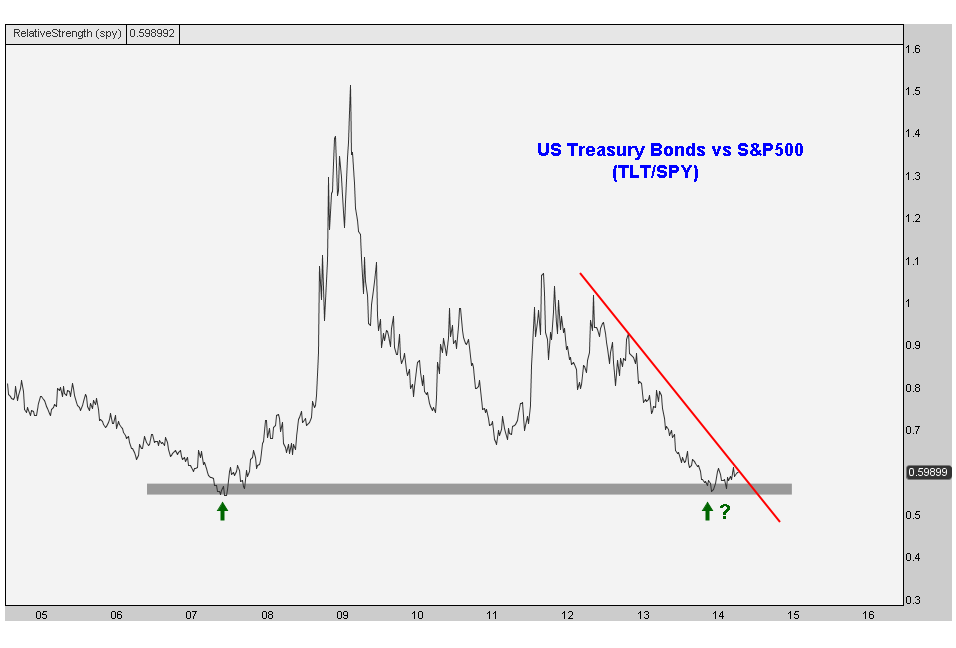
Sometimes there is a specific scenario in a given market that can impact the direction of the price of a lot of different assets around the world. Today, what I see in US Treasury Bonds is what I find to be the most interesting trade in the world. What is happening in this market? Is this a top in bonds and bottom in rates? Is this multi-decade uptrend in bonds finally coming to an end? It’s hard to imagine considering you need to be older than 60 to remember a structural bear market in bonds during your wall street career. [Read more…]