This is the video recording of the December 1st, 2022, Weekly Town Hall w/ Willie Delwiche.
12/1/22 2:00 PM ET [Read more…]
Expert technical analysis of financial markets by JC Parets
This is the video recording of the December 1st, 2022, Weekly Town Hall w/ Willie Delwiche.
12/1/22 2:00 PM ET [Read more…]
From the desk of Willie Delwiche.
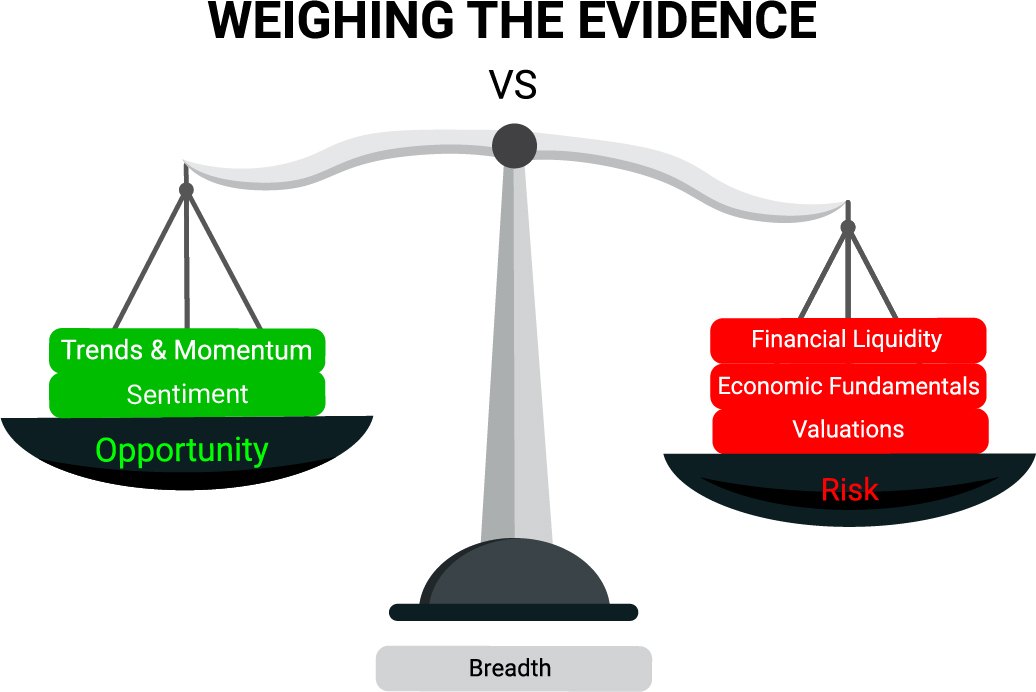
The Scales are unchanged this month, continuing to tip toward risk and away from opportunity.
A strong finish to November has renewed hopes that the 2022 bear market is moving from present reality to past experience. The weight of the evidence argues against jumping to that conclusion just yet. Simply put, we have not seen enough market strength to justify looking past the still present macro concerns. The evidence remains cautious and so do we.
Our Weight of the Evidence Dashboard fills in the details and includes a few charts that have our attention heading into December.
From the desk of Willie Delwiche.
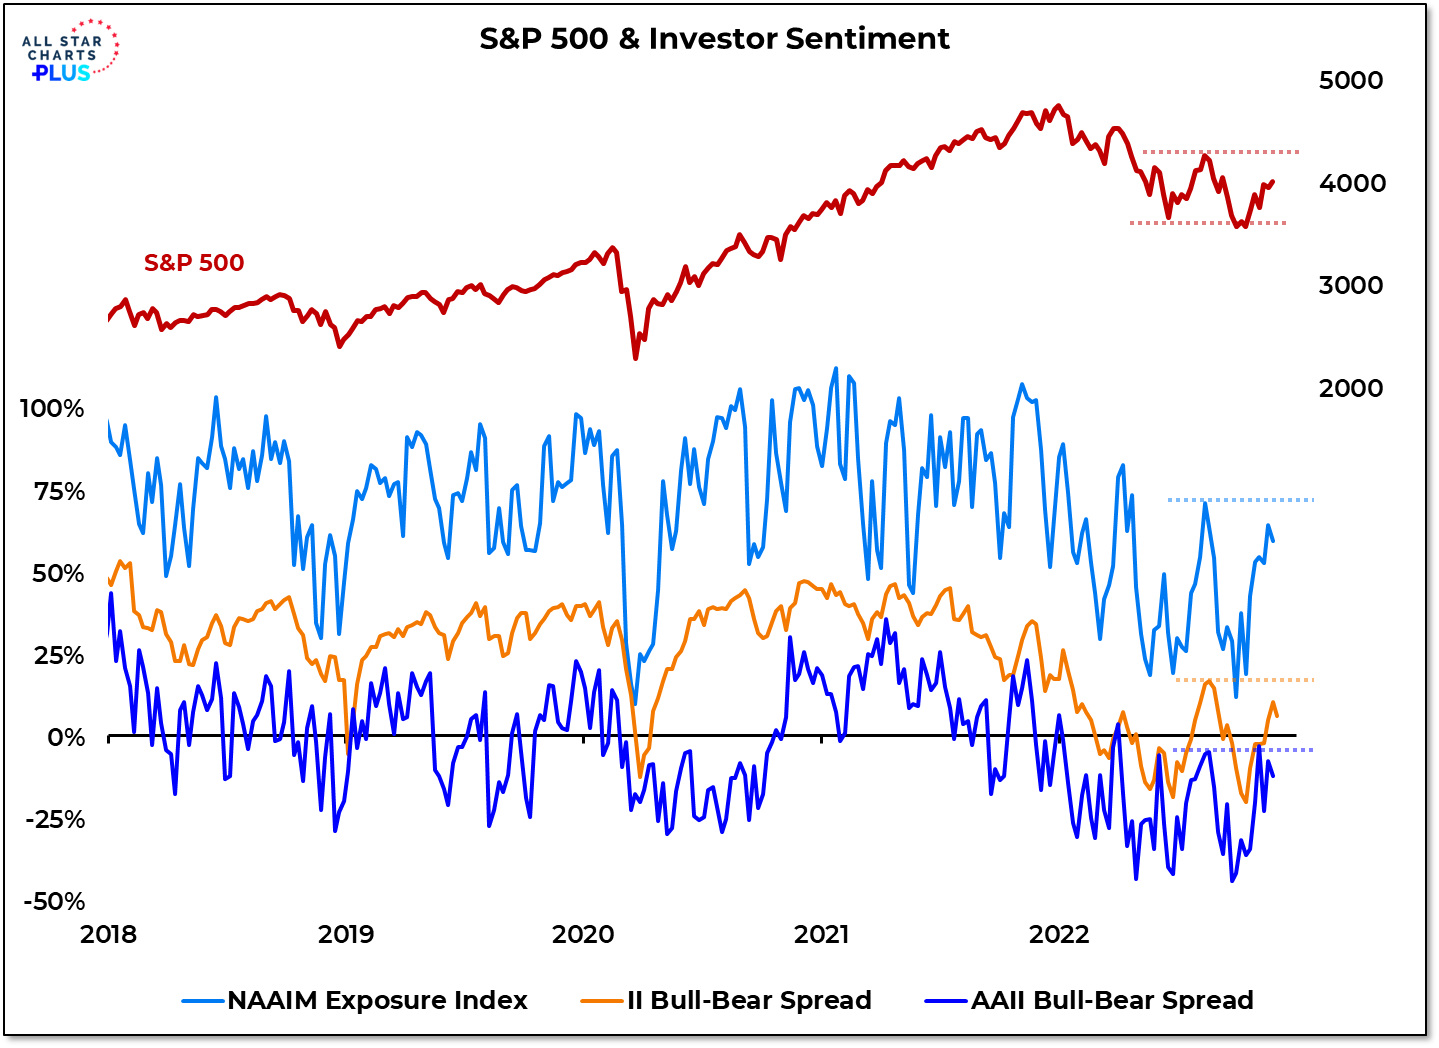
The S&P 500 and various measures of investor sentiment all remain below their August highs. We are getting neither the broad increase in optimism nor the improving price action needed to argue that the bounce off of the October lows is the beginning of a new bull market.
Why It Matters: Price and sentiment often move in tandem. Optimism rebounded as stocks rallied off its October low but has struggled (like it the S&P 500 itself) to eclipse it’s summer highs. All three sentiment indicators have now ticked lower and we are seeing some evidence that the upside price momentum that accompanied the rally off of last month’s lows is starting to wane. Investors getting impatient with an unexpectedly persistent downtrend in prices could be reflected in sentiment indicators moving back toward their recent lows. Ultimately, time will tell how investors respond to their resolve being tested.
In this week’s Sentiment Report we take a closer look at the latest options data and how various groups of investors are responding to the latest market developments.
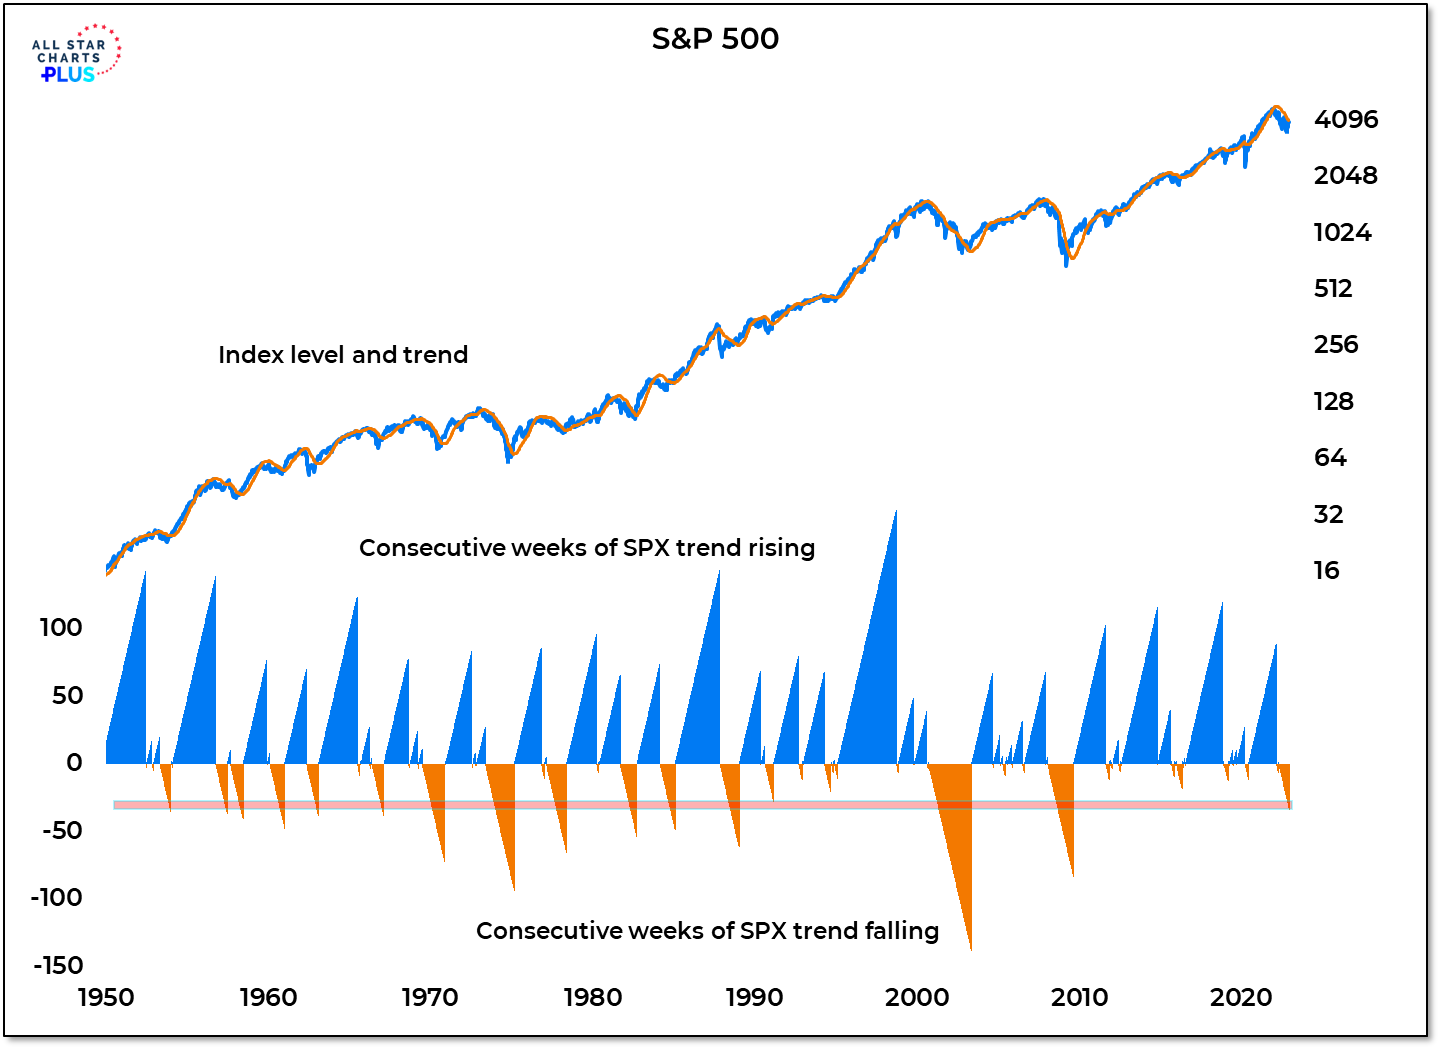
The trend for the S&P 500 has now fallen for 34 weeks in a row. That is the longest sustained decline in the trend since the Financial Crisis ended over a decade ago.
Why It Matters: Since 1950, the trend for the S&P 500 has been rising nearly 70% of the time. In the process the index has climbed from below 20 to above 4000. During a majority of this time (from the 50s through the 80s) extended periods in which the trend was rising were followed by extended periods in which the trend was falling. Downtrends started to get shorter & shorter in the 90s and outside of the bursting of the internet bubble (2000-2002) and the Financial Crisis (2007-2009) that has remained the case. Even the COVID crash came and went so quickly that a down-trend hardly had time to emerge. Outside of the two episodes in the 00s, the current downtrend is proving to be the most persistent since the late 1980s. Investors that have been conditioned to quick downside resolution and sustained advances are having their patience tested.
Our Deeper Look provides more context for the current downtrend in the S&P 500 and looks at other trends that are proving to be unexpectedly persistent.
Portfolio Update: As mentioned in yesterday’s Market Notes, our tactical models are arguing for patience rather than aggressiveness with respect to equity exposure. That being said we want to stay in harmony with relative opportunities as they emerge. While not putting new money to work, we have tweaked the holdings in our Dynamic Tactical Opportunity Portfolio.

Our longer-term risk indicator has been in the Risk Off zone since the beginning of the year. Successive rally attempts have taken it closer and closer to a Risk On signal, but so far it has been unable to break through.
More Context: This indicator, which is calculated based on where various intermarket & intramarket asset ratios are relative to their 52-week trading range, was the sole criteria on our Bull Market Re-Birth Checklist that did not turn positive earlier this summer and it continues to offer a cautious message. The persistence of more new lows than new highs adds weight to that view. After the latest rally off of year-to-date index lows, there is still little evidence that a sustained turn higher is in the works. Fear has been relieved but strength is struggling to emerge. Our tactical models suggest that expecting price bounces to persist is defying history. There are pockets of opportunity, but this remains an environment for selective equity exposure not broad buying and longer-term trends are more favorable to bonds than they are to stocks.
We take a Deeper Look at the current breadth data, new leadership, and the message from the market as we move toward the final month of the year.
From the desk of Willie Delwiche.
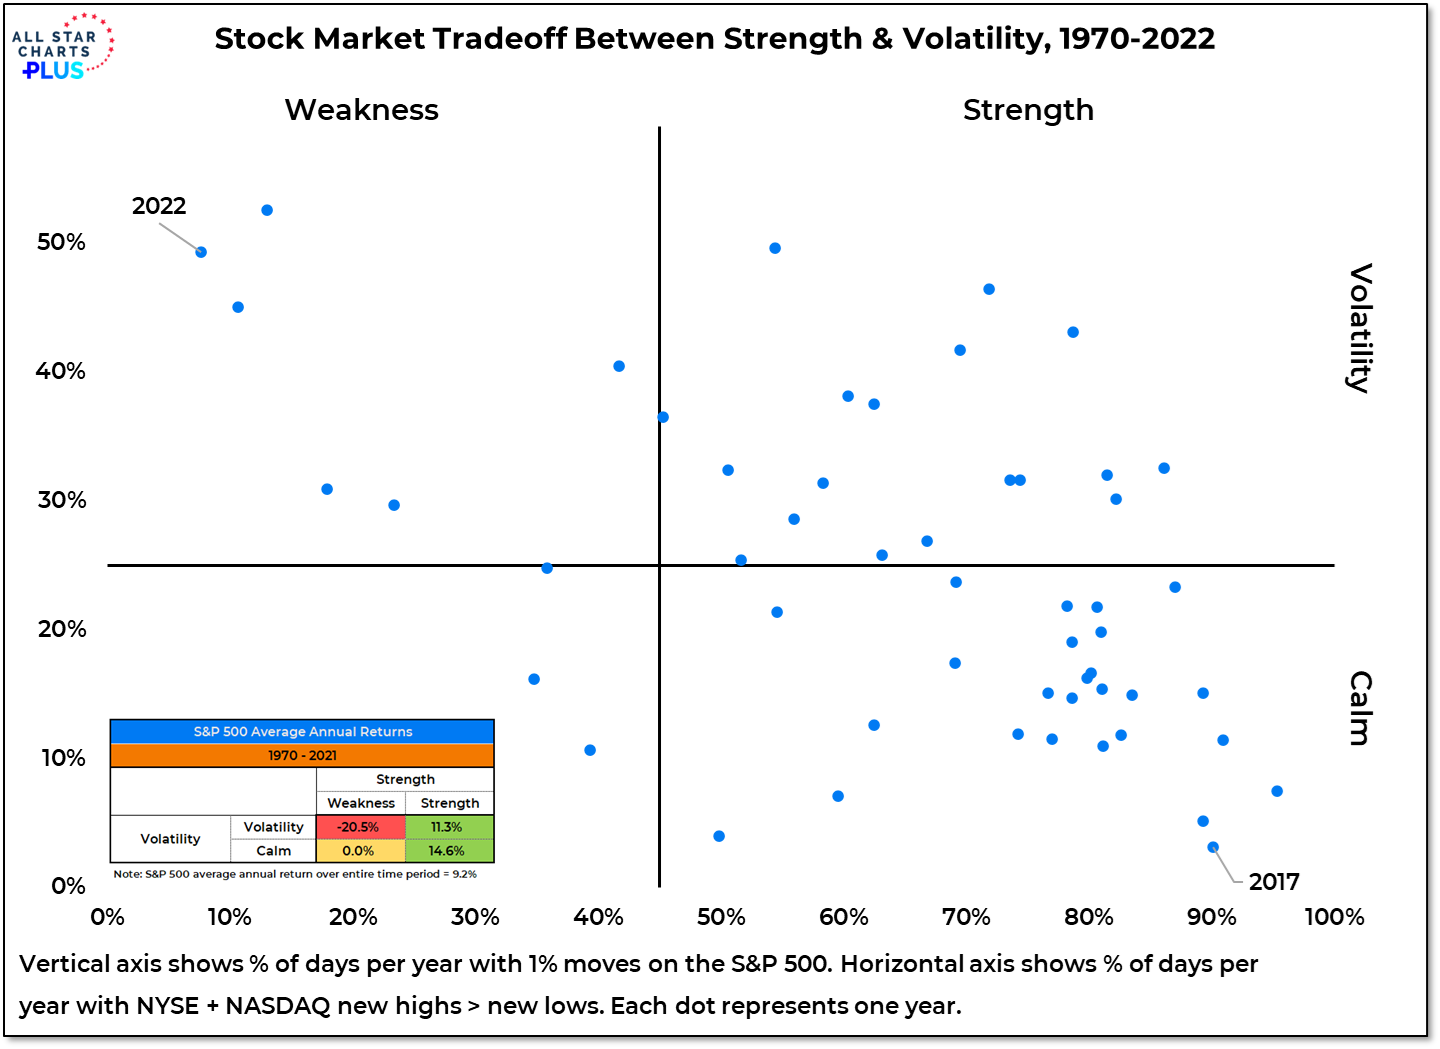
The S&P 500 just experienced its longest stretch without a 1% daily swing since Thanksgiving week 2021. But moving from volatility to calm is just part of the needed rotation. It will be difficult for bulls to stay optimistic if the market is not able to rotate from weakness to strength.
Why It Matters: Some of the most challenging years for the stock market in the past half century have had a combination of weakness and volatility similar to what has been experienced in 2022. The best gains have tended to come in years when the market has been calm and strength has been persistent. 2017 is a prime example of this. The recent ebbing in volatility provides some hope that conditions are improving and that the experience of the first three quarters of 2022 is receding into the past. The odds of a better market environment are greater on a shift from weakness to strength than from volatility to calm.
In this week’s Sentiment Report we take a closer look at the rise in optimism that has come as investors have responded to calmer conditions by hoping that sustained strength will soon follow.
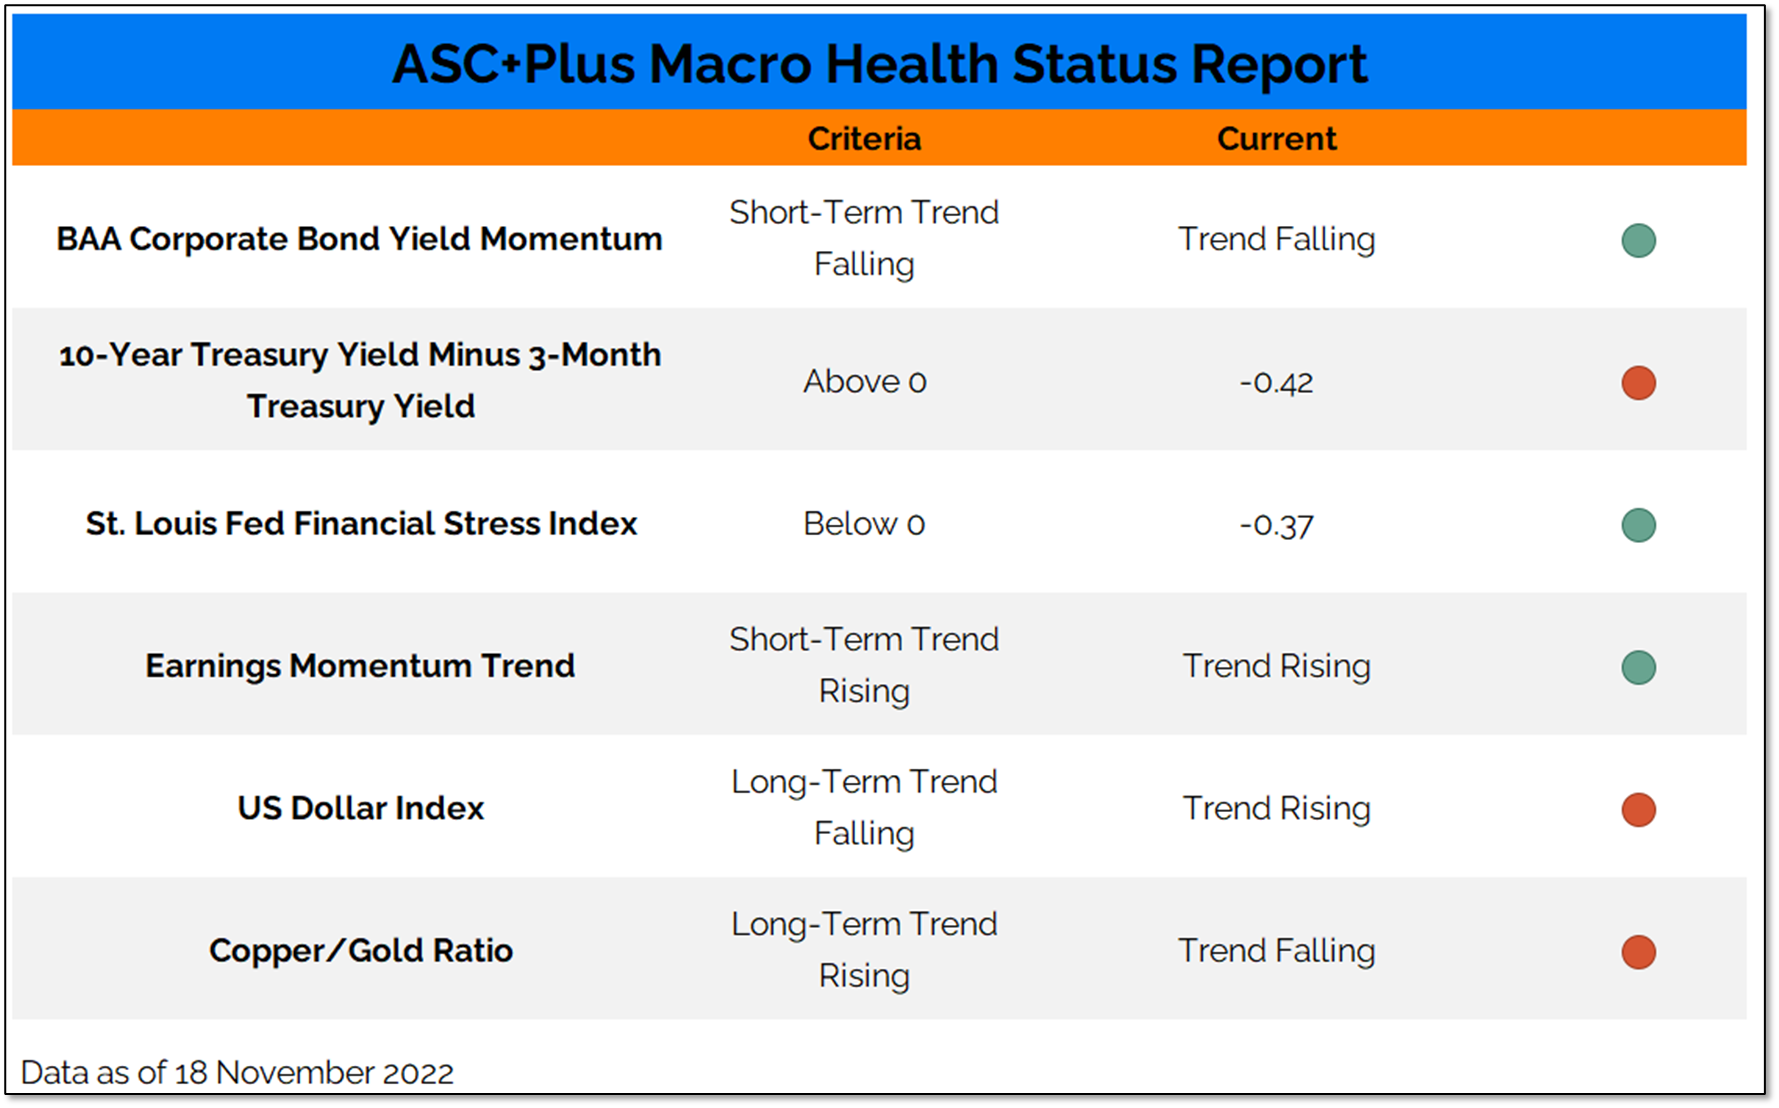
The yield curve is getting a lot of attention right now, and deservedly so. An inversion in the spread between the 10-year and 3-month Treasury yields has an unblemished record in anticipating recessions. But beyond that suite of indicators, there is actually evidence that macro conditions have stopped deteriorating.
Why It Matters: Despite a recent lull in day-to-day price swings, 2022 has been one of the most volatile and weakest years for stocks in the past half century. Whether those trends persist into year-end or strong post-midterm election seasonal tendencies have investors feeling less bruised and battered by year-end likely depends on macro conditions. This is not a question of whether conditions are good or bad, but whether they are getting better or worse. Since last month our Macro Health Status report has actually improved. More favorable corporate bond yield momentum and stability in the earnings momentum trend have helped offset the yield curve inversion.
Our Deeper Look dives into the components of our Macro Health Status Report – where we have seen improvement, where we have seen deterioration and where underlying trends have persisted.