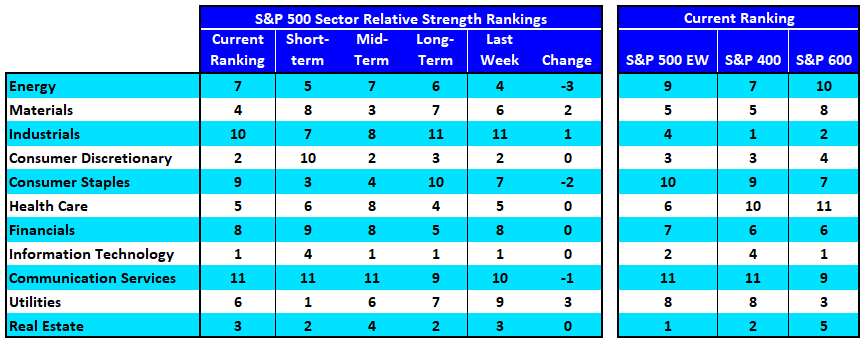
- Energy slipped three spots (from 4th to 7th) in the large-cap rankings last week, and the sector appears even weaker beneath the surface. It’s in the ninth spot on an equal-weight basis, and conditions are deteriorating within the mid-cap and small-cap energy space.
- Technology remains atop the overall rankings, but relative strength on a short-term basis is from coming from Utilities, Real Estate and Consumer Staples.
[PLUS] Weekly Top 10 Report
From the desk of Steve Strazza @Sstrazza
Our Top 10 Charts Report was just published.
In this weekly note, we highlight 10 of the most important charts or themes we’re currently seeing in asset classes around the world.
Stocks Test September Highs
The Dow Jones Industrial Average and the Dow Jones Transportation Average are both struggling at key Fibonacci extension levels from their 2018 drawdowns. Mid-caps and bank stocks are trapped back beneath key levels of overhead supply at their first-half highs. And the small-cap Russell 2000 is trading back toward the lower bounds of its year-to-date range. The majority of stocks are simply consolidating in holding patterns right now.
When we zoom in on the S&P 500, as we’ve done in the chart below, the importance of the September highs is hard to ignore. In November, price rallied to the first extension level from its fall drawdown. In the few weeks since, the index has retreated straight back to its prior peak near 4,540. For now, buyers are digging in and defending these pivot highs. Bulls need this level to hold if stocks are going to stop the bleeding and carve out a tradable bottom here. On the other hand, if sellers take control at this tactical polarity zone, we’re anticipating further downside.
[PLUS] Weekly Momentum Report & Takeaways
From the desk of Steve Strazza @Sstrazza
Check out this week’s Momentum Report, our weekly summation of all the major indexes at a macro, international, sector, and industry group level.
By analyzing the short-term data in these reports, we get a more tactical view of the current state of markets. This information then helps us put near-term developments into the big-picture context and provides insights regarding the structural trends at play.
Let’s jump right into it with some of the major takeaways from this week’s report:
* ASC Plus Members can access the Momentum Report by clicking the link at the bottom of this post.
[PLUS] Weekly Observations & One Chart for the Weekend
From the desk of Willie Delwiche.
While the Fed may be newly focused on inflation, the bond market does not appear to be similarly inclined. The yield on 30-year Treasury bonds this week has undercut its summer lows near 1.80% and the 10-year t-Note yield has dropped below the 1.40% level that has been important in the past. Moreover, the yield spread between 2’s and 10’s has dropped to its lowest level of the year. This drop in yields (reflecting strength in bonds) is not inconsistent with deteriorating equity market conditions seen beneath the surface (as well as increasingly at the index level). Coming about always carries risks, and the Fed is trying to change course in choppy waters.
[PLUS] Weekly Town Hall w/ Willie Delwiche
This is the video recording of the December 2nd Weekly Town Hall w/ Willie Delwiche
12/02/21 3:00 PM ET [Read more…]
Breadth Thrusts & Bread Crusts: Changing Course in Choppy Waters
From the desk of Willie Delwiche.
There’s no shortage of headlines this week — a potpourri of potentially market-moving developments.
And boy, have markets moved! Of course, these market gyrations are probably not quite for the reasons the headline writers have proposed. But we can leave that discussion for another day…
Today, I want to talk about when to change course and when to sit tight.
Let’s consider the recent comments from Fed Chair Powell on inflation and apply a lesson I learned when sailing on the waters of Lake Michigan.
[PLUS] Market Update
Stocks finished a volatile month of November in downbeat fashion, with breadth deteriorating and downside momentum expanding. Global equities bore the brunt of the weakness, though there was plenty of it to go around. Just one month removed from a new high in the All Country World Index (ACWI), a quarter of the country-level indexes that make up that composite finished November at new 12-month lows and only 10% were above their 50-day averages. Domestically, sector-level price, breadth and momentum trends showed a degree of weakness that in the past has been associated with index-level drawdowns of 7% or more and yet the S&P 500 finished November less than 3% from it’s all-time high.
[PLUS] Weekly Sentiment Report
From the desk of Willie Delwiche.
Key Takeaway: The bulls came out expecting strength but were served a healthy dose of volatility. What on paper is a historically favorable season has turned out to be quite the opposite. New highs quickly fell to the wayside and into the rearview mirror as participation crumbled beneath the surface. In the wake, investor optimism is now accompanied by a sobering caution. The need for repair beneath the surfaces is great for both domestic and international equities, and is necessary to re-build investor confidence. For now, there are no significant signs of pessimism emerging. But volatility and pessimism can be dangerous dancing partners, each leading the other to the edge of the dance floor.
Sentiment Report Chart of the Week: Investors’ Love Of Equities Undiminished
Investors continue to pile into equities. YTD ETF flows through November show equity funds attracting nearly $600 billion of inflows, with two-thirds of this heading toward US equities. Bond fund inflows are just shy of $200 billion. Commodities remain relatively unloved, seeing outflows on a YTD basis but actually recording modest inflows for the month of November.
- « Previous Page
- 1
- …
- 60
- 61
- 62
- 63
- 64
- …
- 104
- Next Page »