This is the video recording of the February 17th Weekly Town Hall w/ Willie Delwiche
02/17/22 2:00 PM ET [Read more…]
Expert technical analysis of financial markets by JC Parets
This is the video recording of the February 17th Weekly Town Hall w/ Willie Delwiche
02/17/22 2:00 PM ET [Read more…]
From the desk of Willie Delwiche.
I’m reading the book “Trillions” by Robin Wigglesworth right now. It’s about the rise of passive index investing – or, according to its sub-title, “How a band of Wall Street renegades invented the index fund and changed finance forever.”
It’s been an enjoyable read so far. I’m about halfway through the book and am excited to see how it finishes.
While Wigglesworth’s book has been written and published, the story of passive investing overall remains unfinished. If it is like other investing fads that have come and gone, some of the most exciting times (for better or worse) may lie ahead. History is littered with investment approaches that move from novelty to seemingly foolproof only to end in heartbreak and tears for those left holding the bag.
From the desk of Willie Delwiche.
Key Takeaway: Speculative excesses have been unwinding for a year and that has taken its toll on investor sentiment. The overall mood is characterized by a lack of optimism rather than rampant pessimism. This is consistent with the grind lower in many areas of the market since new highs peaked in February 2021. The damage done beneath the surface has only in recent months impacted the indexes, but if that impact intensifies a further expansion in pessimism would not be surprising. Benchmark 60/40 portfolios have gotten off to their worst start in a quarter century and our strategic positioning indicators continue to point to a high risk backdrop. If there isn’t much of a reward at the end of the volatility rollercoaster, passive participants may start to actively question whether the ride was worth it.
Sentiment Report Chart of the Week: Unwind Continues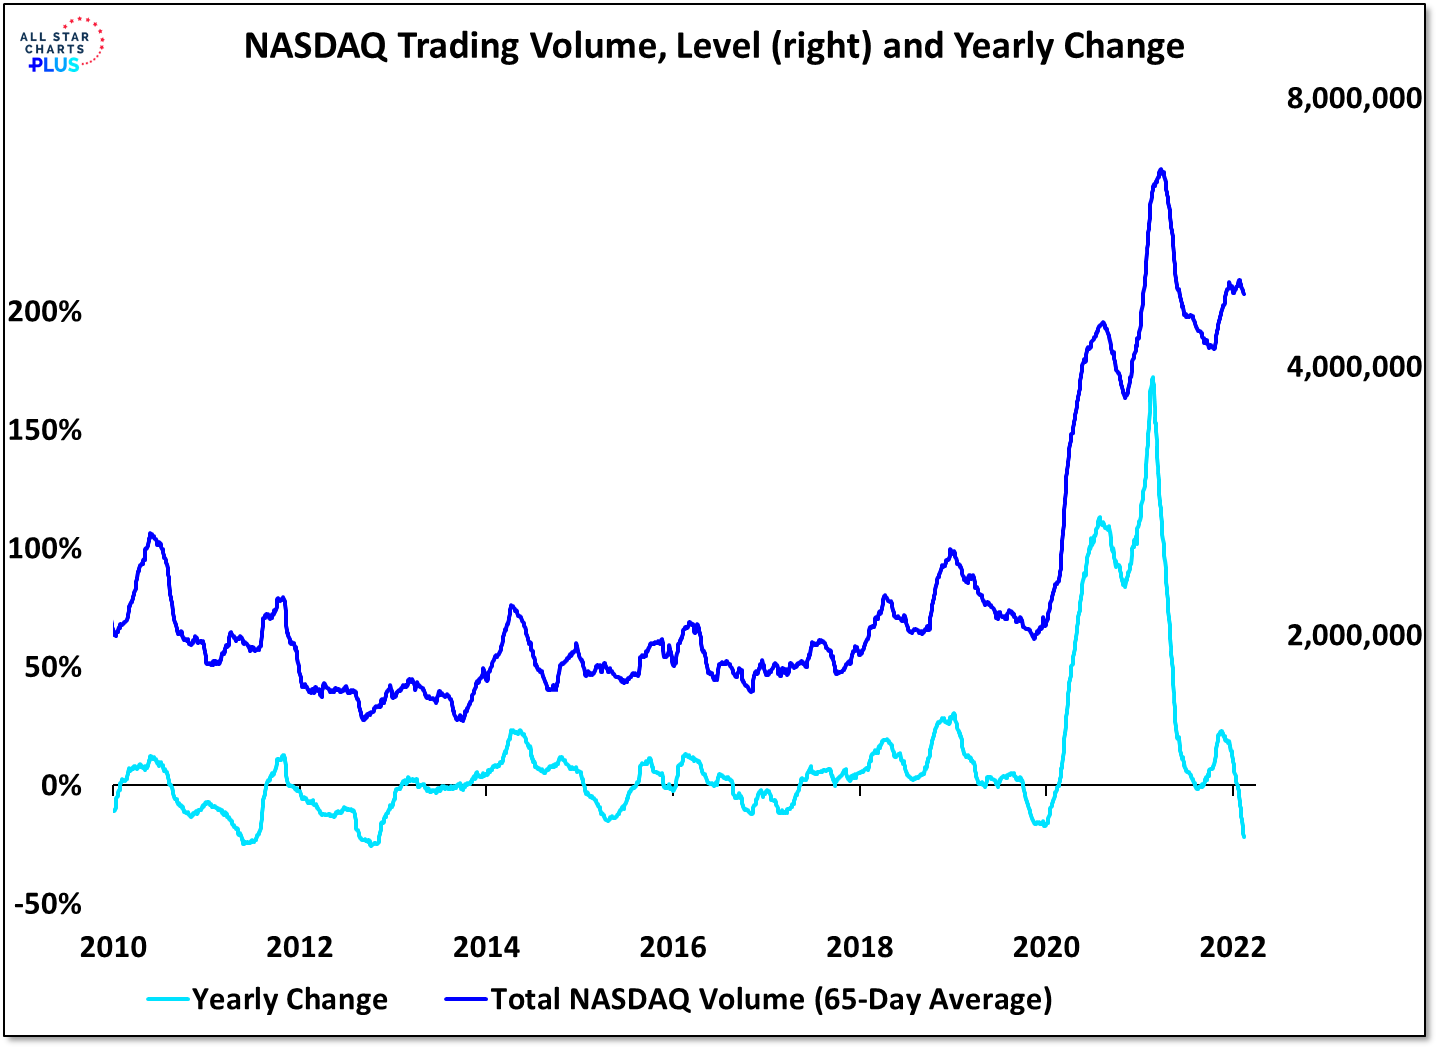
While the popular averages peaked more recently, there is plenty of evidence to suggest we are now a year into an unwind in speculative activity. This time last year, more than a quarter of the issues on the NYSE+NASDAQ were hitting new highs (the peak for the cycle) and NASDAQ trading volume was 150% higher than it had been the year prior. Fast forward to this year and we see half of the stocks on the NYSE and three-quarters of the stocks on the NASDAQ are down 20% or more from their highs (nearly half of the stocks on the NASDAQ have been cut in half). NASDAQ trading volume is 20% (and falling) lower than it was a year ago. Sentiment is sour and the risk appetite unwind continues. The question isn’t whether US stocks are going to enter a new bear market, but when they will emerge from the one that many find themselves in already.
Key Takeaways:
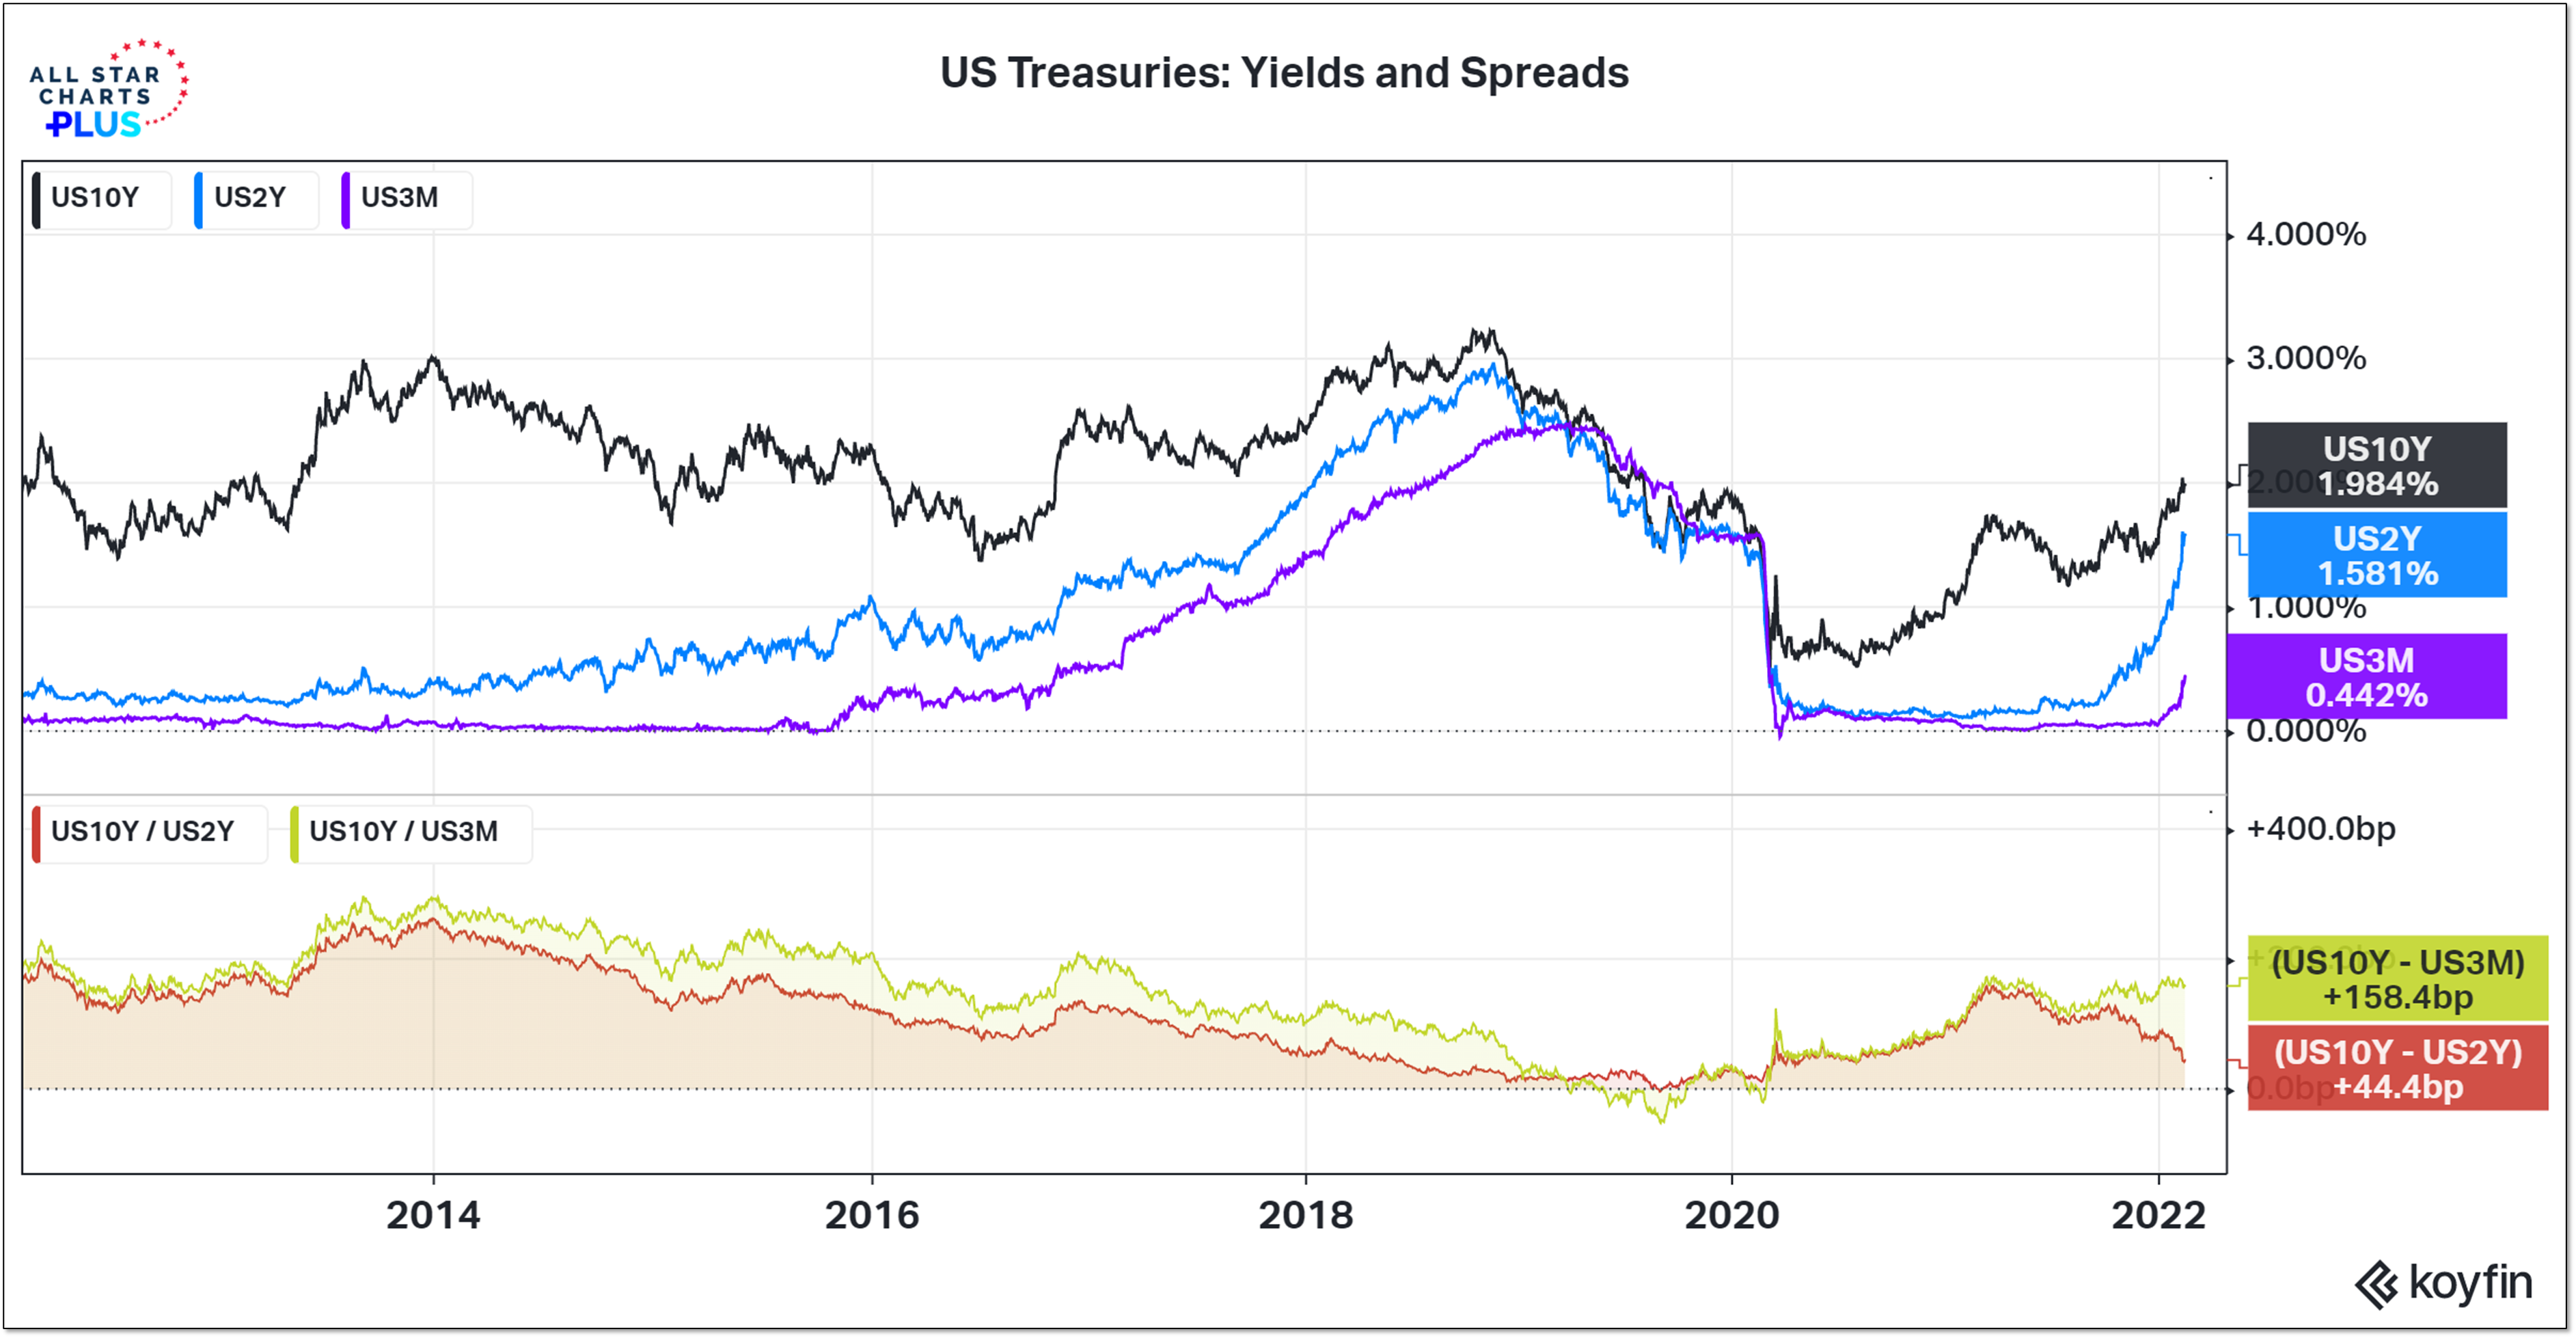
Developments in and around the Ukraine are dominating the headlines, but history shows that market turmoil brought on by geopolitical events tends to be short-lived. More meaningful and lasting developments are coming from the bond market as it adjusts to a Federal Reserve that appears intent to aggressively bring policy more in line with inflation. The Fed needs to catch up to inflation (and economic fundamentals generally) and the bond market needs to catch up to the Fed.
The 10-year yield reflects what the market thinks the economy can handle, the 2-year yield reflects what it thinks the Fed will do and the 3-month yield reflects what the Fed has done. It’s not uncommon for longer yields to move first and be followed by shorter-term yields. The dramatic narrowing of the spread between 10-year and 2-year T-Note yields in recent months reflects a Fed that has changed course and is focusing intently on inflation. That is the game of catch-up that is being played. I would be more concerned with 10-year yields dropping below 3-month yields than with 2-year yields rising toward 10-year yields.
From the desk of Willie Delwiche.
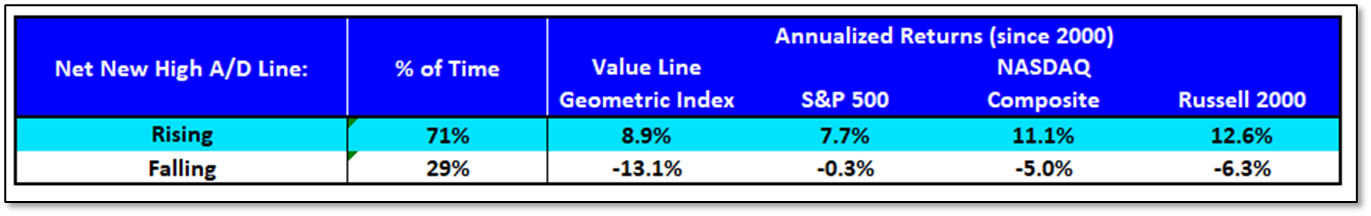
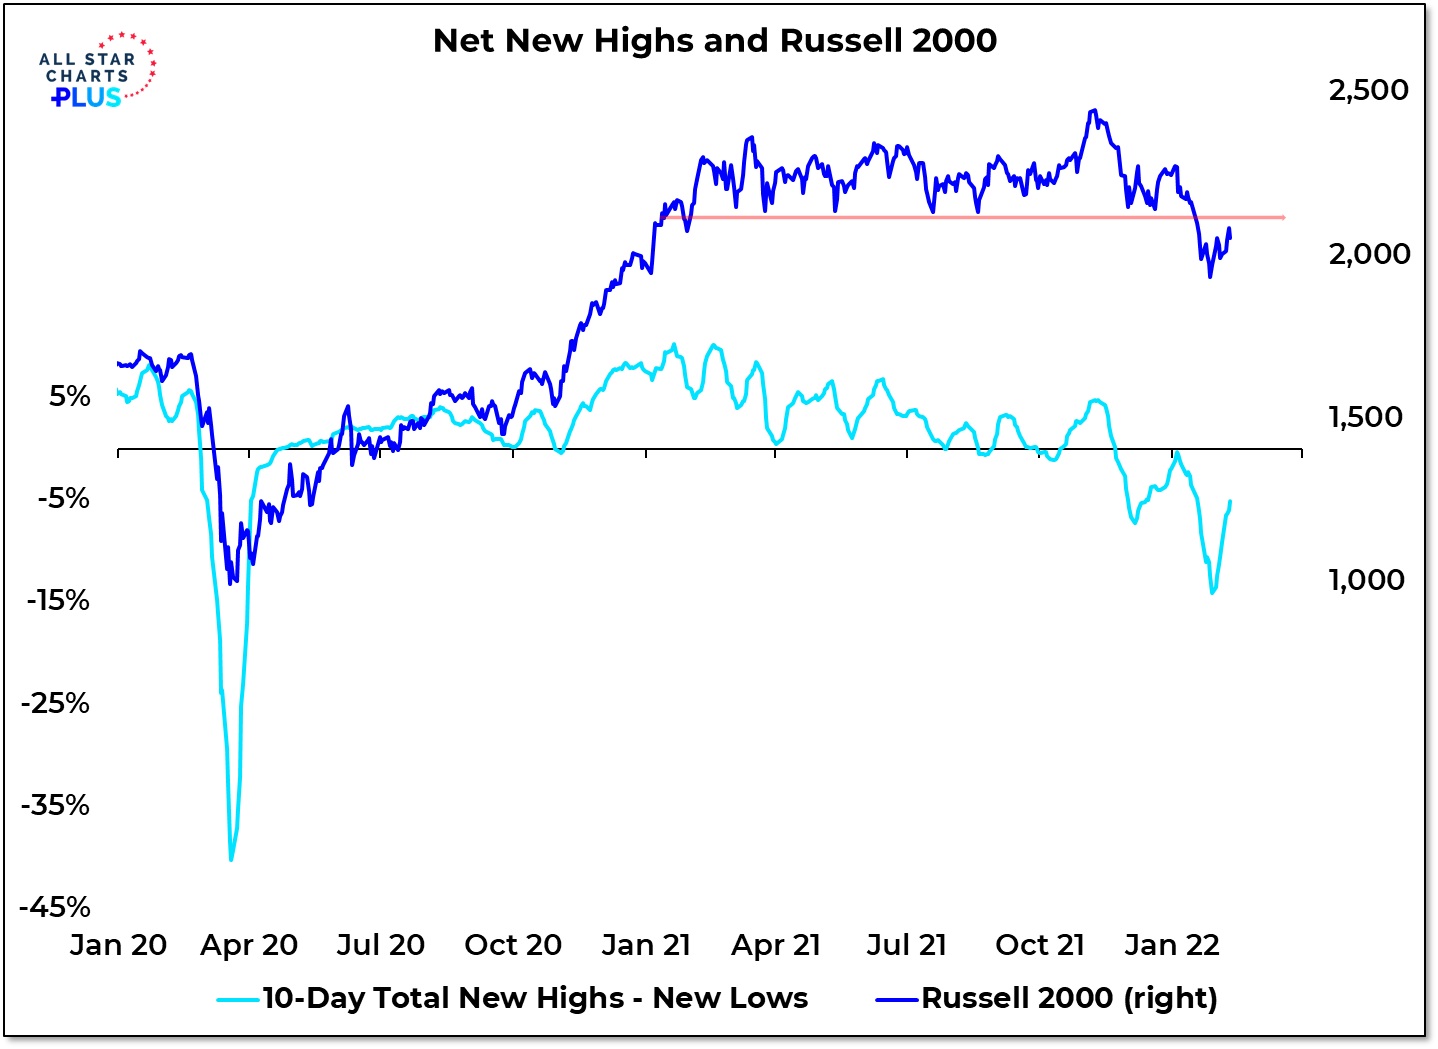
In the wake of the January sell-off, US stocks have been trying to get back in gear. So far that has been easier said than done. The initial rally attempt on the S&P 500 stopped short of the 50-day average and our sector trend indicator was unable to get back into positive territory. One telling sign that a churning/trading range environment remains intact is the new lows continue to outnumber new highs across the NYSE and NASDAQ. Since 2000 all of the net gains in the major US indexes have come in the 70% of the time that the net new high advance/decline line has been trending higher. Right now it’s been moving lower since mid-November – with less intensity than a few weeks ago, but lower nonetheless. It is exceedingly difficult for the indexes to make sustained upside progress when more stocks are making new lows than new highs.
From the desk of Steve Strazza @Sstrazza
Our Top 10 Charts Report was just published.
In this weekly note, we highlight 10 of the most important charts or themes we’re currently seeing in asset classes around the world.
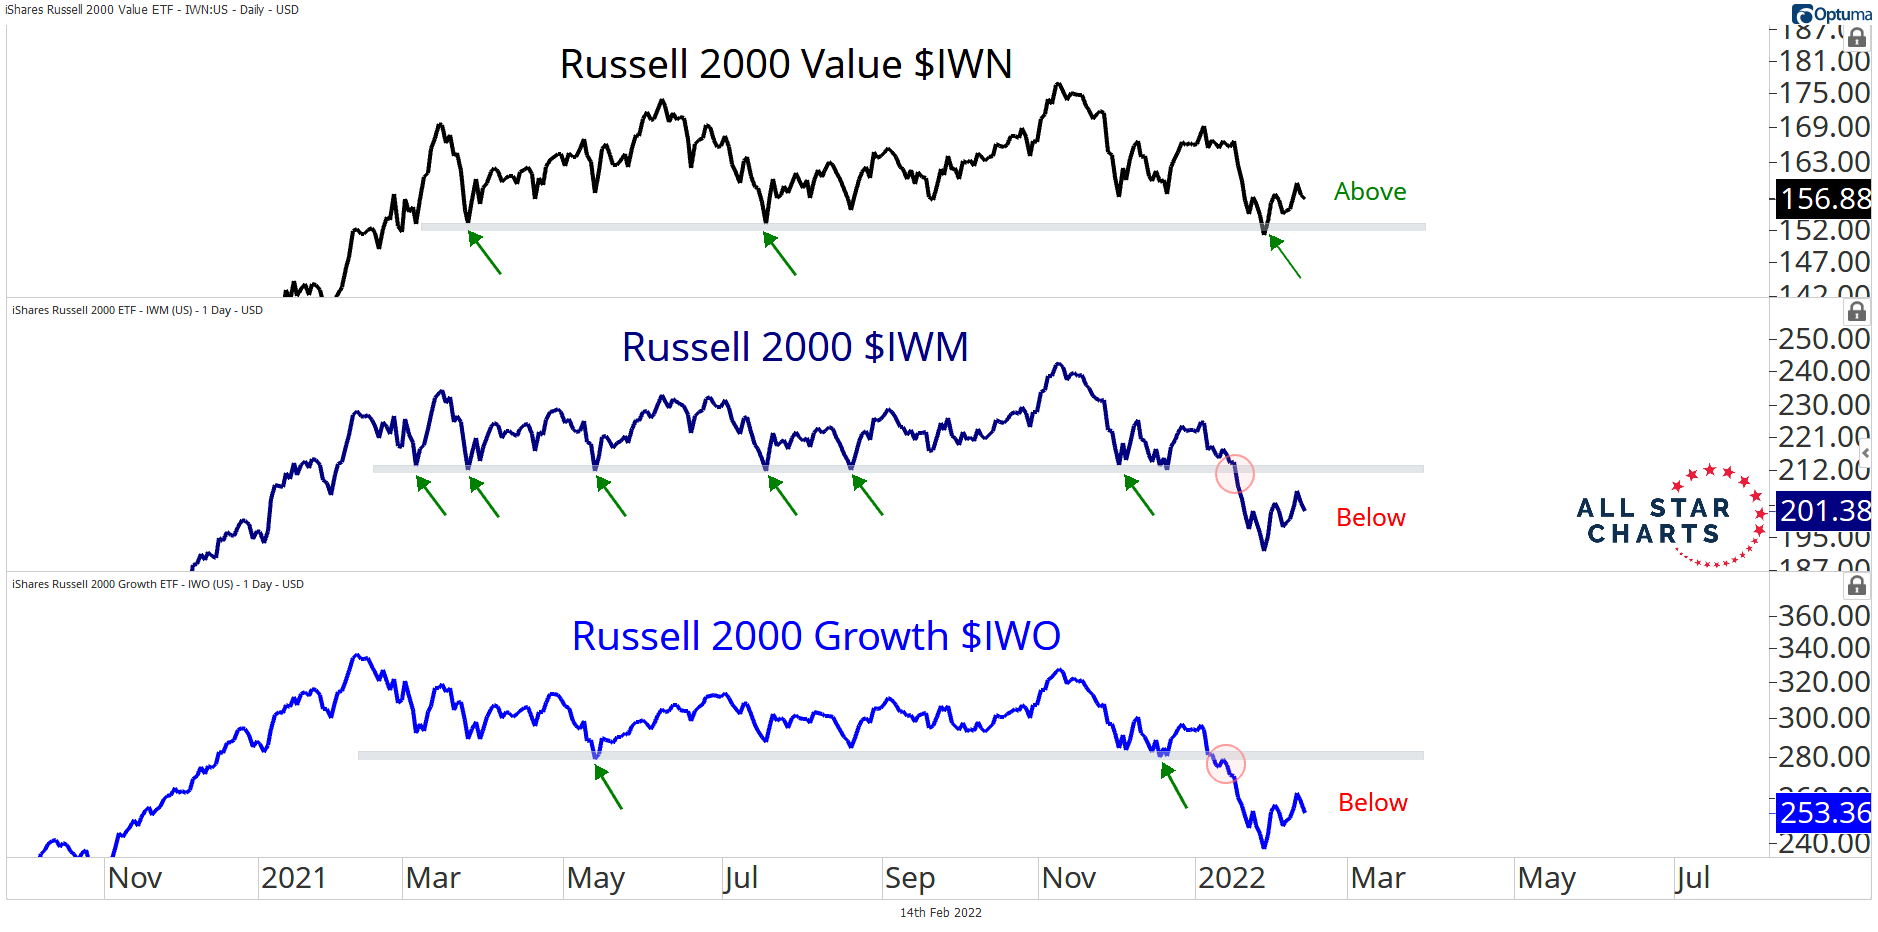
Finding Value Among Small Caps
We’ve been pounding the table on the importance of the 2021 lows for small caps. After consolidating for almost a year, sellers took control and knocked prices beneath this critical support zone last month. Until this level is reclaimed, risk is to the downside and we don’t want to own the Russell 2000. However, we can own small cap value stocks as they continue to show impressive relative strength. This is illustrated by the Russell 2000 Value ETF (IWN) holding above its former lows — unlike its peer indexes in the lower panes. This speaks to risk-seeking behavior and is another example of the cyclical leadership theme that is playing out across various markets. And just like we don’t want to be long the indexes that are beneath their 2021 lows, when it comes to individual stocks, we want to focus on those that are resolving their ranges higher for long opportunities.
From the desk of Steve Strazza @Sstrazza
Check out this week’s Momentum Report, our weekly summation of all the major indexes at a Macro, International, Sector, and Industry Group level.
By analyzing the short-term data in these reports, we get a more tactical view of the current state of markets. This information then helps us put near-term developments into the big picture context and provides insights regarding the structural trends at play.
Let’s jump right into it with some of the major takeaways from this week’s report:
* ASC Plus Members can access the Momentum Report by clicking the link at the bottom of this post.
From the desk of Willie Delwiche.
There are no magic indicators that are right 100% of the time, no silver bullets, no “one Ring to rule them all.” That’s why we spend so much time talking about weighing the evidence and looking at the behavior of risk on and risk off indicators. That being said, there are times when one indicator or another seems particularly relevant. That is now the case with the number of stocks making new highs and new lows on the NYSE+NASDAQ. The spread between new highs and new lows peaked in early 2021 and was fading (though stayed positive) for much of the year. The situation deteriorated in November and new lows started to outnumber new highs. Even as the indexes moved off of their January lows, we’ve continued to see more stocks making new lows than new highs. Since 2000 all of the net gains in the major US indexes (S&P 500, NASDAQ Composite, Russell 2000, Value Line Geometric Index) have come when the cumulative net new high list has been expanding. The bottom line is that history suggests the indexes could continue to struggle so long as new lows are outnumbering new highs.