Key Takeaway:
- Optimism fades as risk off reigns.
- Inflation hopes spring eternal.
- Beneath the global trends it’s Pax Britannica.
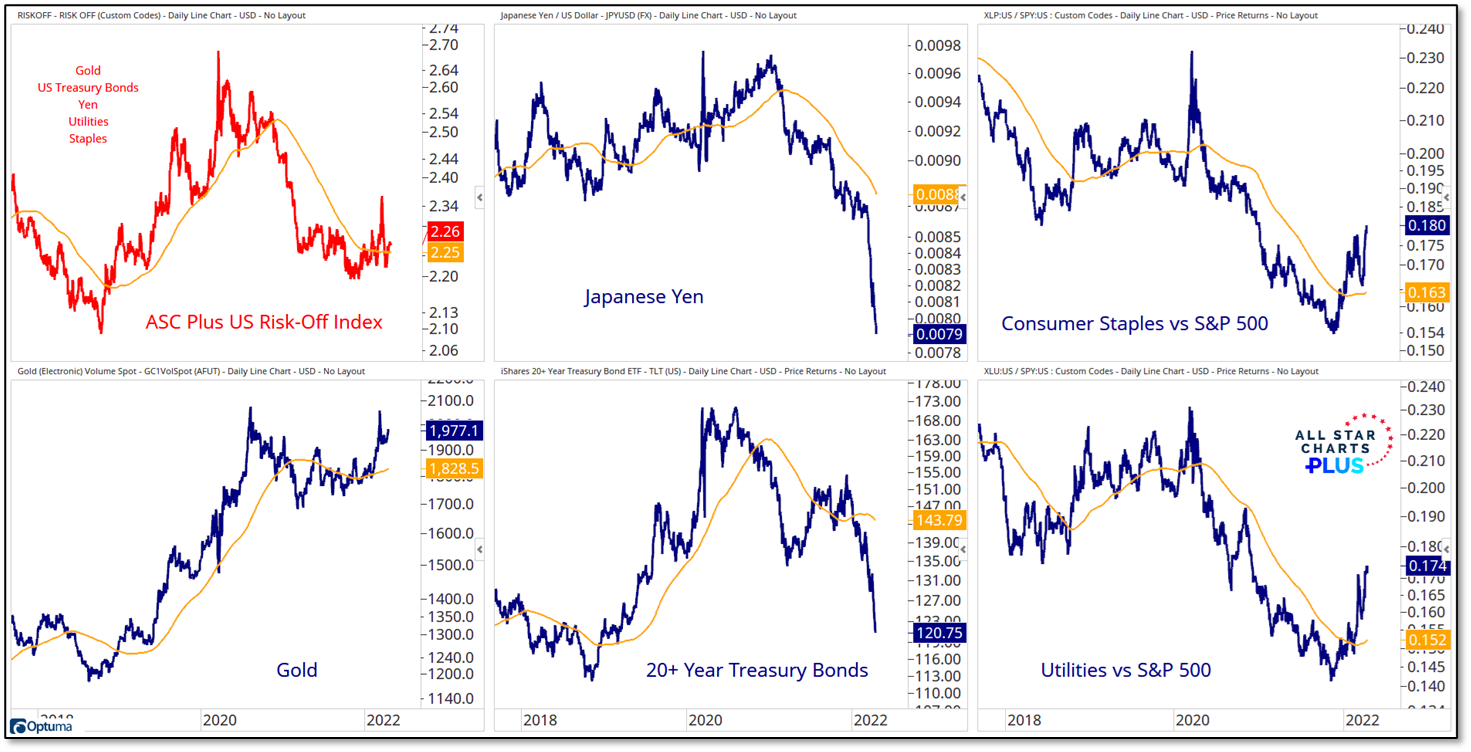
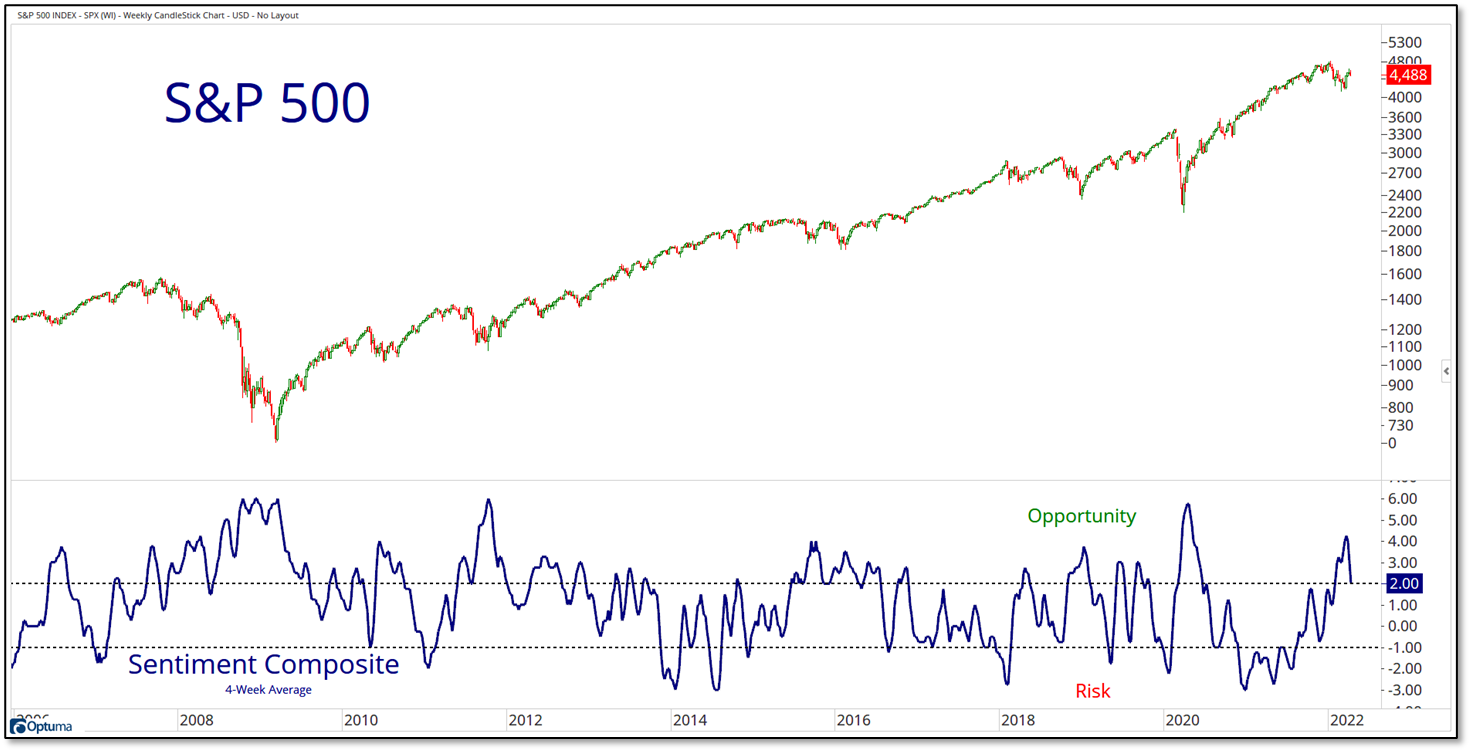
Expert technical analysis of financial markets by JC Parets
by Peter
Key Takeaway:
by Peter
This is the video recording of the April 14th Weekly Town Hall w/ Willie Delwiche.
04/14/22 2:00 PM ET [Read more…]
by Peter
From the desk of Willie Delwiche.
It’s easy to fixate on percentages when discussing and labeling market moves, especially when those moves are to the downside.
The S&P 500 can be 9.99% below its peak and you’ll hear nothing but crickets. Cross the 10% threshold and it’s a Correction. Cross the 20% threshold and banner headlines announce a Bear Market.
There are plenty of problems with this approach. A market environment where the S&P 500 is down 9.9% from its peak is likely not materially different from one where the index is down 10.1%. The same can be said on either side of the bear market threshold. Problems go beyond these arbitrary, specific thresholds.
The questions it raises reflect its lack of utility for everyone except headline writers: Is a market that is on its way to, but has not yet achieved a 20% peak to trough decline, in a bear market? Or is it still a bull market? And what happens after it enters bear market territory but nudges higher so that the peak to trough decline is now less than the 20% threshold? Is this still a bear market?
Pundits can wrestle with these questions. Historians can come in after the fact and put dates on market cycles (in the same way dates are put on economic cycles) after peaks and troughs are clearly established. Yet when trying to identify and operate within a market environment in real time, we don’t have those luxuries.
So how can we proceed?
by Peter
From the desk of Willie Delwiche.
Key Takeaway: Renewed selling pressure brings an air of disappointment rather than fear. Lackluster price action, an absence of a meaningful breadth thrust, and an overall risk-off environment leave little to spark an optimistic outlook. We’ve seen bears from a survey perspective, and that has created the conditions for a rally. Now, we need to see an increase in bulls if a rally is to materialize into a bull market. Without a rebound in price it’s hard for bulls to get excited and a v-shaped recovery in optimism (like we saw in 2019 and 2020) becomes less likely.
Sentiment Report Chart of the Week: Reversing From An Extreme
Sentiment is not always best used as a contrarian indicator. The way I learned it was to “go with the crowd until it reverses at an extreme.” In other words, when moving away from extremes go with the crowd. Our sentiment composite shows that pessimism has peaked at excessive levels and that represents an opportunity for investors. Now we need confirmation of this reversal in the form of increased optimism. The not-insignificant risk is that price volatility and elevated exposure to equities could lead to further unwinding and keep pessimism elevated for some time (2015/16 come to mind). In that case the bullish impact of a sentiment reversal could be muted.
by Peter
From the desk of Willie Delwiche.
Key Takeaways:
Last month’s equity market bounce was impressive at the moment. But it has failed to produce the sort of strength that argues in favor of a broadly-based “risk on” environment. Short-term upside surges have not been followed by breadth thrusts in our work. Despite a handful of days in which new highs outnumbered new lows, it has not been consistent. We are now at 20 consecutive weeks of more new lows than new highs and our 10-day net new high advance/decline line has been falling since November. Our weight of the evidence dashboard suggests a cautious approach remains warranted.
At this point, it seems evident that the degree of the March move higher was as much a function of the weakness that preceded it as anything else. We need to see evidence, from our “risk on – risk off” indicators as well beneath the surface of the indexes before concluding that we have moved beyond a market for managing risk. One example of such an improvement would be seeing the average stock (on the NYSE or NASDAQ) get closer to its highs than it is to its lows. Currently, the average NASDAQ stock is 15% above its lows but is still nearly 40% below its high. On the NYSE, the numbers are less extreme (the average stock is 18% above its low but 26% below its high) but are still tilted lower.
From the desk of Steve Strazza @Sstrazza
Our Top 10 Charts Report was just published.
In this weekly note, we highlight 10 of the most important charts or themes we’re currently seeing in asset classes around the world.
A Tale Of Two Markets
2022 has been a tale of two markets. On the one hand, cyclical stocks have shown impressive leadership as they continue to trend higher and make new highs. But then there are growth stocks which continue to lag significantly as they struggle to find a bottom. While this trend is really nothing new, it has accelerated notably in recent months. The bubble chart below is a great way to visualize the dispersion in performance between these two groups of stocks. Whether the leaders catch lower, or the laggards eventually play catch-up is something we’ll have to wait and see. But for now, the two are moving in opposite directions. As long as this is the case, we want to continue positioning ourselves in the strongest groups while staying away from the weakest ones.
From the desk of Steve Strazza @Sstrazza
Check out this week’s Momentum Report, our weekly summation of all the major indexes at a Macro, International, Sector, and Industry Group level.
By analyzing the short-term data in these reports, we get a more tactical view of the current state of markets. This information then helps us put near-term developments into the big picture context and provides insights regarding the structural trends at play.
Let’s jump right into it with some of the major takeaways from this week’s report:
* ASC Plus Members can access the Momentum Report by clicking the link at the bottom of this post.
by Peter
From the desk of Willie Delwiche.
Key Takeaway: