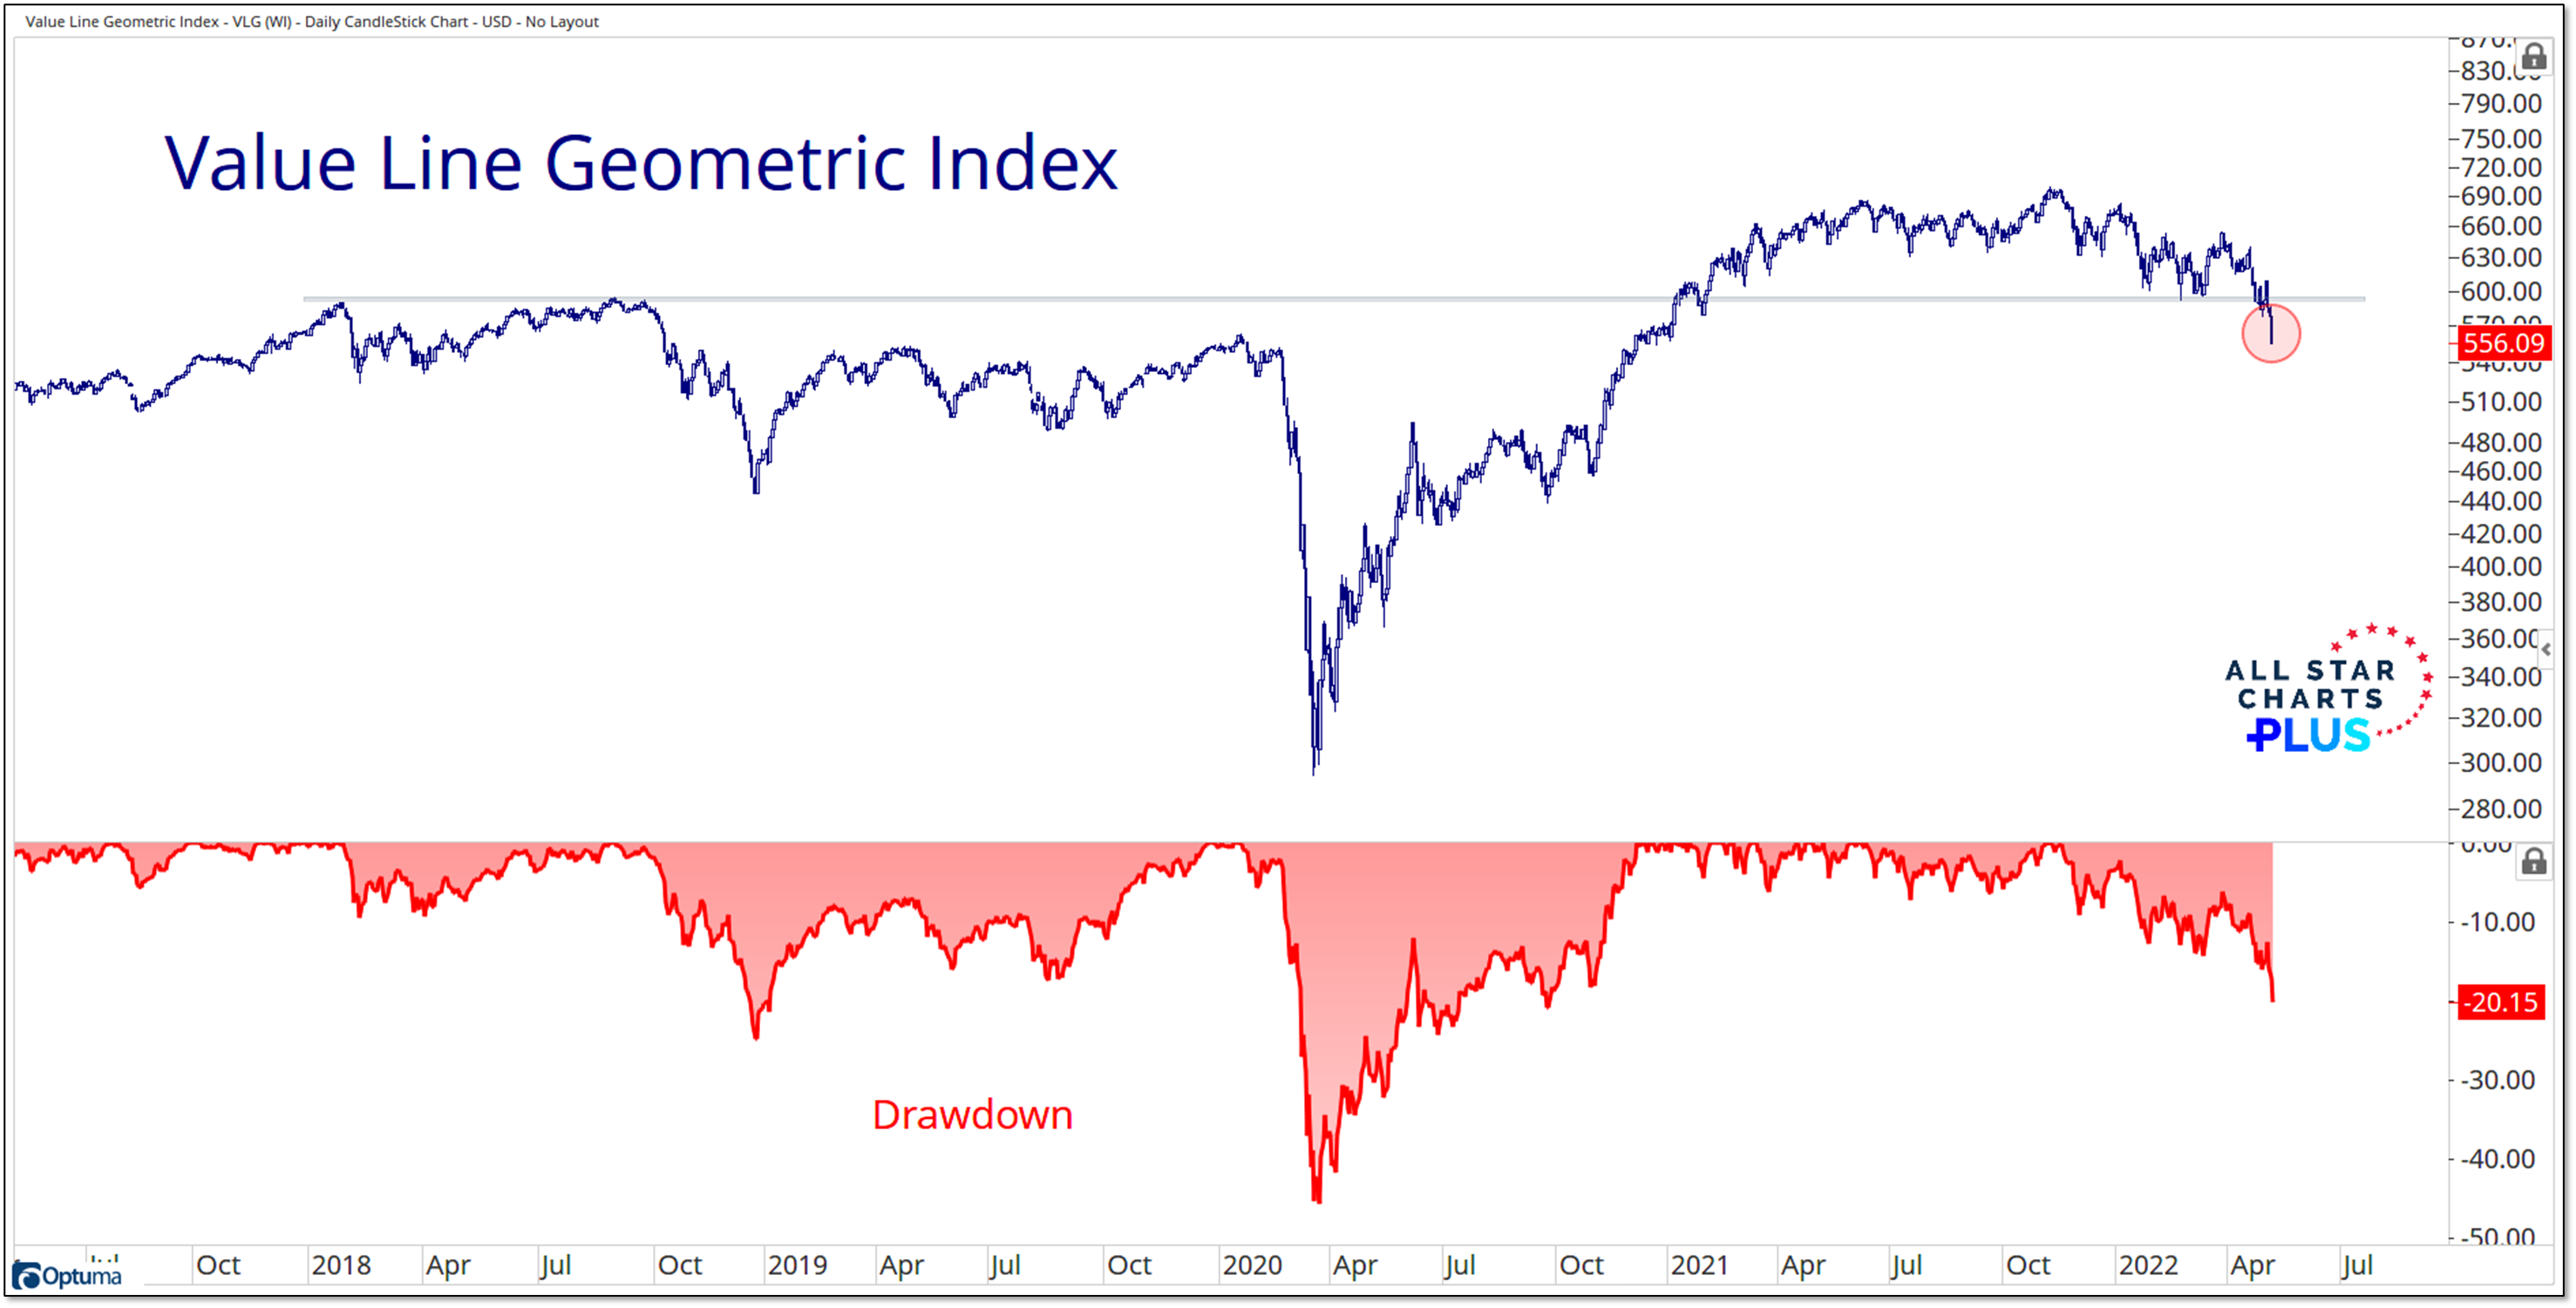
- A bear market has been evident beneath the surface (at least since late 2021, but in some ways for over a year). It’s now showing up in the indexes. The Value Line Geometric Index is below its 2018 highs (as well as its Jan 2020 pre-COVID peak) and is in a 20% drawdown (the line in the sand many use to identify bear markets).
- I understand the allure of trying to call a bottom in real-time (or close to it). But I’ll let the market sort that out. The crowd, focusing almost exclusively on their favorite sentiment data, has been doing that all year and so far at least, they have been wrong.
[PLUS] Weekly Market Notes & Breadth Trends
Key Takeaway:
- Volatility is taxing investor portfolios
- Stocks reckoning with new liquidity regime
- New lows are expanding as selling pressure crescendos
[PLUS] Weekly Momentum Report & Takeaways
From the desk of Steve Strazza @Sstrazza
Check out this week’s Momentum Report, our weekly summation of all the major indexes at a Macro, International, Sector, and Industry Group level.
By analyzing the short-term data in these reports, we get a more tactical view of the current state of markets. This information then helps us put near-term developments into the big picture context and provides insights regarding the structural trends at play.
Let’s jump right into it with some of the major takeaways from this week’s report:
* ASC Plus Members can access the Momentum Report by clicking the link at the bottom of this post.
[PLUS] Weekly Top 10 Report
From the desk of Steve Strazza @Sstrazza
Our Top 10 Charts Report was just published.
In this weekly note, we highlight 10 of the most important charts or themes we’re currently seeing in asset classes around the world.
Losing Value
Markets have been selling off indiscriminately since last week. Even the strongest stocks are under pressure as we’re seeing more and more indexes resolve lower from distribution patterns and violate critical support levels. An excellent example of this is the small cap value ETF (IWN). IWN has successfully defended its range lows for the past several months as its peers have broken down. Now that it has resolved to the downside too, we can add it to our growing list of completed tops. If the strongest can’t survive and hold their levels, what does that say about the rest of the market? Long story short, this action is not bullish.
[PLUS] Weekly Observations & One Chart for the Weekend
From the desk of Willie Delwiche.
Our weight of the evidence dashboard argues for caution, as risk outweighs opportunity. This is echoed by our Risk Off – Risk On indicators, which never showed a decisive move toward Risk On assets as stocks moved off their lows in March. Assessing the situation through the lens of various intra- and inter-market relationships, our range-o-meter shows a move toward Risk Off leadership over the past month. Risk Off assets are gaining strength, Risk On assets are stumbling. Where things go from here remains to be seen. None of us can predict the future. But we can identify whether we are in a higher risk or lower risk environment and adjust our portfolios accordingly. One of the best things I heard at last week’s CMT symposium came from Frank Teixeira: “The market gives you a lot of information if you are willing to listen for it.”
[PLUS] Weekly Town Hall w/ Willie Delwiche
This is the video recording of the May 5th Weekly Town Hall w/ Willie Delwiche.
05/05/22 2:00 PM ET [Read more…]
Breadth Thrusts & Bread Crusts: What I Picked Up At The Symposium: Five Things I Want To Keep, One I Want To Drop
From the desk of Willie Delwiche.
I had a great time in DC last week, first for some dedicated time with the All Star Charts team that is normally dispersed all over the world, and later at the CMT Symposium itself. There was good food and drink and great conversations – in larger settings and small.
As great as the presentations were overall, I often found myself chewing on asides and tidbits more than the large macro points. For me, the key insights were more about process and less about conclusions. Maybe that’s not surprising. Conclusions come and go based on market conditions. But process and approach should be consistent (though not immune from the refiner’s fire). I think Tyler Wood said it best last week, “We’re not predicting the future, just reacting responsibly.”
Things I picked up last week that I want to hold on to:
[PLUS] Weekly Sentiment Report
From the desk of Willie Delwiche.
Key Takeaway: At last week’s CMT Symposium, the lack of bulls and high number of bears on the AAII survey was probably the most oft-cited single statistic by the symposium speakers. This week’s data confirms that pessimism. II bears reached their third highest level in the past decade and put/call ratios haven’t been as high as they are now since the COVID crash. Beneath the surface, however, there is evidence that investors haven’t actually thrown in the towel. The AAII Asset Allocation survey for April shows that while they said they were bearish last month, individual investors were actually increasing equity exposure. The spike in the put/call ratios meanwhile has more to do with collapsing call volume than surging activity in puts. Bearish sentiment extremes are difficult to identify in real-time, that’s why it’s typically best to go with the crowd until it has reversed.
Sentiment Report Chart of the Week: What They Do > What They Say
The 4-week average of Bulls on the AAII survey (more on this later in the report) is at its lowest level in more than three decades. But while investors report a lack of confidence, their actions tell a different story. Asset allocation data from the AAII shows that investors actively increased equity exposure last month. It’s difficult to reconcile the idea of washed out sentiment with a public that is buying stocks. When there is a divergence between what they say and what they do, I put more weight on action than on talk.
- « Previous Page
- 1
- …
- 39
- 40
- 41
- 42
- 43
- …
- 104
- Next Page »