Key Takeaway:
- Patient investors will let the bulls prove their case.
- Economic risks on the rise as data disappoints.
- Central bank action adding pressure to market and economy.
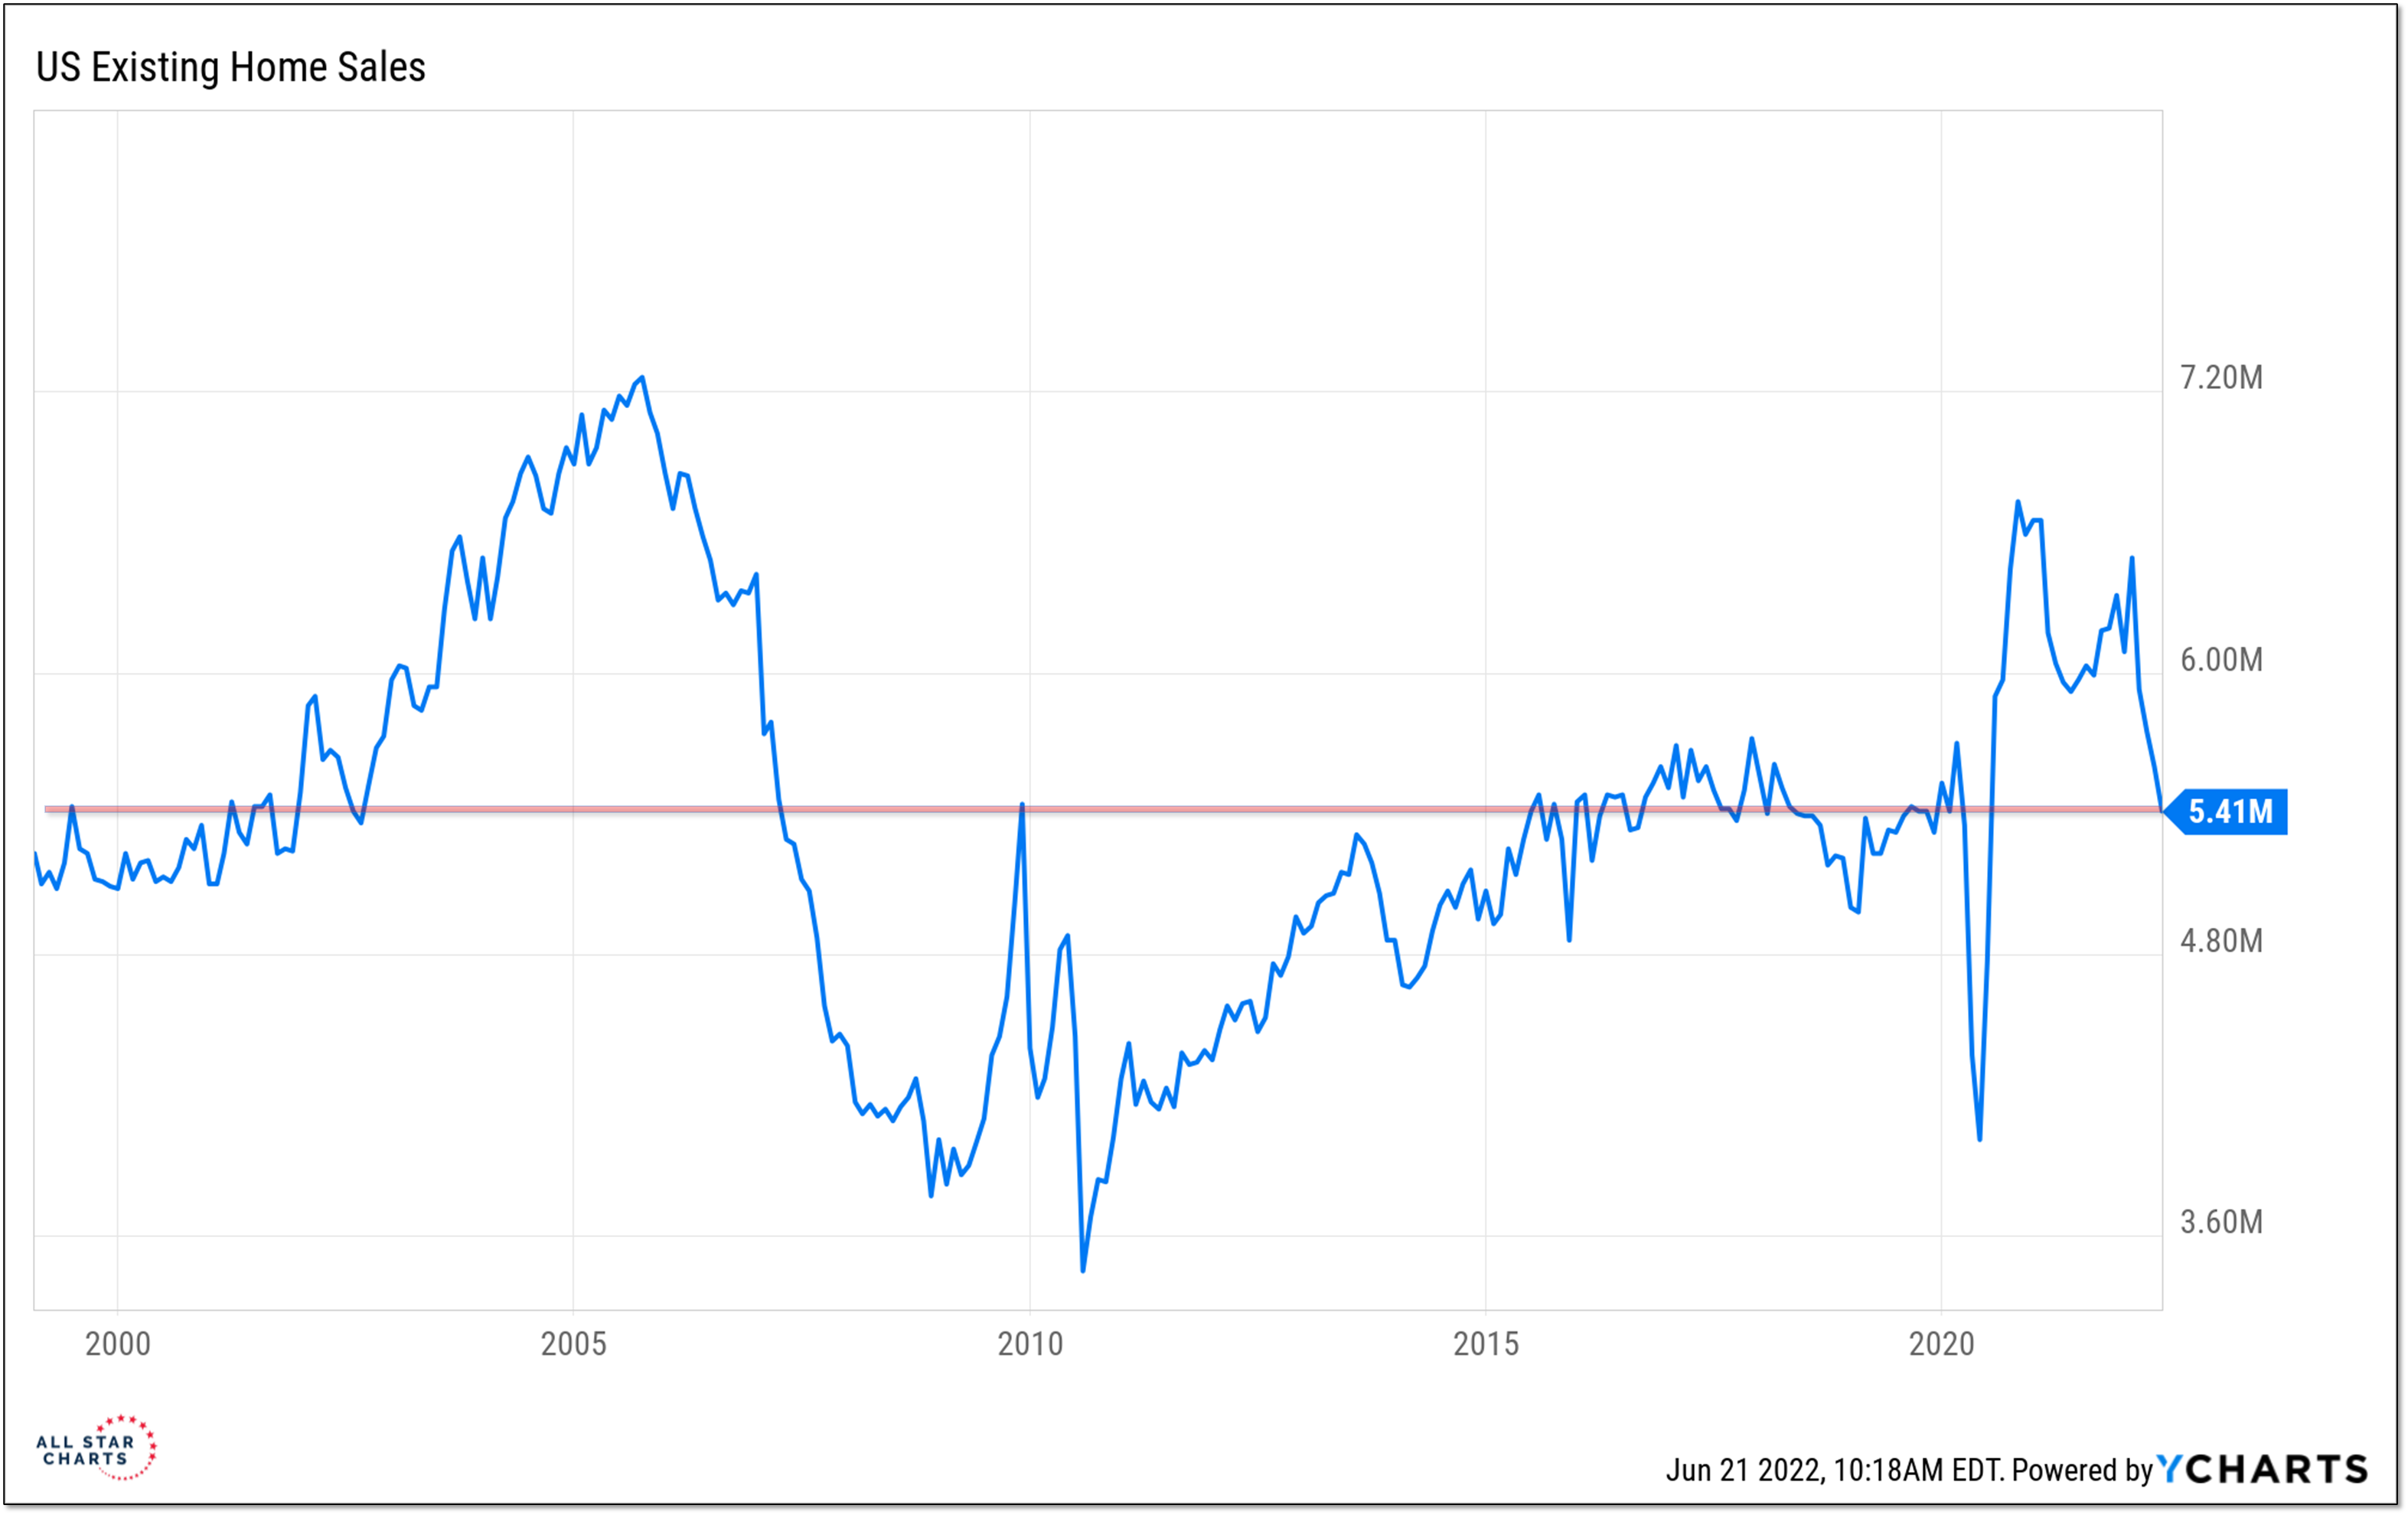
Expert technical analysis of financial markets by JC Parets
by Peter
Key Takeaway:
From the desk of Steve Strazza @Sstrazza
Our Top 10 Charts Report was just published.
In this weekly note, we highlight 10 of the most important charts or themes we’re currently seeing in asset classes around the world.
Structural Damage For Smalls
Equities all around the world are having a brutal start to the summer as selling pressure spreads across the board. All of the US major averages are completing tops and registering new closing lows.
The Small Cap Russell 2000 Index has been the weakest as IWM is currently testing a critical support zone at its 2018 and 2020 highs. We will be watching closely in the coming days to see how prices react to this area of former resistance turned support.
Bulls want to see this level hold. However, if price violates these former highs, we have to anticipate another leg lower and increased selling pressure for stocks more broadly. Seeing more and more risk assets fall back below their 2018 and 2020 highs is a big feather in the hat for bears. The S&P 500 is still about 7% above its 2020 highs of 3400.
From the desk of Steve Strazza @Sstrazza
Check out this week’s Momentum Report, our weekly summation of all the major indexes at a Macro, International, Sector, and Industry Group level.
By analyzing the short-term data in these reports, we get a more tactical view of the current state of markets. This information then helps us put near-term developments into the big picture context and provides insights regarding the structural trends at play.
Let’s jump right into it with some of the major takeaways from this week’s report:
* ASC Plus Members can access the Momentum Report by clicking the link at the bottom of this post.
by Peter
From the desk of Willie Delwiche.
Not sure where I first heard it, but I’ve always loved this saying: “Bull markets take you to levels you never thought you would see. Bear markets take you to levels you never thought you would see again.” Since the S&P 500 is now down more than 20% from its January peak, we are able to discuss bear market tendencies without getting the “yeah buts” from polite society. The S&P 500 is at levels not seen since late-2020, while the small-cap Russell 2000 is below its pre-COVID high back to where it was in early-2018. The Value Line Geometric index is also below its pre-COVID high and is at a level it first reached in early 2015. That is seven years of no progress for an index that serves as a proxy for the median stock.
by Peter
This is the video recording of the June 16th Weekly Town Hall w/ Willie Delwiche.
06/16/22 2:00 PM ET [Read more…]
by Peter
From the desk of Willie Delwiche.
Last week, it was cool and rainy in Milwaukee. This week, it’s been sunny and sweltering (with a few thunderstorms thrown in as well). Summer has definitely arrived as we approach the solstice and max daylight in the Northern Hemisphere.
With the heat we’ve had this week (several days in the 90s pushed our greenhouse temperatures to at least 120, which is as high as our thermometer measures), I’ve been sure to water the garden early and often.
by Peter
From the desk of Willie Delwiche.
Key Takeaway: Lower prices have a way of souring investor moods. It’s a relationship that thrives on the feedback loop it creates. Increased selling pressure begets pessimism that fuels continued selling pressure. With the recent relief rally behind us, short-lived optimism has dissipated and bearish sentiment is on the rise (II bull-bear spread challenges its lowest level since the GFC and Consensus bulls fall to their lowest reading since the Covid crash). It’s hard to claim sentiment is washed out as long as pessimism is still expanding. And based on the disparity between investor moods and positioning, there’s still plenty of gas in the tank for the bears.
Sentiment Report Chart of the Week: Household Liquidity Near Historic Lows
The Fed’s latest report on the Financial Accounts of the US (otherwise known as the Z.1) shows that household liquid assets increased by slightly more than 2% in the first quarter. Compared to total financial assets (which were down nearly 2% in the quarter), household liquidity improved slightly. Household non-equity liquid assets rose from 17.9% of total financial assets in Q4 2021 to 18.6% in Q1 2022. That Q4 2021 level was the lowest on record and the only times in history that it has been lower than it was in Q1 were 2021 and 2000. In other words, even with the slight uptick, household liquidity remains near historic lows. Despite what the sentiment surveys say, households remain heavily exposed to equities and have not moved to the sidelines in a meaningful way. With the news now out that stocks are in a bear market and likely to face continued pressure from rising rates and deteriorating economic conditions, the risk is that households will seek to improve their liquidity position by reducing equity exposure. The last time liquidity was this poor (2000) it took nearly a decade of sideways market action until the liquidity rebuild was complete.
by Peter
From the desk of Willie Delwiche.
It remains a risk off environment. With the indexes breaking down (S&P 500 at lowest level of the year and Value Line Geometric Index back to where it was in the Summer of 2017) and selling pressure intensifying, we are trimming our equity exposure. This helps increase our liquidity (which tends to be a scarce and valuable asset in periods of turmoil) and leaves us well positioned to lean into opportunity when our bull market re-birth checklist improves.