This is the video recording of the August 18, 2022, Weekly Town Hall w/ Willie Delwiche.
08/18/22 2:00 PM ET [Read more…]
Expert technical analysis of financial markets by JC Parets
This is the video recording of the August 18, 2022, Weekly Town Hall w/ Willie Delwiche.
08/18/22 2:00 PM ET [Read more…]
From the desk of Willie Delwiche.
I’ve got an old pair of Chaco sandals that I’m not ready to part with just yet. But the soles were becoming detached from the footbed, so I had to do a little repair work.
I glued them up and started thinking about rigging a clamp to provide even pressure to help the glue set. Catching sight of a couple of bricks laying nearby, I realized that these would work just fine for this type of job.
Would a well placed clamp or two have produced a more textbook repair? Perhaps. But the bricks I had at hand worked just fine for this.
From the desk of Willie Delwiche.
Key Takeaway: Permabulls will almost always complain about rallies being unloved, just as permabears never leave their refrain that downside risks are under appreciated. That is the prism through which they view the world. In the current situation, complacency is rising and optimism is building, both from low levels. After the buying panic seen in the NAAIM data in July, we saw something similar in this week’s data from Consensus Inc (the largest one-week increase in optimism in over a decade). Even though bears still outnumber bulls on the AAII survey, equity ETF inflows are heating up. The shift from excessive pessimism to increased optimism is the most bullish part of the sentiment curve and that is where we find ourselves. Breadth thrusts and surging momentum are cherries on the top.
Sentiment Report Chart of the Week: Strong Momentum Doesn’t Usually Just Evaporate
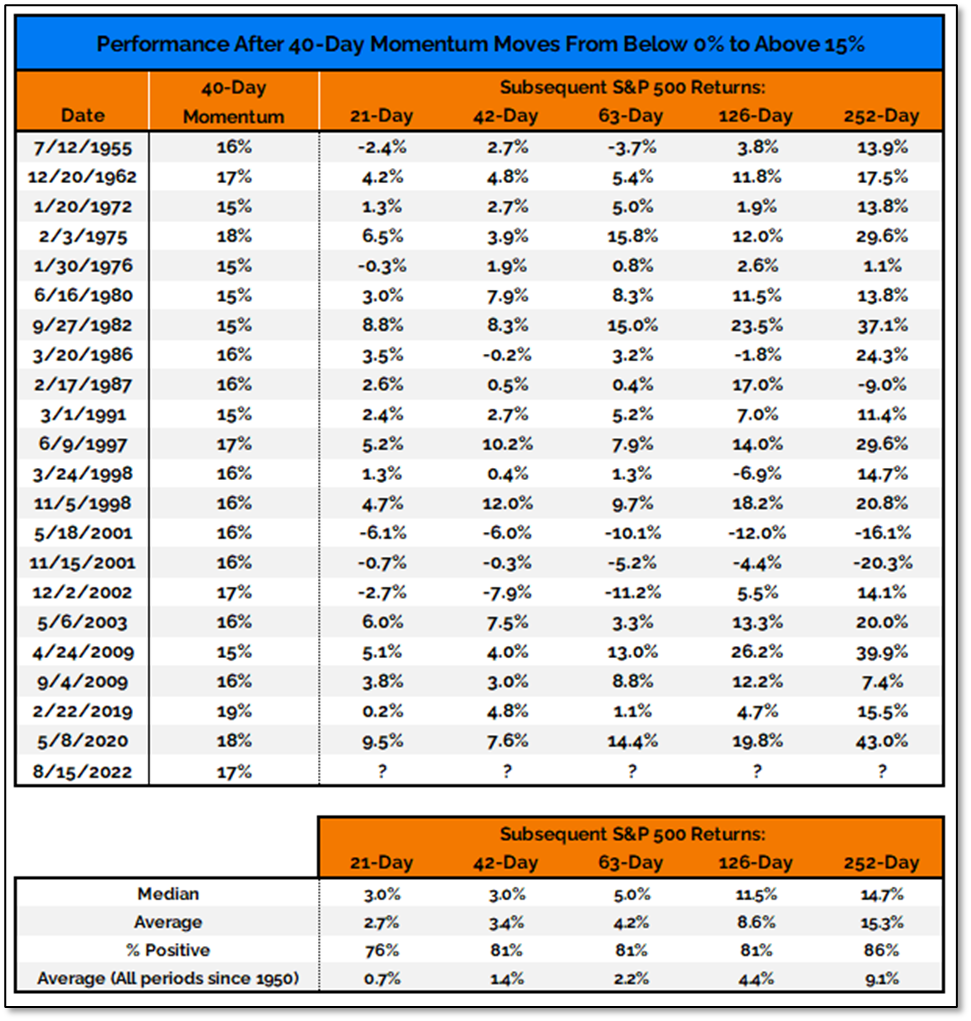
This study looks at instances of 40-day momentum surging from below zero to above 15%. There are exceptions to every rule, and the signals here are no different. 1987 was a mixed bag of strength and weakness, and the bursting of the Tech Bubble coupled with the 9/11 terrorist attacks and ensuing recession prevented the market from building on the momentum surges in 2001. But overall when we have seen momentum spike higher in the past it doesn’t usually evaporate overnight. Rallies have tended to persist as strength begets strength. That is a message investors seem to be hearing right now.
Breadth is improving and our bull market re-born checklist has satisfied two more of its criteria. We are moving off the sidelines and getting more involved, increasing equity exposure in both the Cyclical and Tactical Portfolios and staying in harmony with current leadership trends.
Key Takeaways:
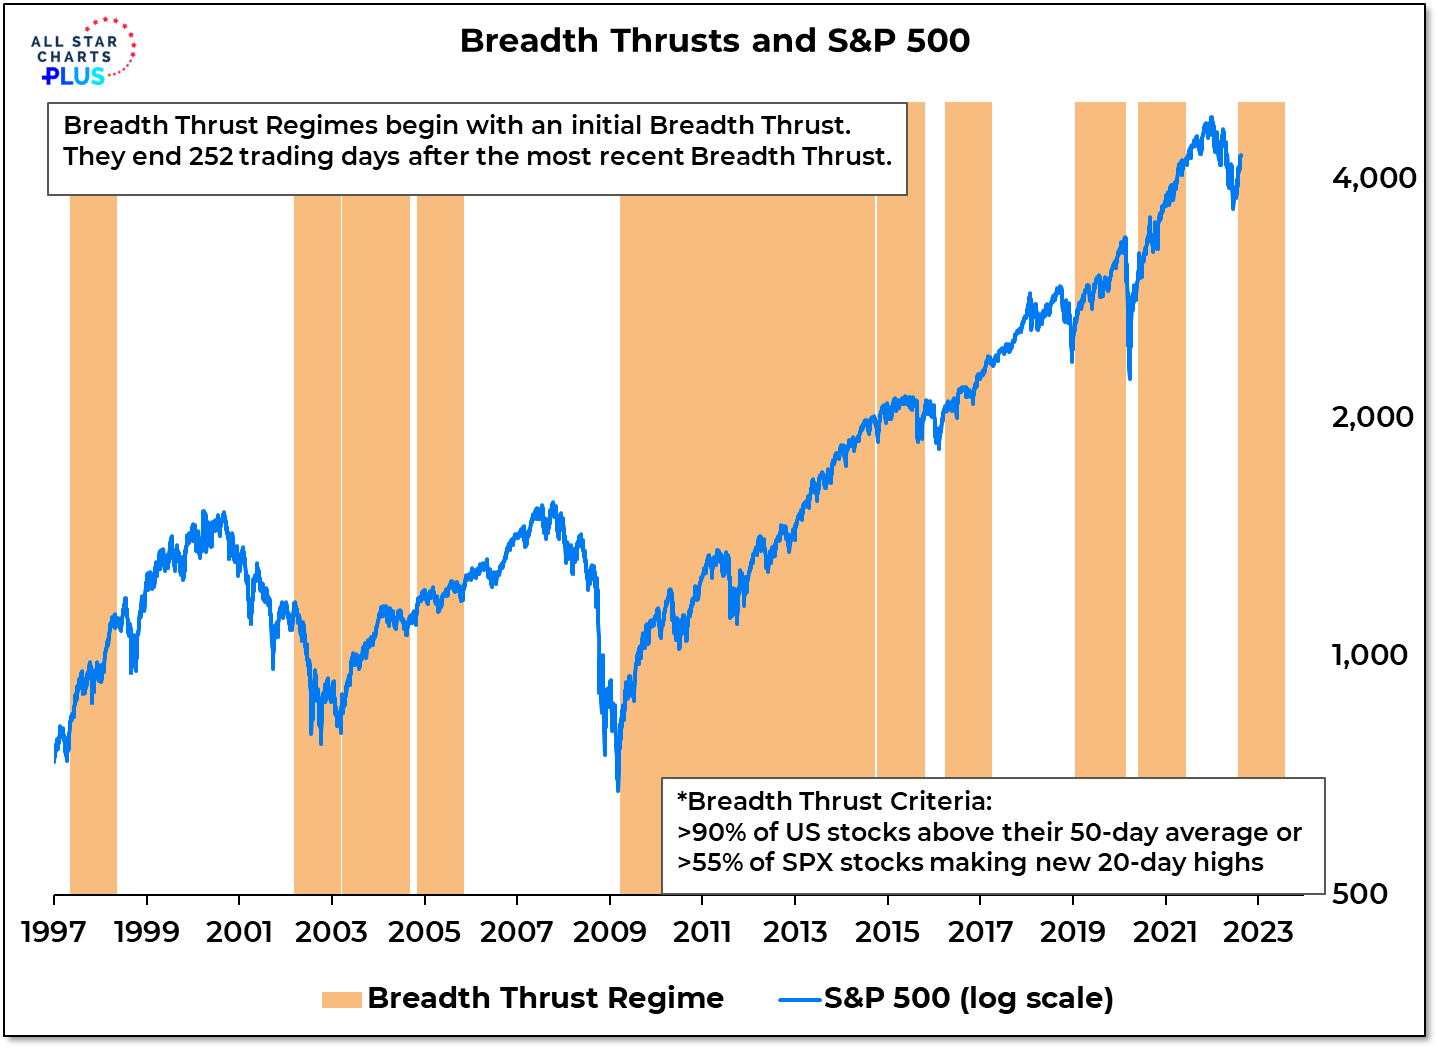
The first half of 2022 was a great time to be on the sidelines, letting the bulls and bears bloody themselves in the market. Last year saw the previous breadth thrust regime expire in June and by November more stocks were making new lows than new highs. As 2021 turned to 2022, fewer and fewer world markets were showing any strength. The second half of the year is shaping up to be a different story, with a breadth thrust in July and a sharp expansion in the percentage of world markets trading above their 50-day averages, the conditions that have fueled all of the net gains in the S&P 500 in the past 40+ years are now present.
We have compared the market action over the first half of 2022 to the behavior of the market following the peak in Q4 2007. While the price action has been eerily similar, the breadth thrust in July makes continuing along this path a less likely outcome. This isn’t discounting macro concerns as much as it is trusting the evidence that we have in hand. As significant as some of the rallies were in 2008, none were able to produce a breadth thrust. Seeing less volatility in the indexes and more strength beneath the surface over the remainder of the year would be further evidence that the June lows marked an important turning point.
From the desk of Steve Strazza @Sstrazza
Check out this week’s Momentum Report, our weekly summation of all the major indexes at a Macro, International, Sector, and Industry Group level.
By analyzing the short-term data in these reports, we get a more tactical view of the current state of markets. This information then helps us put near-term developments into the big picture context and provides insights regarding the structural trends at play.
Let’s jump right into it with some of the major takeaways from this week’s report:
* ASC Plus Members can access the Momentum Report by clicking the link at the bottom of this post.
From the desk of Steve Strazza @Sstrazza
Our Top 10 Charts Report was just published.
In this weekly note, we highlight 10 of the most important charts or themes we’re currently seeing in asset classes around the world.
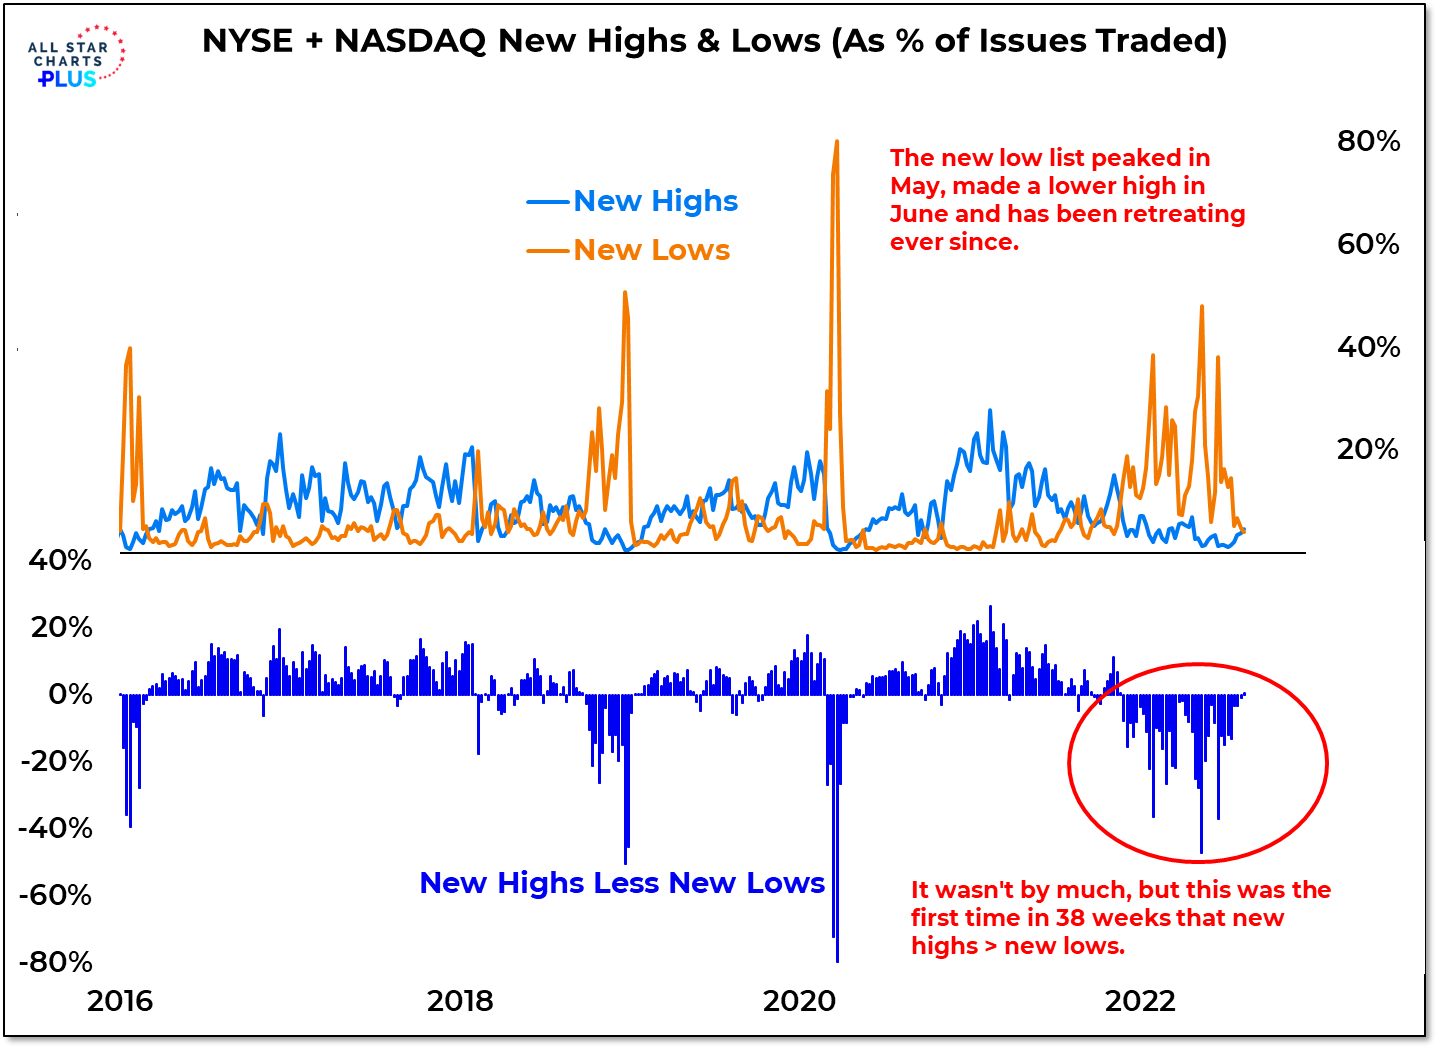
New Lows Streak is Over
One thing that has been consistent this year is seeing more stocks hit new lows than new highs. We’ve witnessed this kind of bear market behavior every single week of 2022. Up until now, that is. For the first time all year, more stocks made new highs than new lows last week. This is a huge development because if the market truly bottomed and we’re in the early stages of a new uptrend, we’re going to need more new highs than new lows. It’s just math. Following 37 straight weeks of net new lows, seeing this streak come to an end is yet another big piece of evidence in favor of the bull camp.
Key Takeaway:
Breadth thrusts are firing, participation is expanding and for the first time this year new high lists are longer than new low lists. From the perspective of market internals, the rally over the past two months could hardly have been stronger.
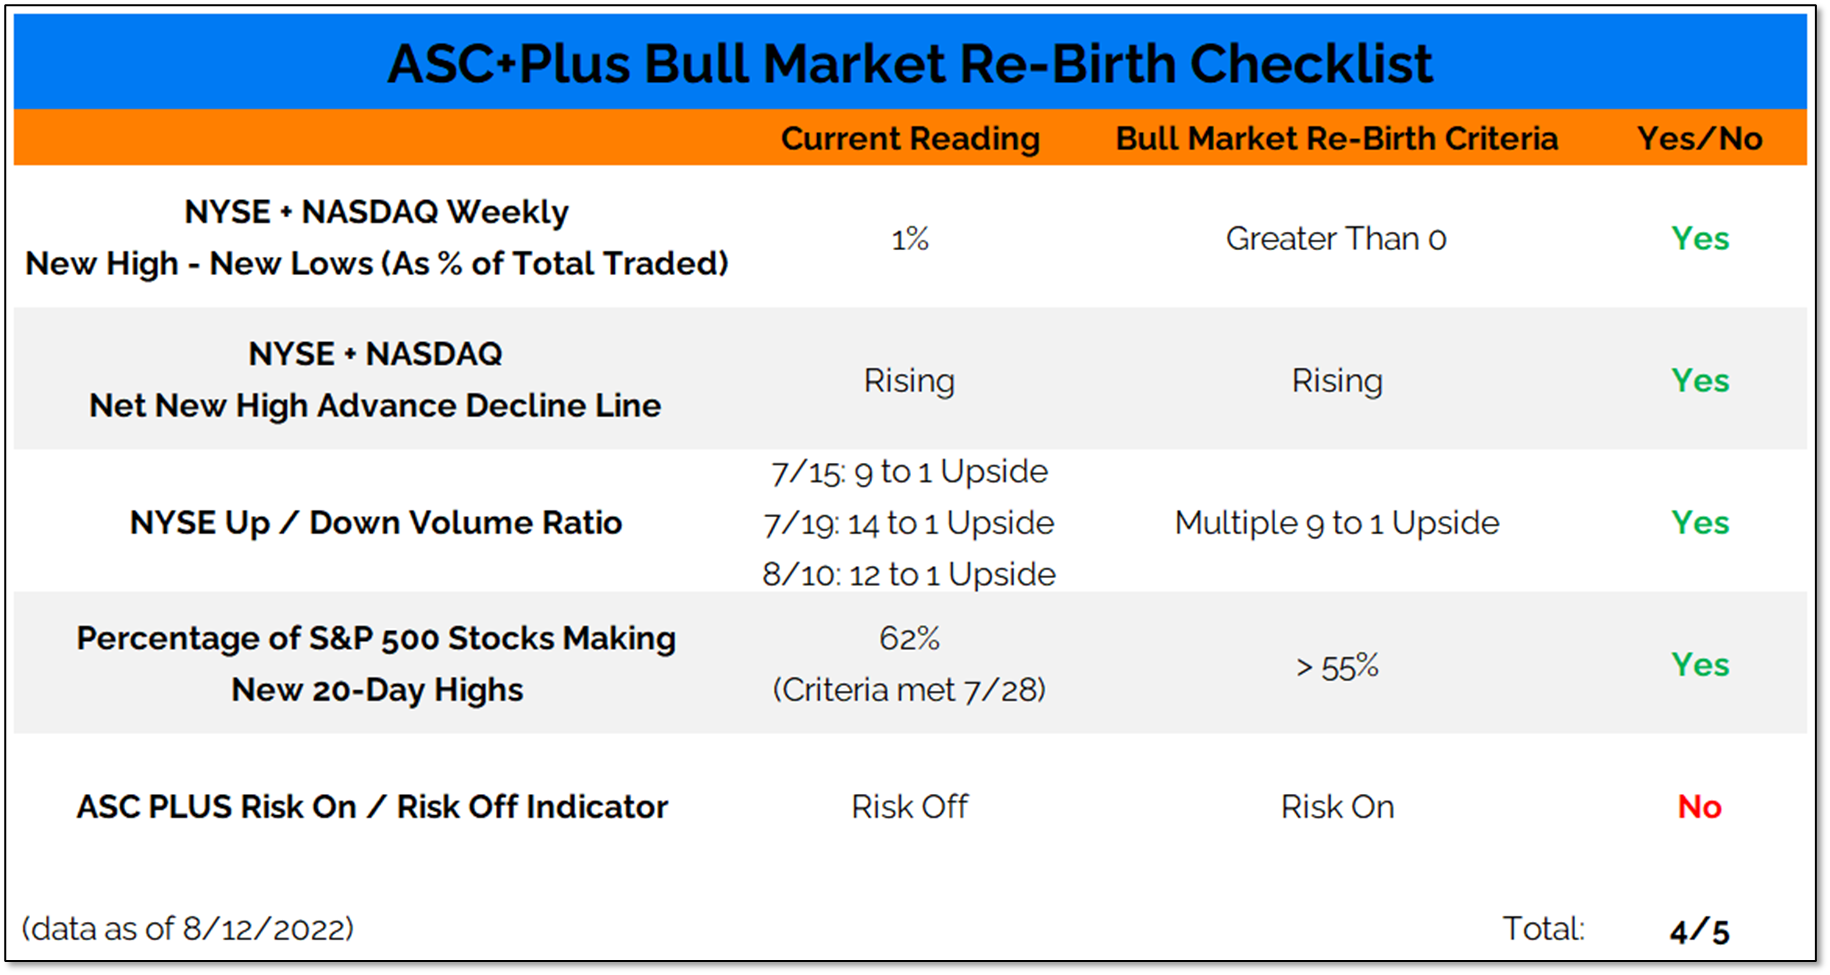
This strength is showing up in our bull market re-birth checklist. July brought upside volume thrusts and the first breadth thrust (based on the percentage of stocks making new 20-day highs) in over two years. Last week brought to an end the string of 37 consecutive weeks of more new lows than new highs on the NYSE+NASDAQ. The trend in our net new high advance/decline line also turned higher.
Our bull market re-birth checklist has now had 4 out of 5 the criteria met. While this does not preclude periods of consolidation and testing, it does strengthen the case that a durable low has been made.