This is the video recording of the September 8th, 2022, Weekly Town Hall w/ Willie Delwiche.
09/08/22 2:00 PM ET [Read more…]
Expert technical analysis of financial markets by JC Parets
This is the video recording of the September 8th, 2022, Weekly Town Hall w/ Willie Delwiche.
09/08/22 2:00 PM ET [Read more…]
From the desk of Willie Delwiche.
This All Star Charts +Plus Monthly Playbook breaks down the investment universe into a series of largely binary decisions and tactical calls. Paired with our Weight of the Evidence Dashboard and our Playbook Chartbook, this piece is designed to help active asset allocators follow trends, pursue opportunities, and manage risk.
From the desk of Willie Delwiche.
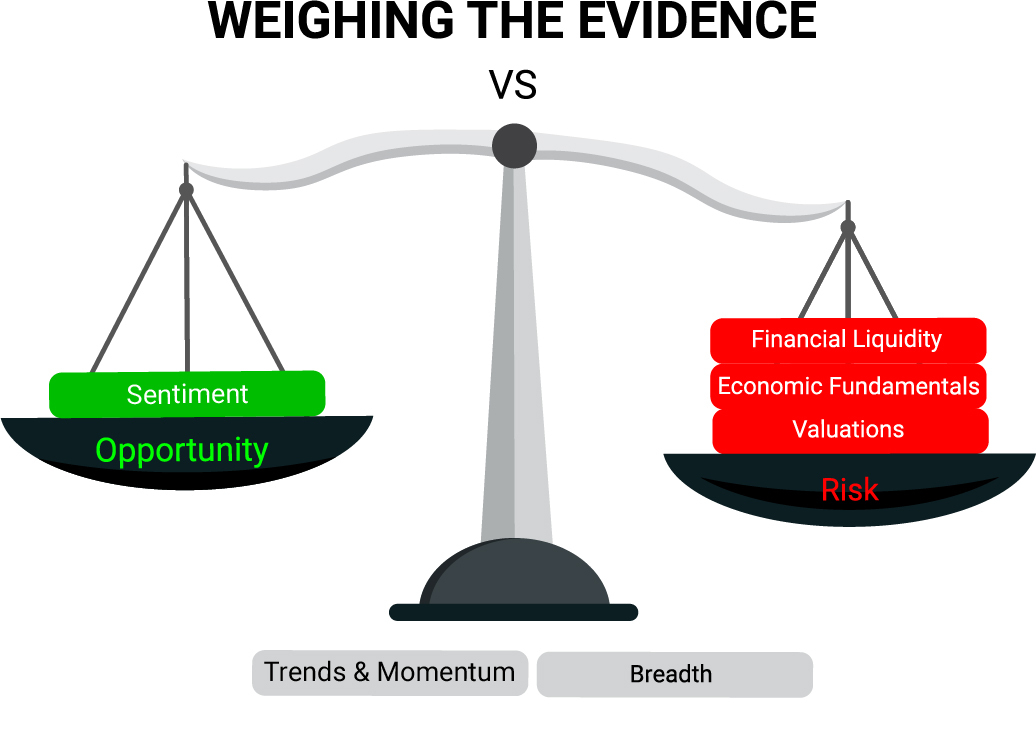
Key Takeaway: Despite the stock market’s reluctance toward sustained advances, investors have refused to throw in the towel. The bulls showed up last month, declaring their intent by triggering short-term breadth and momentum thrusts. Yet, as impressive as the display of strength was, they’re still waiting for the market to respond. Or at least the response they were hoping for. We would expect oversold conditions to reverse quickly after strong upside momentum and broadening participation. That hasn’t happened yet and bulls are showing signs of getting discouraged. If the relationship between investors and stocks isn’t going to be a two-way street, the likelihood of a broader and deeper sentiment re-set increases.
Sentiment Report Chart of the Week: Investors Not Giving Up On Stocks
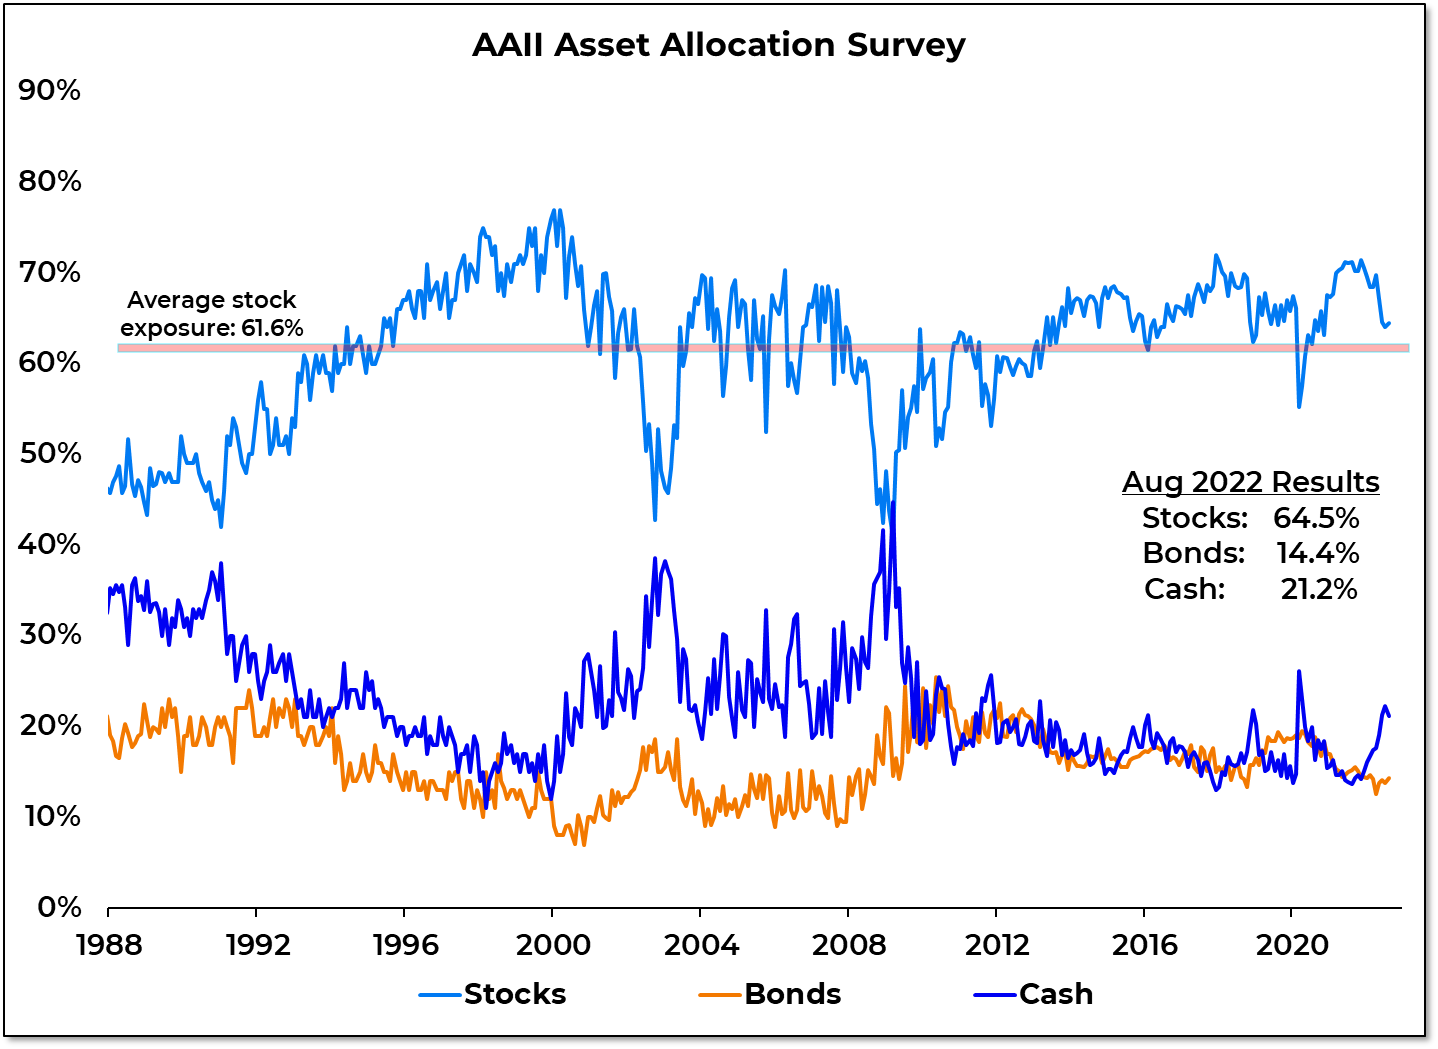
Despite financial market volatility in August and evidence of increased caution showing up in options data and sentiment surveys, investors increased exposure to both stocks and bonds. ETF flow data show $28 billion flowing into equities last month and $15 billion moving into bonds. Commodity ETFs experienced their fourth month in a row of outflows. From an asset allocation perspective, individual investors have maintained above average exposure to stocks all year. This despite the talk about the equities being unloved and sentiment being at historically low levels. The first half of this year did not see the decisive move away from stocks and toward cash that was seen during previous periods of excessive pessimism (1990, 2002, 2008, 2020). The resiliency of that love affair could be tested as the optimism that emerged off of the June lows evaporates.
After reviewing the Cyclical Portfolio, we are making the active decision to sit on our hands for now. In the Tactical Opportunity Portfolio, we’ve made a couple of tweaks. We are seeing “Higher for longer” resonate with the bond market and are increasing exposure to one of the few areas that is actually still in an uptrend.
From the desk of Steve Strazza @Sstrazza
Check out this week’s Momentum Report, our weekly summation of all the major indexes at a Macro, International, Sector, and Industry Group level.
By analyzing the short-term data in these reports, we get a more tactical view of the current state of markets. This information then helps us put near-term developments into the big picture context and provides insights regarding the structural trends at play.
Let’s jump right into it with some of the major takeaways from this week’s report:
* ASC Plus Members can access the Momentum Report by clicking the link at the bottom of this post.
From the desk of Steve Strazza @Sstrazza
Our Top 10 Charts Report was just published.
In this weekly note, we highlight 10 of the most important charts or themes we’re currently seeing in asset classes around the world.
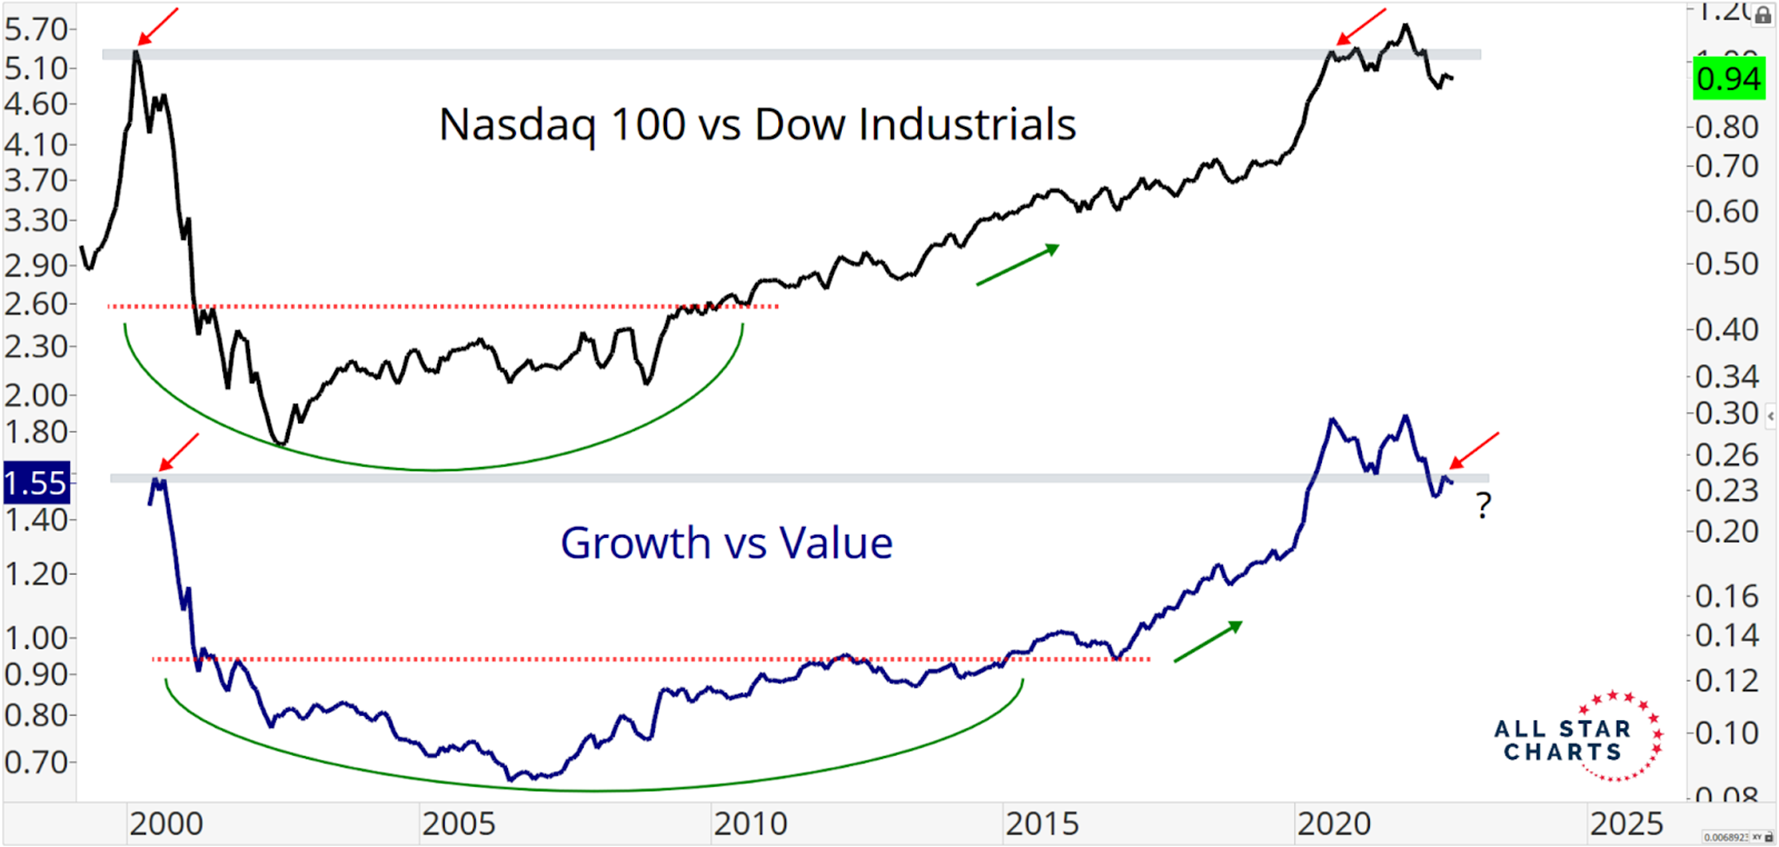
Structural Trends Shift in Favor of Value
We just got fresh monthly candles for August last week. When we look at a monthly line chart of the growth vs value relationship, it’s hard to see anything but a recently completed double top formation and successful retest from below. The fact that this bearish reversal pattern is occurring at a critical level of interest at the dot-com bubble highs makes this price action even more significant. As long as this distribution pattern remains valid, we’re anticipating a structural reversal in this relative trend that favors value. And as shown in the upper pane, as far as the major averages are concerned, this means we want to overweight the value-heavy Dow Industrials and underweight tech-heavy indexes such as the Nasdaq 100.
From the desk of Willie Delwiche.
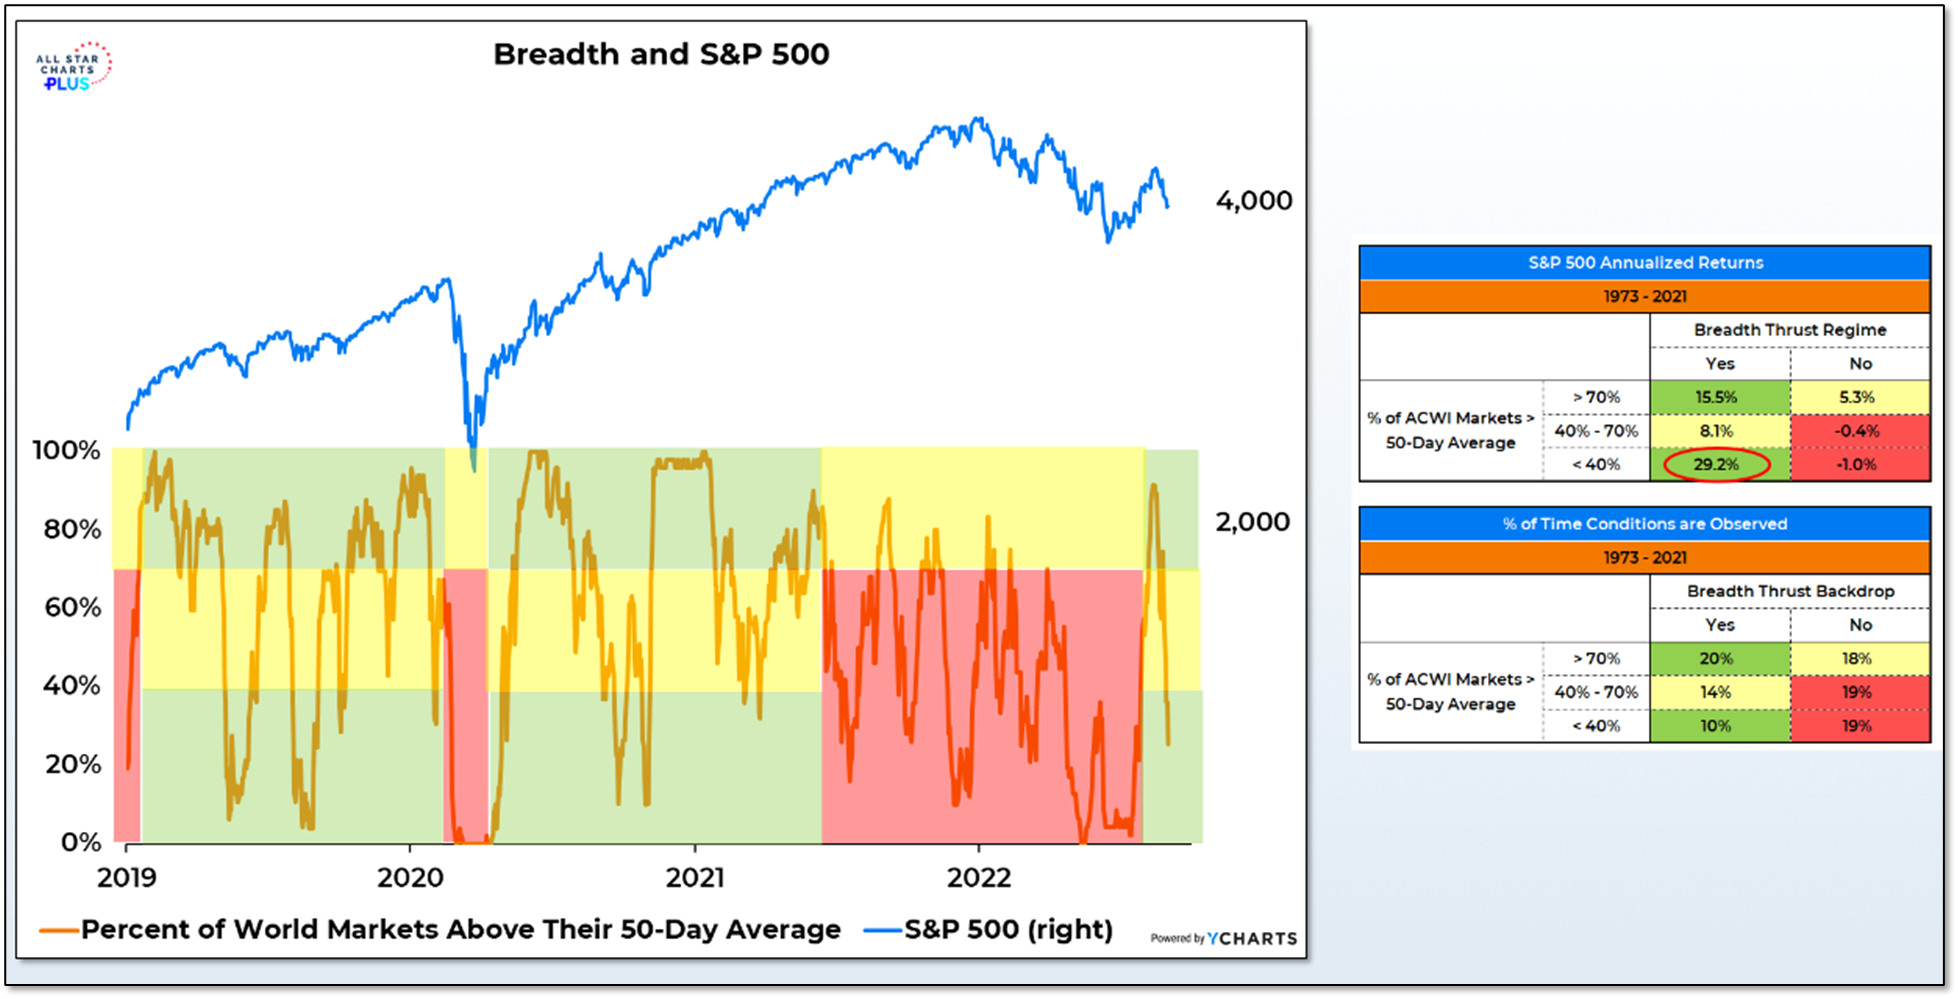
The late-July breadth thrust provides a breadth thrust regime that lasts for a year (or more if we get additional breadth thrusts between now and mid-2023). In such an environment, near-term oversold conditions tend not to persist and, in fact, reverse quite quickly. One way of measuring this is to look at the percentage of world markets trading above their 50-day average. Anything above 70% is pretty good participation, whether we are in a bullish breadth thrust regime or not. Below 40% is a different story. Without a breadth thrust as support, the S&P 500 struggles to make headway when the percentage of world markets above their 50-day average collapses. But within breadth thrust regimes, it signals an oversold condition that leads to strength.
The percentage of world markets above their 50-day average was at 90% in mid-August and is now down to just 25%. The recent breadth thrust suggests that rather than a red light arguing for caution, the signal now is a greenlight encouraging exposure.