This is the video recording of the November 3rd, 2022, Weekly Town Hall w/ Willie Delwiche.
11/03/22 2:00 PM ET [Read more…]
Expert technical analysis of financial markets by JC Parets
This is the video recording of the November 3rd, 2022, Weekly Town Hall w/ Willie Delwiche.
11/03/22 2:00 PM ET [Read more…]
From the desk of Willie Delwiche.
This All Star Charts PLUS Monthly Playbook breaks down the investment universe into a series of binary decisions, tactical calls and asset allocation models.
Paired with our Weight of the Evidence Dashboard and our Playbook Chartbook, this piece is designed to help dynamic asset allocators follow trends, pursue opportunities, and manage risk.
With fear subsiding but strength slow to emerge, downside tactical risks are rising. We reduced the equity exposure in our Tactical Opportunity portfolio and have moved more cash to the sideline.
From the desk of Willie Delwiche.
Households Stick With Stocks
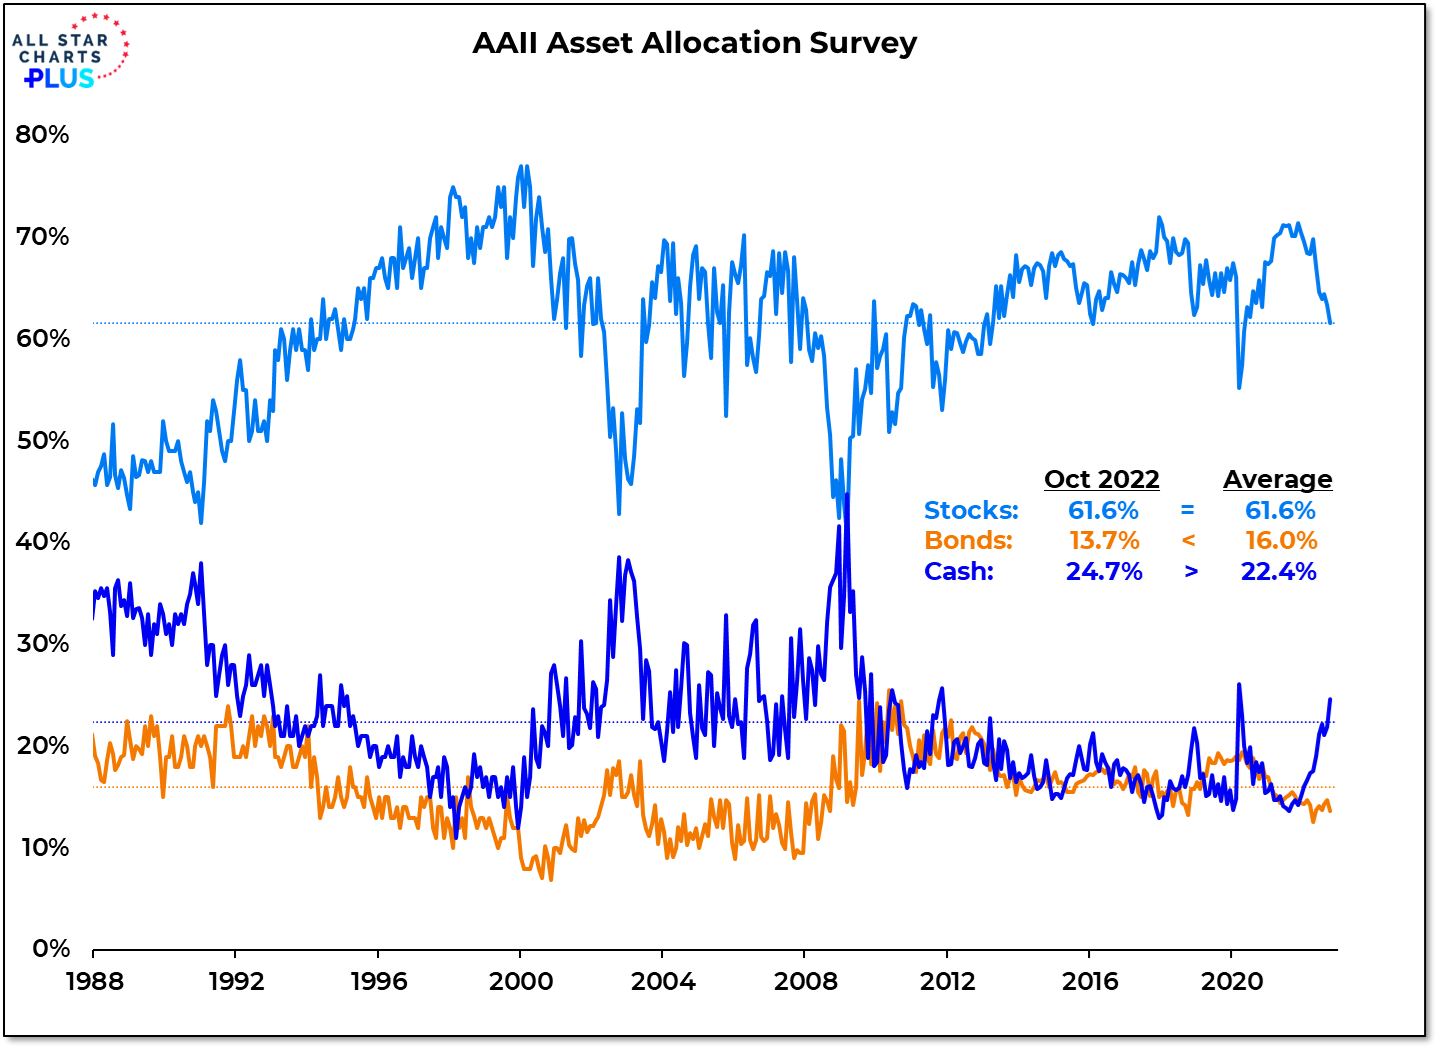
Household equity exposure is ten percentage points below its November 2021 peak. Even with that decline, it is only now approaching its long-term average. Bond exposure remains below its long-term average and cash exposure in October moved above its long-term average for the first time since COVID.
Why It Matters: Moods are sour, but for all the talk of rampant pessimism & historic levels of bearishness, individual investors have not abandoned stocks. This is as evident in the AAII asset allocation survey as it is in the latest ETF flow data. For the amount of pessimism that is being seen elsewhere, there is relatively little cash on the sidelines. If there is an underowned and unloved asset class it is either bonds or commodities, not stocks.
In this week’s Sentiment Report we take a closer look at how investors are feeling and how that squares with what they are doing.
From the desk of Willie Delwiche.
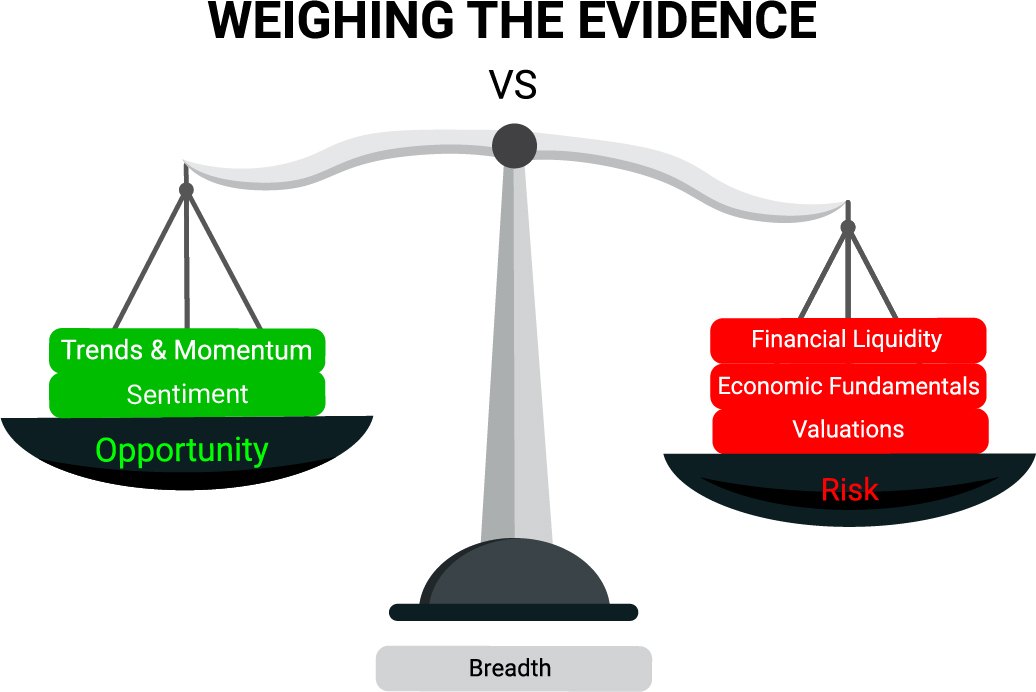
The Scales are more balanced than last month but are still tipped toward risk and away from opportunity.
Macro folks are sorting out just how bearish they need to get while market folks are trying to figure out just how bullish they should get. From my perspective, less macro-related volatility could help stocks build on their October gains heading into year end. But there isn’t much evidence of that taking place just yet. With that, the inability of the recent rally to show sustainable strength (and more new highs than new lows) suggests caution remains warranted.
Our Weight of the Evidence Dashboard fills in the details and includes a few charts that have our attention heading into November.
Once Bitten – Twice Shy
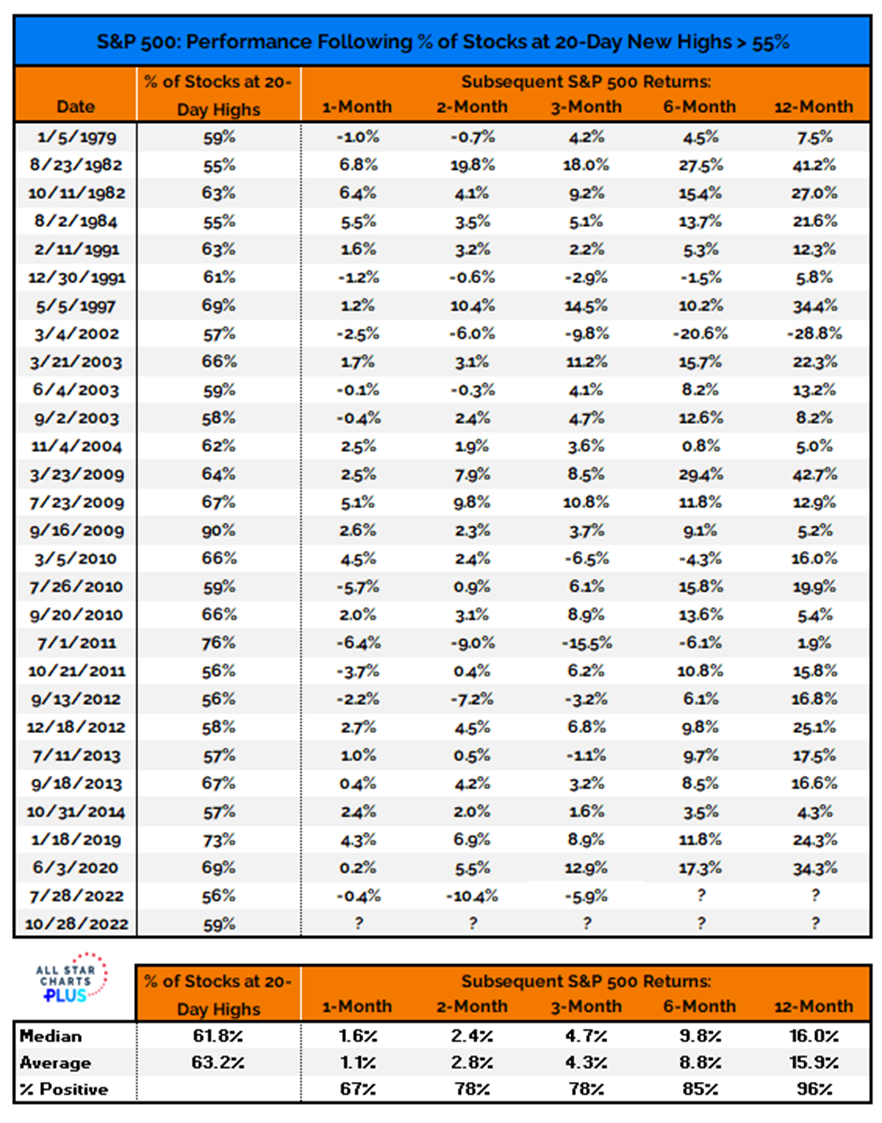
Beyond the mega-cap earnings-related blow-ups of last week, the rally off of the mid-October lows quietly gained strength. At Friday’s close, more than 55% of S&P 500 stocks were trading at new 20-day highs. In our work, that is a breadth thrust – the first since July and only the second since June 2020.
More Context: After stocks were uncharacteristically weak following the July breadth thrust, investors may be more cautious about embracing the latest signal. In this environment it is entirely possible that breadth thrusts are more evidence of volatility than strength. Over the course of my career I have tended to “trust the thrust”, but also believe it is a case of “thrust, but verify.”
We take a Deeper Look at what we have seen during the fear-fueled bounce off of the October lows and how that could morph into a strength-sustained rally.
From the desk of Steve Strazza @Sstrazza
Our Top 10 Charts Report was just published.
In this weekly note, we highlight 10 of the most important charts or themes we’re currently seeing in asset classes around the world.
Insurance Claims a Leadership Role
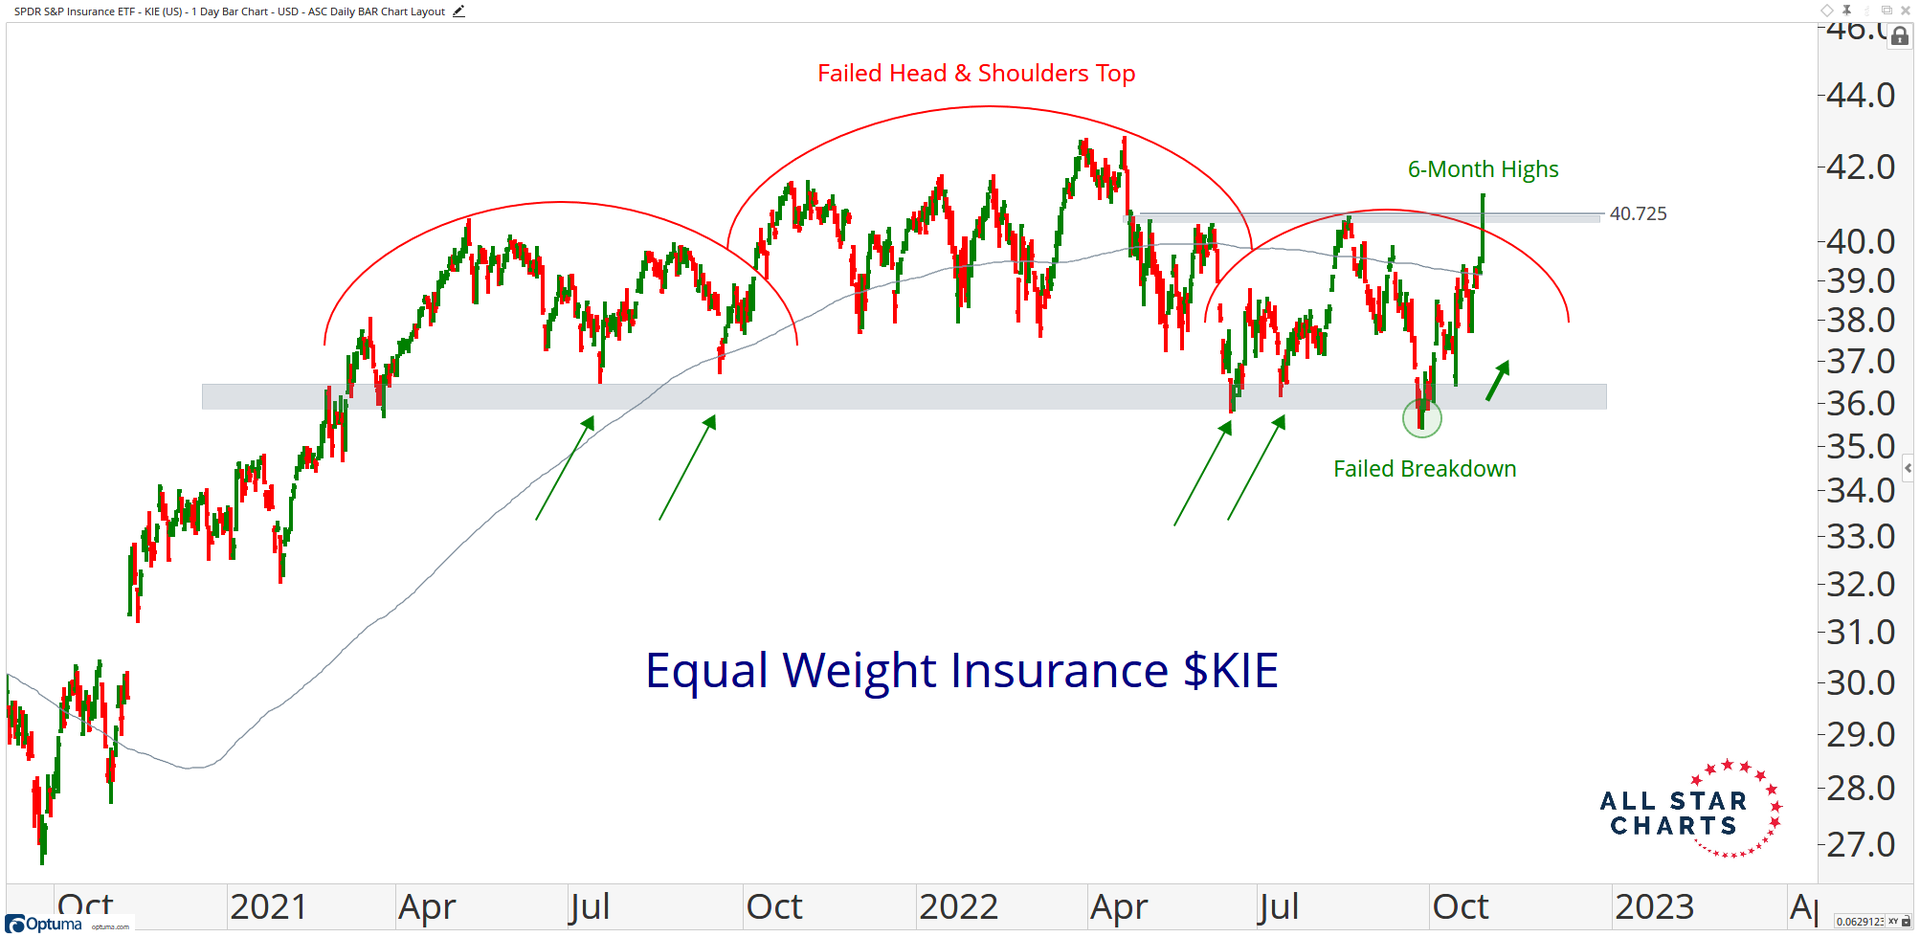
The Equal Weight SPDR Insurance ETF(KIE) just closed at its highest level since April. One thing we know about relative strength is that the stocks and indexes that hold up best during bear markets tend to be the first to make new highs when the selling pressure subsides. We think this group will continue to outperform in the future as it completes a failed head & shoulder top and is only 3% from fresh all-time highs.
From the desk of Steve Strazza @Sstrazza
Check out this week’s Momentum Report, our weekly summation of all the major indexes at a Macro, International, Sector, and Industry Group level.
By analyzing the short-term data in these reports, we get a more tactical view of the current state of markets. This information then helps us put near-term developments into the big picture context and provides insights regarding the structural trends at play.
Let’s jump right into it with some of the major takeaways from this week’s report:
* ASC Plus Members can access the Momentum Report by clicking the link at the bottom of this post.