A downtrend consists of a series of lower lows and lower highs.
But the Dow Jones Industrial Average and Russell2000 Small-cap Index are both making higher highs.
That’s, by definition, not a downtrend. [Read more…]
Expert technical analysis of financial markets by JC Parets
From the Desk of Steve Strazza @Sstrazza
When investing in the stock market, we always want to approach it as “a market of stocks.”
Regardless of the environment, there are always stocks showing leadership and trending higher.
We may have to look harder to identify them depending on current market conditions. But there are always stocks that are going up.
The same can be said for weak stocks. Regardless of the environment, there are always stocks that are going down, too.
We already have multiple scans focusing on stocks making all-time highs, such as Hall of Famers, Minor Leaguers, and the 2 to 100 Club.
We filter these universes for stocks that are exhibiting the best momentum and relative strength characteristics.
Clearly, we spend a lot of time identifying and writing about leading stocks every week, via multiple reports.
Now, we’re also highlighting lagging stocks on a recurring basis.
From the desk of Willie Delwiche.
Key Takeaway: The bulls are raising their voices in excitement. For the first time this year, momentum and breadth are improving in tandem. Despite the bullish developments in recent weeks, the structural trend remains lower. This newfound optimism builds upon months of selling pressure replaced by broadening pockets of near-term strength. Now that the ball is in the bull’s court, they have to do something with it. This means proving they have what it takes to stay in the game, and that we’re experiencing strength beyond an oversold bounce.
Sentiment Report Chart of the Week: Investors Finding A New Dance Partner?
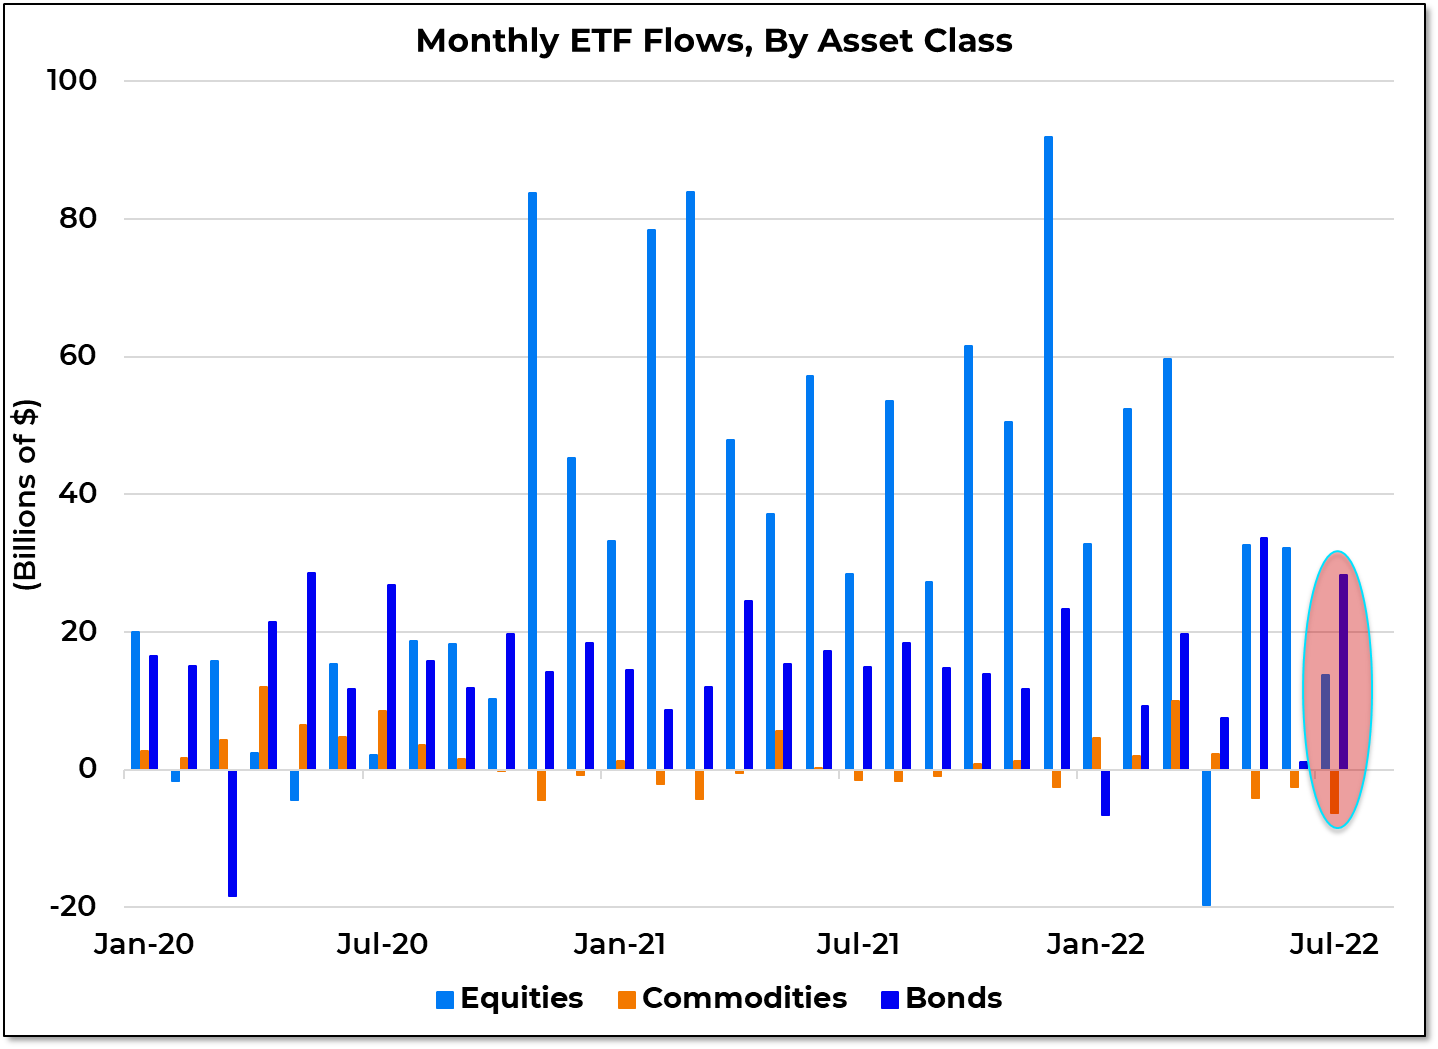
It would be premature to suggest that the long-running (and recently renewed) love affair that investors have with equities has reached an end. Equity funds continue to see inflows and the monthly AAII asset allocation survey shows household equity exposure remaining in the mid-60’s despite consumer sentiment holding near historic lows. But at the margin, there is building interest elsewhere. Bond fund inflows in July outpaced stock fund inflows for only the second time since mid-2020 and over the past seven weeks, inflows to US bond funds have outpaced inflows to US stock funds by better than 7 to 1.
Every idea that we put on at All Star Charts starts with a technical setup that we like. We are students of price action and that supercedes everything.
It’s nice when our technical analysis lines up with “other” factors that may support our idea, be they fundamental, news, or in this case, insiders and activist activity.
Here’s what our team noticed in an email to ASC subscribers earlier this week:
CEOs and Activists buying big positions? That has our attention.
Here’s a chart of the setup as we see it: [Read more…]
From the Desk of Ian Culley @IanCulley
How funny would it be if the US Dollar Index $DXY peaked with the expectations of a 100 basis point rate hike last month?
And what would that mean for risk assets and the stock market rally?
These are just a few questions that float across my mind as I look through currency charts.
To be clear, the DXY isn’t showing any signs of a top. Momentum remains in a bullish regime, and the index is holding above the upper bounds of its former range.
I’m not going out on a limb here and calling a top in the US dollar. Instead, this is all about execution and remaining receptive to all possibilities.
We adjusted our international equity exposure to stay in harmony with global leadership and are putting some money to work domestically following the late-July breadth thrust.