This is the video recording of the March 2nd, 2023, Weekly Town Hall w/ Willie Delwiche.
03/02/23 2:00 PM ET [Read more…]
Expert technical analysis of financial markets by JC Parets
This is the video recording of the March 2nd, 2023, Weekly Town Hall w/ Willie Delwiche.
03/02/23 2:00 PM ET [Read more…]
From the desk of Steve Strazza @Sstrazza
Welcome to the 2 to 100 Club.
As many of you know, something we’ve been working on internally is using various bottom-up tools and scans to complement our top-down approach. It’s really been working for us!
One way we’re doing this is by identifying the strongest growth stocks as they climb the market-cap ladder from small- to mid- to large- and, ultimately, to mega-cap status (over $200B).
Once they graduate from small-cap to mid-cap status (over $2B), they come on our radar. Likewise, when they surpass the roughly $30B mark, they roll off our list.
But the scan doesn’t just end there.
We only want to look at the strongest growth industries in the market, as that is typically where these potential 50-baggers come from.
Some of the best performers in recent decades – stocks like Priceline, Amazon, Netflix, Salesforce, and myriad others – would have been on this list at some point during their journey to becoming the market behemoths they are today.
When you look at the stocks in our table, you’ll notice we’re only focused on Technology and Growth industry groups such as Software, Semiconductors, Online Retail, Solar, etc.
Then, like any good technician, we filter the list down to those closest to new highs.
This allows the cream of these strong groups to rise to the top and helps streamline our mission to identify technical breakouts in the top-performing stocks.
It’s the weekly currency edition of What the FICC?
Instead of allowing the market to dictate your emotions along with the herd, let it simply highlight the path of least resistance.
That’s what I’m doing.
Check it out!
From the Desk of Willie Delwiche
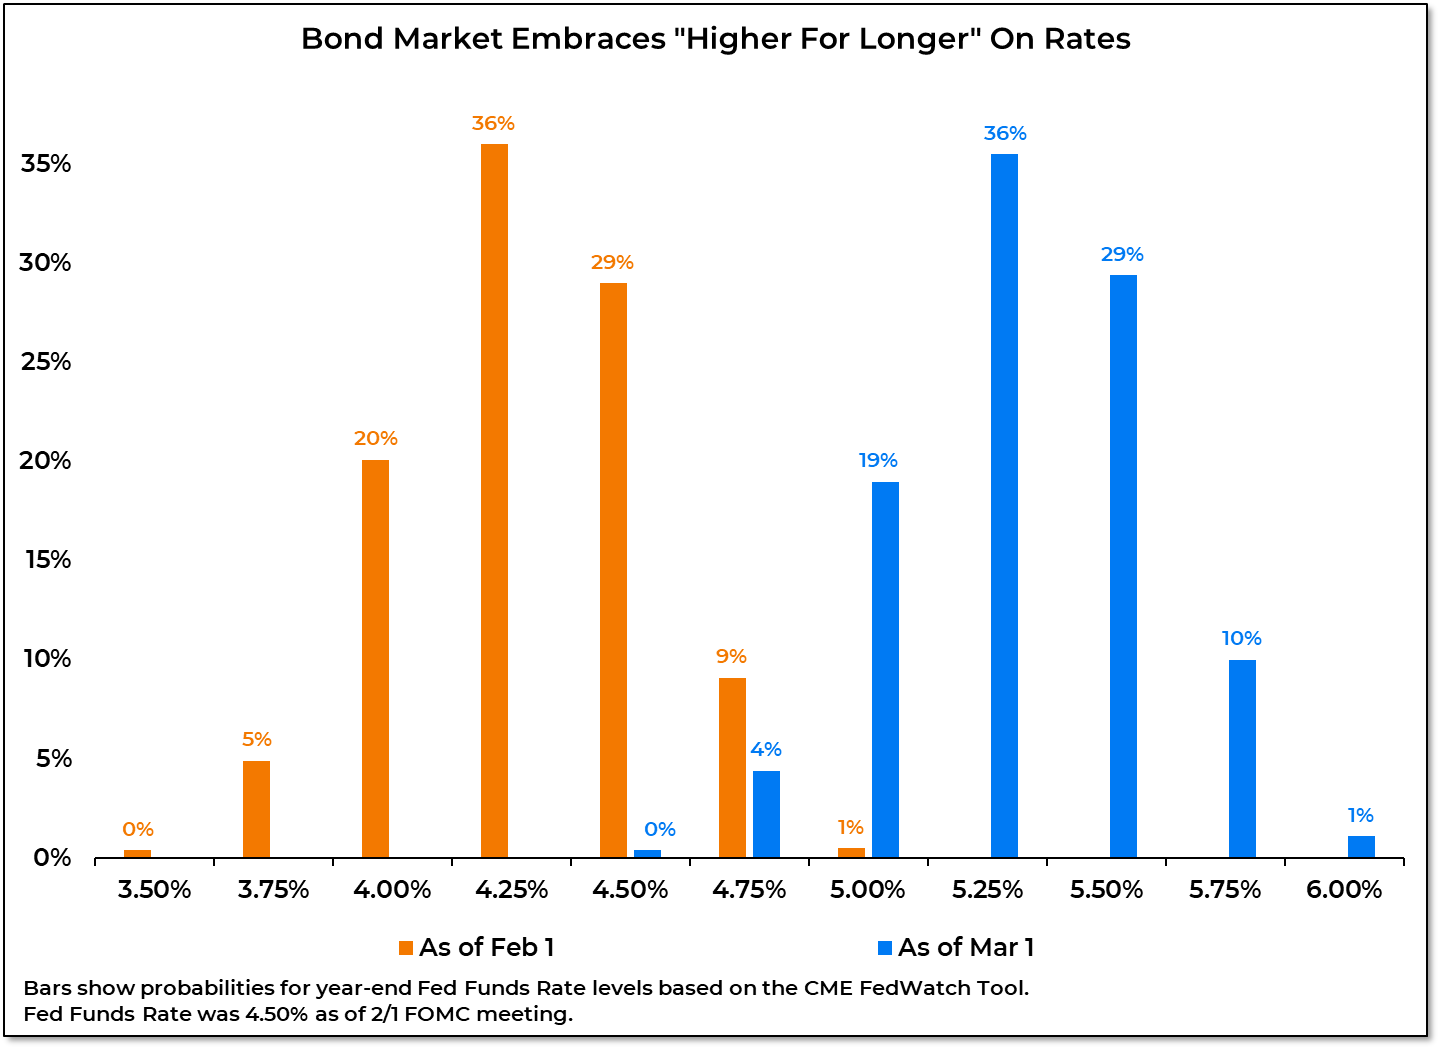
When the Fed raised rates to 4.50% in early February, the market was expecting that any additional tightening this Spring would be taken back (and then some) and that by the end of the year the Fed Funds Rate would be at 4.25%. Now, the market is pricing in a year-end Fed Funds Rate of at least 5.25%. Over the course of a month, market expectations for rates have shifted higher by a full percentage point.
Why It Matters: Stocks stumbled in February as the markets digested the shift in expectations from “rate cuts by the end of the year” to a “higher for longer” reality. This led to investors who had been slow to embrace stock market strength to reconsider recently discovered optimism. We have documented that stocks tend to do well in the wake of persistent pessimism. Under-pinning this analysis is the assumption that pessimism is indeed fading. If expectations for higher rates lead to renewed pessimism, it will be difficult for sustainable strength to emerge. You need to have bulls to have a bull market. As we move into March we see evidence that investors are saying “thanks but no thanks.”
In this week’s Sentiment Report we see that investors are having second thoughts on stocks, how volatility has remained persistent and even with yields still rising, why bonds are relatively more attractive than stocks.
From the Desk of Ian Culley @IanCulley
Markets continue to churn sideways, frustrating most investors.
Instead of allowing the market to dictate your emotions along with the herd, let it simply highlight the path of least resistance. That’s what I’m doing.
Today, I want to share with you two ways to trade the British pound – regardless of its next directional move…
If stocks are going higher from here, Meta Platforms $META (the cool kids call it “facebook”) is likely to lead the way.
We’re going to leverage some short puts to pay for the potential of unlimited upside if we get our timing right.
And the best part is, we’ve got a nearby risk-management level to tell us we’re wrong. And if we are, we’ll likely know quickly.
Check out this chart of $META:
These are the registration details for our Live Monthly Candlestick Strategy Session for Premium Members of All Star Charts.
This month’s Video Conference Call will be held on Monday March 6th @ 6PM ET. As always, if you cannot make the call live, the video and slides will be archived and published here along with every other live call since 2015.
Here are the details for Monday evening: [Read more…]