This is the video recording of the July 2019 Conference Call.
Cultivating Gains In Agribusiness
From the desk of Tom Bruni @BruniCharting
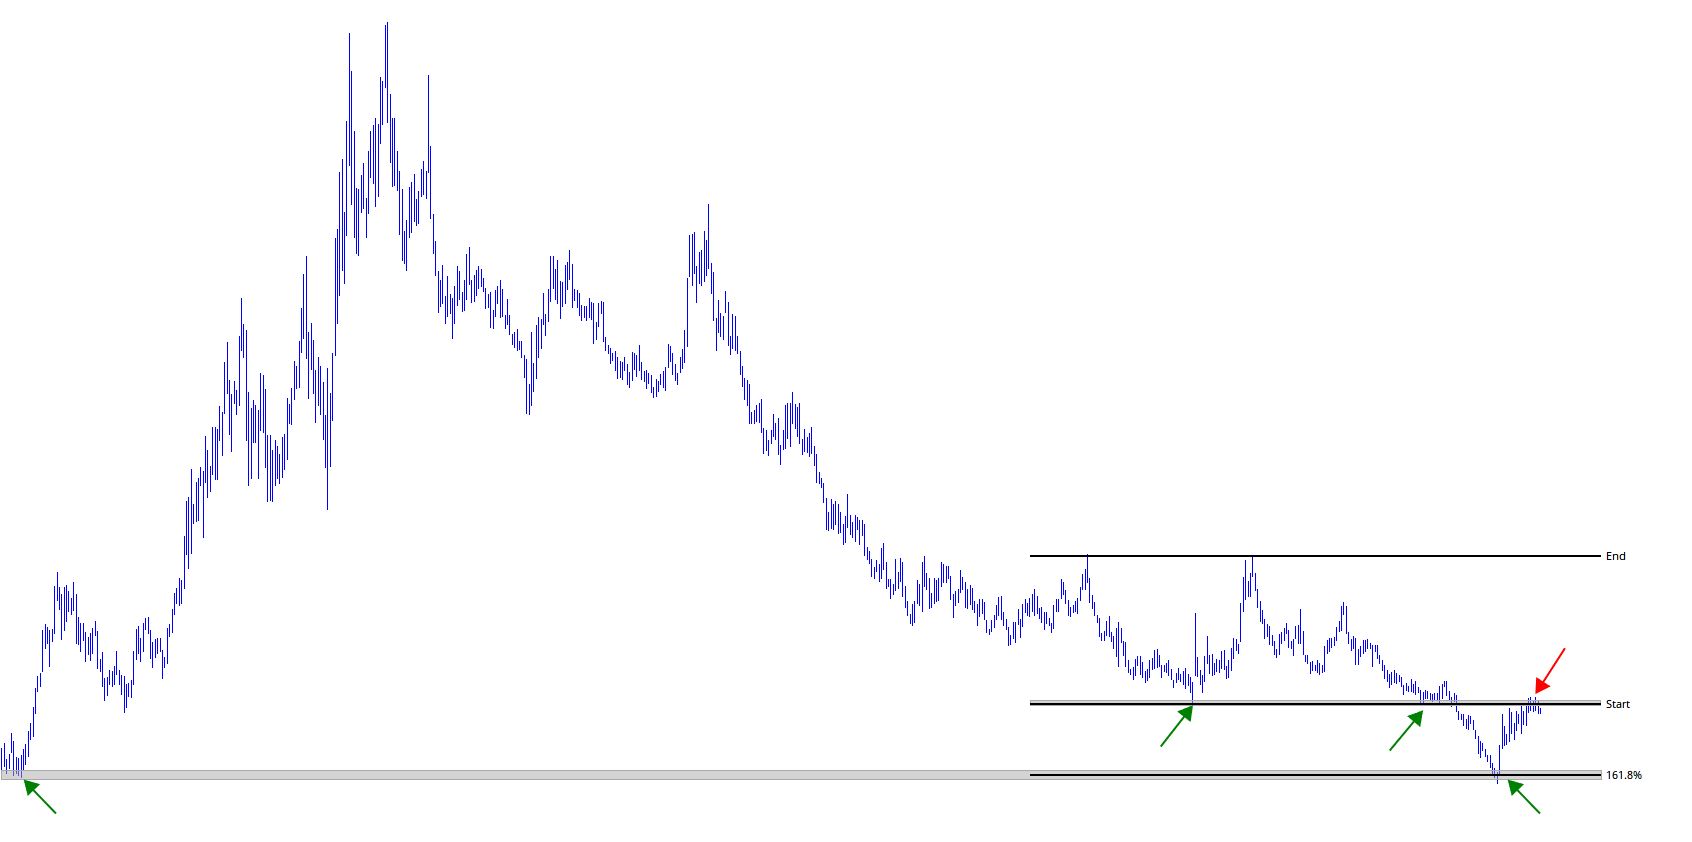
Last week I posted the mystery chart pictured below to see what people were thinking once they removed the biases of knowing the security name, timeframe, or etc. and had only price to rely on.
Most people were on the same page as I am, thinking this is a structural trend change that we want to be buying, not selling. A few people were hesitant and wanted to see more before getting involved, but very few, if any, were sellers.
Video: What Is Technical Analysis???
If you ask 100 people what Technical Analysis is, you might get 100 different answers. In this video I try to explain what Technical Analysis means to me. There are a lot of misconceptions about what it is and what it isn’t. I hope I can clear some of that up in this short video!
[Chart of The Week] A “Silver Lining” For Precious Metals
From the desk of Tom Bruni @BruniCharting
Every week I go through my chartbooks and think about what should be highlighted as our “Chart of The Week”, something that speaks to a theme that people need to know about.
Sometimes I have trouble choosing just one chart, but this week it’s a no brainer in my opinion.
Silver.
All Star Interviews Season 3, Episode 2: Rob Koyfman, Founder of Koyfin

On this Episode of the Podcast Interviews I sit down and chat with Rob Koyfman, the founder of Koyfin. This is my favorite new data and analytics platform and I find myself using these tools every day. What I find interesting and one of the reasons why we’re investors is because they are building tools for both the Technical and the Fundamental community. Rob also points out the huge demand for portfolio analytics tools for Investment Advisors. The demand for these tools is coming from everyone. Him and I are often debating whether price only charts are a better representation of supply and demand than dividend adjusted charts, so we get into that discussion in this episode. Feel free to join the conversation and Tweet us @allstarcharts and @KoyfinCharts and let us know what you think. [Read more…]
Join Me In San Francisco August 16th!

Over the last few years, I’ve been lucky to be invited to speak at a variety of Stocktwits meetups in San Francisco. I’ve been living in Sonoma, CA since 2015 so I don’t get to attend the events and happy hours in New York City all the time like I once did. These meetups give me a chance to chat with local traders and investors about the market and have conversations that I simply don’t have with friends up in wine country!
On Friday August 16th at 6PM we are taking our San Francisco Meetups to another level. For this special night, I am partnering with the MoneyShow and Stocktwits to bring you: Finding the Best Stocks Using a Top/Down Approach
The presentation will begin at 6PM and will go until 6:45 where the Stocktwits Happy Hour will begin. We’ll have friends there from all around the country and I’d like to invite you to join us FREE!
Location Details:
Hilton San Francisco Union Square
333 O’Farrell Street, San Francisco, California 94102
Mystery Chart 07-16-2019
From the desk of Tom Bruni @BruniCharting
New Mystery Chart!
For those new to the exercise, we take a chart of interest and remove the x/y-axes and any other labels that would help identify it. The chart can be any security in any asset class on any timeframe on an absolute or relative basis. Maybe it’s a custom index or inverted, who knows!
We do all this to put aside the biases we have associated with this specific security/the market and come to a conclusion based solely on price.
You can guess what it is if you must, but the real value comes from sharing what you would do right now. Buy, Sell, or Do Nothing?
New Highs Is The Common Theme
What do we know about new all-time highs? We know they’re not a characteristic of a downtrend.
I often get that guy that comes to me and says, “Well every new downtrend must start from a new high”. Yes, and that must be a great way to go through life.
You see, markets trend. That’s why Technical Analysis works. That’s why this is so valuable. Because if you can recognize the direction of the underlying trend, you’re already way ahead of the pack. The likelihood for a trend to continue in its path is exponentially higher that for it to reverse. A 4-year old can recognize if a chart is going up, down or sideways. It’s the adults that have more trouble with this.
As I went through all my weekly charts this weekend, I noticed an interesting underlying theme: New Highs. [Read more…]
- « Previous Page
- 1
- …
- 477
- 478
- 479
- 480
- 481
- …
- 517
- Next Page »