From the desk of Thomas Bruni @brunicharting
***
As momentum stocks breakdown, the Nasdaq 100 has begun to breakdown in a similar fashion on a relative basis.
Below is a daily chart of the Nasdaq 100 vs the S&P 500.
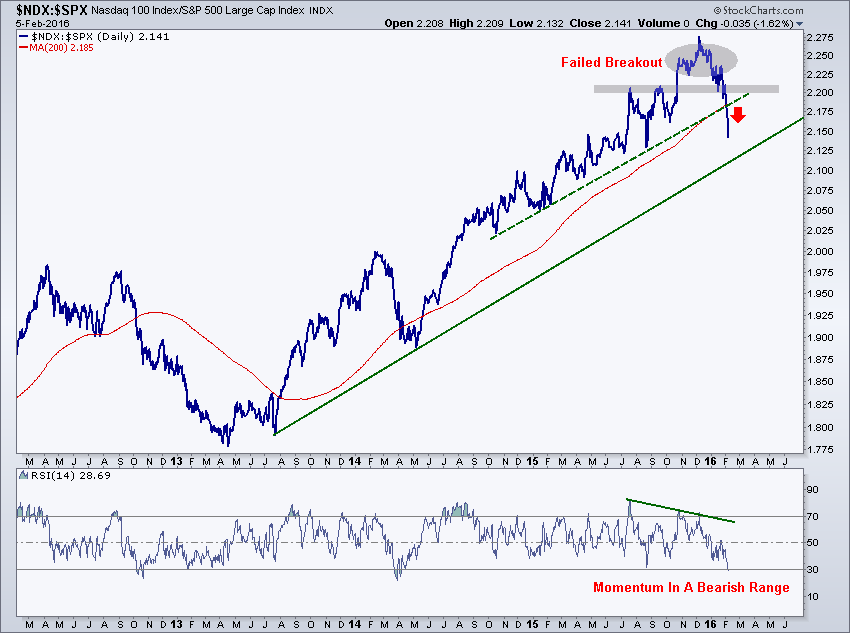 This ratio broke out to new highs late last year and spent a few months consolidating before ultimately resolving to the downside. This violent resolution lower confirmed a failed breakout as well as a bearish momentum divergence. Prices have since broken through the uptrend line from the summer of 2014 and look to be heading for a test of the uptrend from the June 2013 lows. From failed moves come fast moves, so I wouldn’t be surprised if this ratio ultimately retests the breakout level near 2.0 which corresponds with the 61.8% retracement of the 2013-2016 rally.
Within this theme, Electronic Arts is one individual component that looks particularly vulnerable to the meltdown taking place in Nasdaq 100 stocks and momentum names as a whole.