This is the video recording of the May 5th Weekly Town Hall w/ Willie Delwiche.
05/05/22 2:00 PM ET [Read more…]
Expert technical analysis of financial markets by JC Parets
This is the video recording of the May 5th Weekly Town Hall w/ Willie Delwiche.
05/05/22 2:00 PM ET [Read more…]
From the desk of Willie Delwiche.
I had a great time in DC last week, first for some dedicated time with the All Star Charts team that is normally dispersed all over the world, and later at the CMT Symposium itself. There was good food and drink and great conversations – in larger settings and small.
As great as the presentations were overall, I often found myself chewing on asides and tidbits more than the large macro points. For me, the key insights were more about process and less about conclusions. Maybe that’s not surprising. Conclusions come and go based on market conditions. But process and approach should be consistent (though not immune from the refiner’s fire). I think Tyler Wood said it best last week, “We’re not predicting the future, just reacting responsibly.”
Things I picked up last week that I want to hold on to:
From the desk of Willie Delwiche.
Key Takeaway: At last week’s CMT Symposium, the lack of bulls and high number of bears on the AAII survey was probably the most oft-cited single statistic by the symposium speakers. This week’s data confirms that pessimism. II bears reached their third highest level in the past decade and put/call ratios haven’t been as high as they are now since the COVID crash. Beneath the surface, however, there is evidence that investors haven’t actually thrown in the towel. The AAII Asset Allocation survey for April shows that while they said they were bearish last month, individual investors were actually increasing equity exposure. The spike in the put/call ratios meanwhile has more to do with collapsing call volume than surging activity in puts. Bearish sentiment extremes are difficult to identify in real-time, that’s why it’s typically best to go with the crowd until it has reversed.
Sentiment Report Chart of the Week: What They Do > What They Say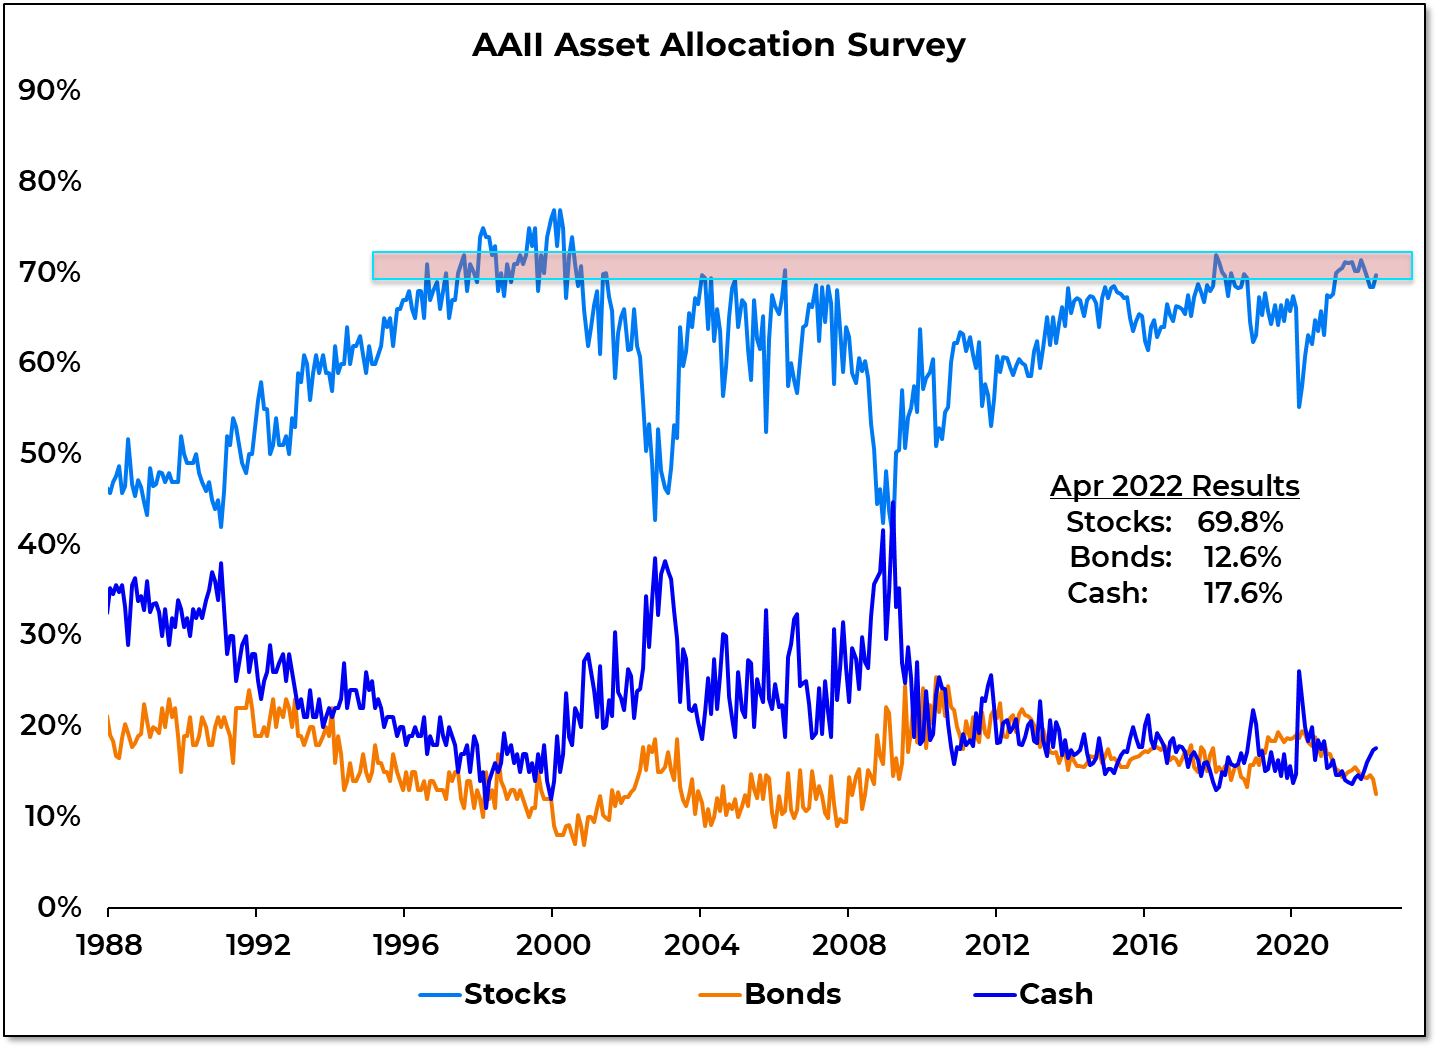
The 4-week average of Bulls on the AAII survey (more on this later in the report) is at its lowest level in more than three decades. But while investors report a lack of confidence, their actions tell a different story. Asset allocation data from the AAII shows that investors actively increased equity exposure last month. It’s difficult to reconcile the idea of washed out sentiment with a public that is buying stocks. When there is a divergence between what they say and what they do, I put more weight on action than on talk.
From the desk of Willie Delwiche.
This All Star Charts +Plus Monthly Playbook breaks down the investment universe into a series of largely binary decisions and tactical calls. Paired with our Weight of the Evidence Dashboard, this piece is designed to help active asset allocators follow trends, pursue opportunities, and manage risk.
Key Takeaway:
From the desk of Willie Delwiche.
Key Takeaway: The lack of a meaningful rebound in price sustains a subdued atmosphere across the market. Sellers continue to drive prices lower and equity put/call ratios are on the rise. But due to the overwhelming decline in call volume this speaks more to a lack of risk appetite than outright fear. While pessimism is certainly present and has reached levels associated with opportunity, there is still plenty of room for sentiment to unwind. Current conditions carry significant risks with lackluster price action and equity ETFs starting to experience net outflows (three weeks in a row and four of the past five weeks). Simply put: we have not seen significant evidence of capitulation. Just because the recent market environment has been tough doesn’t mean it can’t get worse.
Sentiment Report Chart of the Week: Is “As Bad As It’s Been” Good Enough?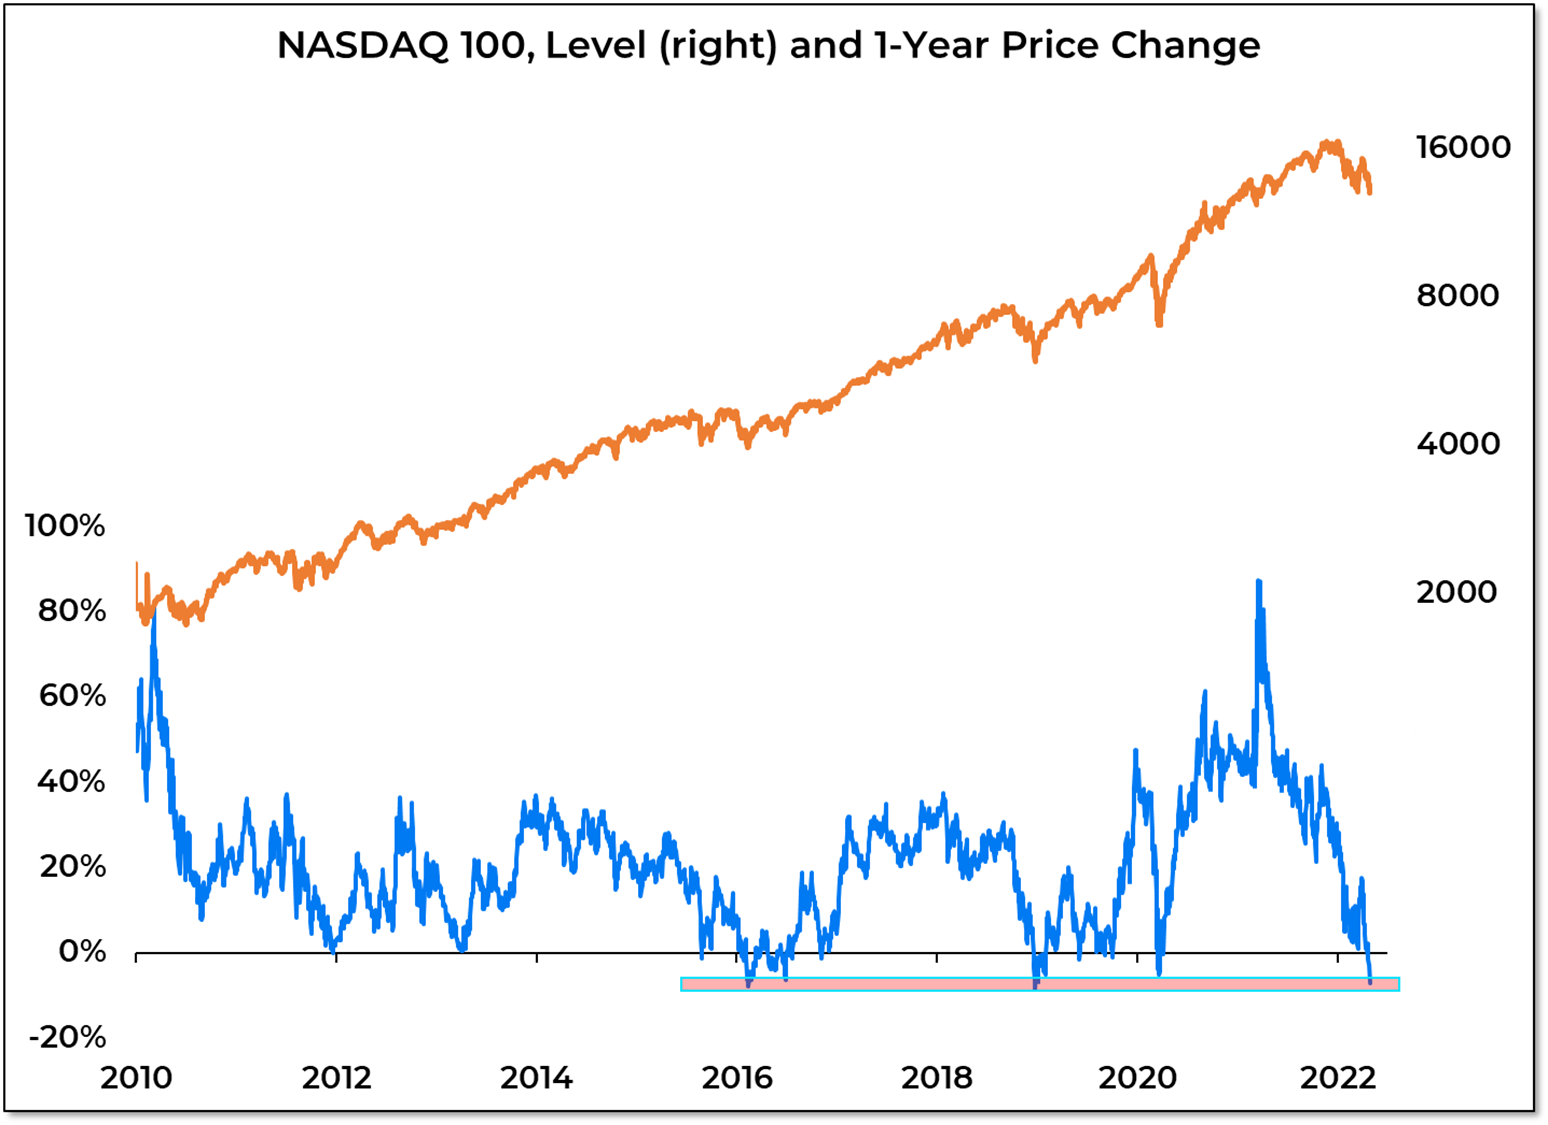
Recent selling pressure has pushed the NASDAQ 100 into negative territory on a year-over-year basis. That has been unfamiliar territory over the past decade. The yearly change in the NDX is lower now than it was near the COVID lows during March 2020 and is comparable to the worst levels seen in 2016 and 2019. With investor attitudes turning sour, the question for market participants is whether “as bad as it’s been” is good enough to spark a rally? Or will investors unaccustomed to losses continue to re-evaluate their equity exposure?
Key Takeaway: