This is the video recording of the September 8th, 2022, Weekly Town Hall w/ Willie Delwiche.
09/08/22 2:00 PM ET [Read more…]
Expert technical analysis of financial markets by JC Parets
This is the video recording of the September 8th, 2022, Weekly Town Hall w/ Willie Delwiche.
09/08/22 2:00 PM ET [Read more…]
From the desk of Willie Delwiche.
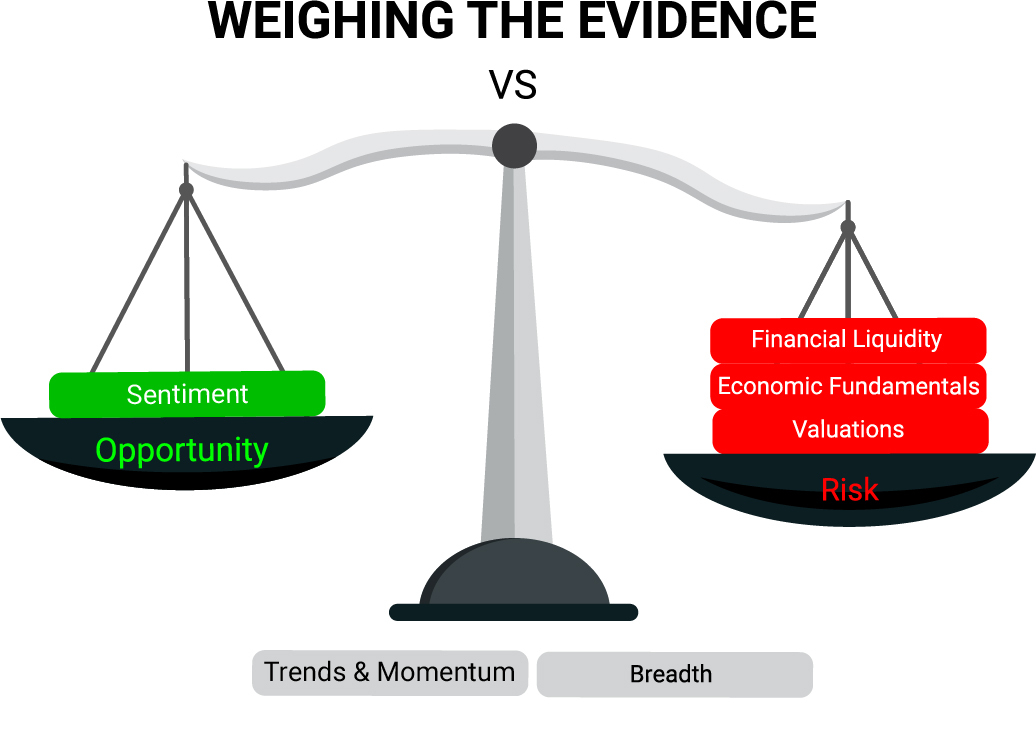
This All Star Charts +Plus Monthly Playbook breaks down the investment universe into a series of largely binary decisions and tactical calls. Paired with our Weight of the Evidence Dashboard and our Playbook Chartbook, this piece is designed to help active asset allocators follow trends, pursue opportunities, and manage risk.
From the desk of Willie Delwiche.
Key Takeaway: Despite the stock market’s reluctance toward sustained advances, investors have refused to throw in the towel. The bulls showed up last month, declaring their intent by triggering short-term breadth and momentum thrusts. Yet, as impressive as the display of strength was, they’re still waiting for the market to respond. Or at least the response they were hoping for. We would expect oversold conditions to reverse quickly after strong upside momentum and broadening participation. That hasn’t happened yet and bulls are showing signs of getting discouraged. If the relationship between investors and stocks isn’t going to be a two-way street, the likelihood of a broader and deeper sentiment re-set increases.
Sentiment Report Chart of the Week: Investors Not Giving Up On Stocks
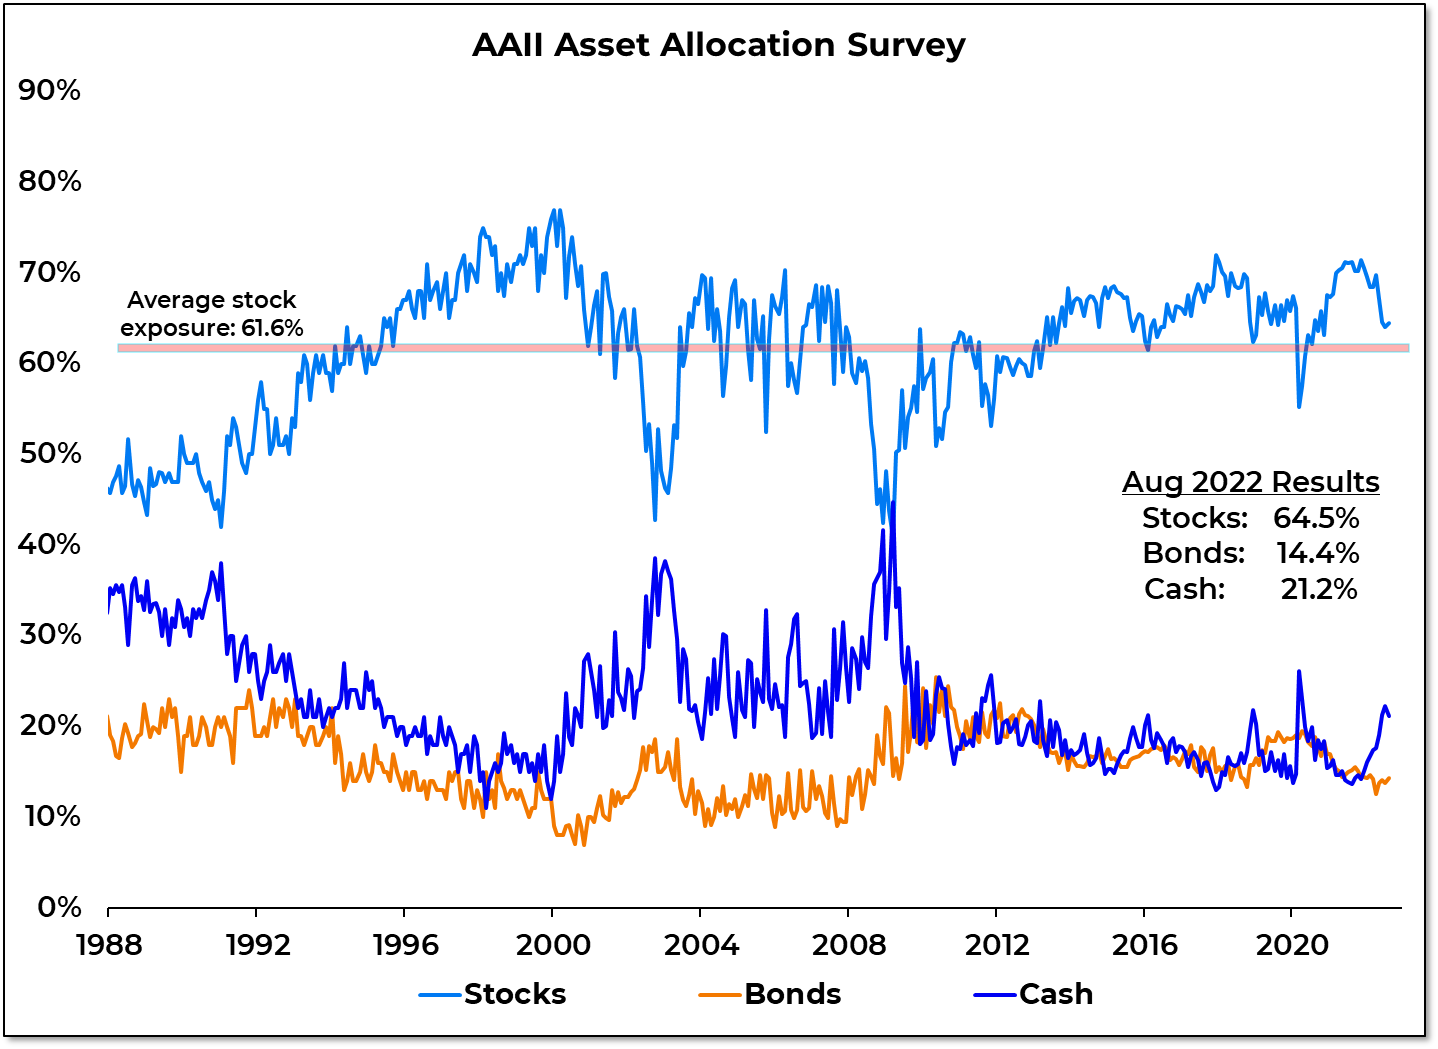
Despite financial market volatility in August and evidence of increased caution showing up in options data and sentiment surveys, investors increased exposure to both stocks and bonds. ETF flow data show $28 billion flowing into equities last month and $15 billion moving into bonds. Commodity ETFs experienced their fourth month in a row of outflows. From an asset allocation perspective, individual investors have maintained above average exposure to stocks all year. This despite the talk about the equities being unloved and sentiment being at historically low levels. The first half of this year did not see the decisive move away from stocks and toward cash that was seen during previous periods of excessive pessimism (1990, 2002, 2008, 2020). The resiliency of that love affair could be tested as the optimism that emerged off of the June lows evaporates.
After reviewing the Cyclical Portfolio, we are making the active decision to sit on our hands for now. In the Tactical Opportunity Portfolio, we’ve made a couple of tweaks. We are seeing “Higher for longer” resonate with the bond market and are increasing exposure to one of the few areas that is actually still in an uptrend.
From the desk of Willie Delwiche.
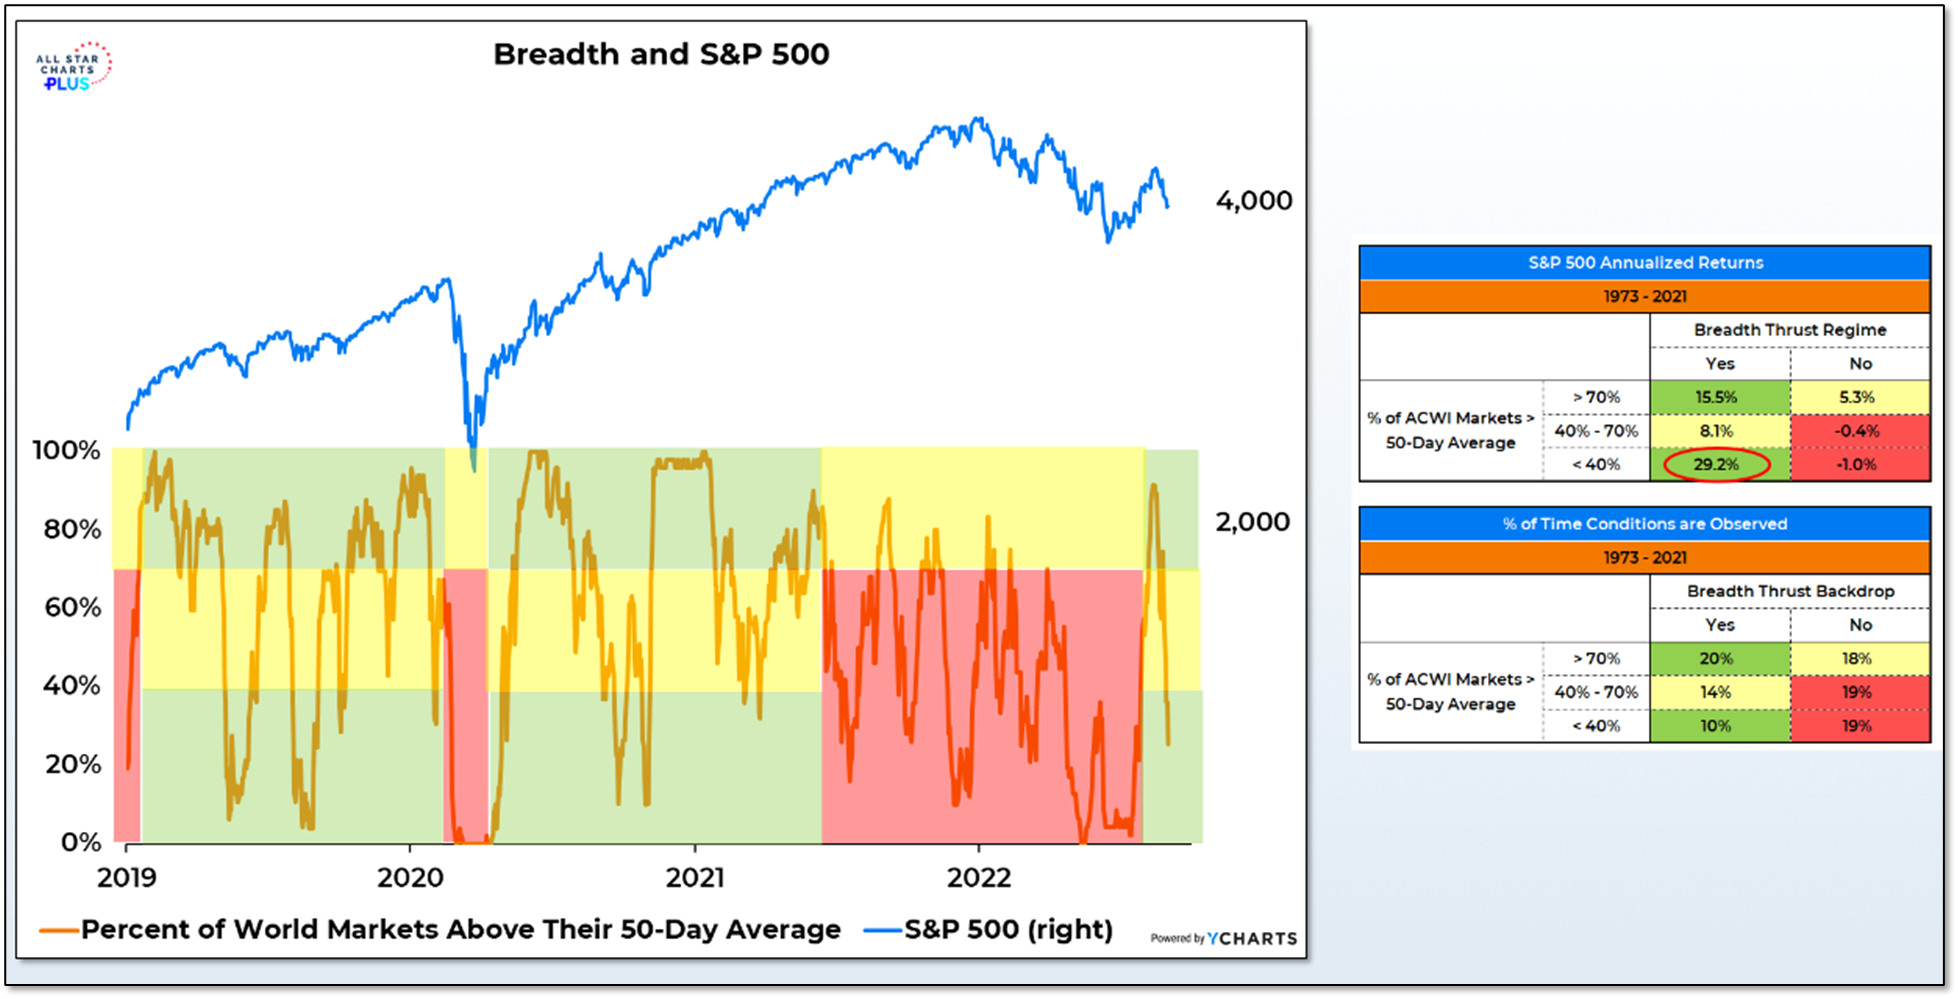
The late-July breadth thrust provides a breadth thrust regime that lasts for a year (or more if we get additional breadth thrusts between now and mid-2023). In such an environment, near-term oversold conditions tend not to persist and, in fact, reverse quite quickly. One way of measuring this is to look at the percentage of world markets trading above their 50-day average. Anything above 70% is pretty good participation, whether we are in a bullish breadth thrust regime or not. Below 40% is a different story. Without a breadth thrust as support, the S&P 500 struggles to make headway when the percentage of world markets above their 50-day average collapses. But within breadth thrust regimes, it signals an oversold condition that leads to strength.
The percentage of world markets above their 50-day average was at 90% in mid-August and is now down to just 25%. The recent breadth thrust suggests that rather than a red light arguing for caution, the signal now is a greenlight encouraging exposure.
This is the video recording of the September 1st, 2022, Weekly Town Hall w/ Willie Delwiche.
09/01/22 2:00 PM ET [Read more…]
From the desk of Willie Delwiche.
The first eight months of the year have been a grind.
A mid-month reversal in August took the S&P 500 from a 4% gain to 4% loss for the month and the early breadth and momentum thrusts now seem like a distant memory. Two-thirds of the way through the year and we are on track for the fewest days of more new highs than new lows observed in the past two decades, and 2022 is just ahead of 2020 (and lagging only 2009) in terms of daily swings of 1% or more on the S&P 500. Weakness in stocks this year has been exacerbated by weakness in bonds, as yields have climbed to new multi-year highs. The 60/40 stock/bond benchmark portfolio is down 14% through August.
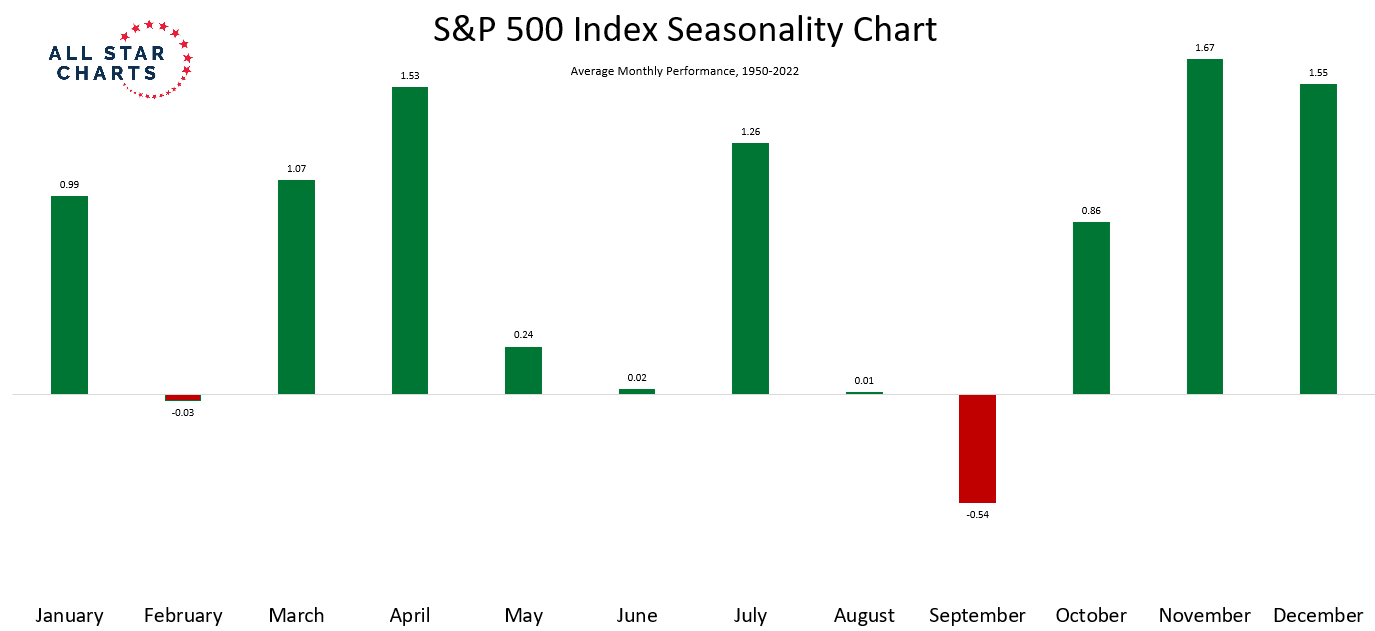
Welcome to September. If you haven’t heard, it’s the worst month of the year for stocks. Since 1950, only two months (February and September) have been down on average. This is a case were we don’t really need to focus on the exact numbers – the large red bar for September says it all: