It’s the weekly bond edition of What the FICC?
Commodity-related stocks remain hot despite a narrative of easing inflation.
Check it out!
Expert technical analysis of financial markets by JC Parets
It’s the weekly bond edition of What the FICC?
Commodity-related stocks remain hot despite a narrative of easing inflation.
Check it out!
From the desk of Steve Strazza @Sstrazza
We held our February Monthly Strategy Session last week. Premium Members can access and rewatch it here.
Non-members can get a quick recap of the call simply by reading this post each month.
By focusing on long-term, monthly charts, the idea is to take a step back and put things into the context of their structural trends. This is easily one of our most valuable exercises as it forces us to put aside the day-to-day noise and simply examine markets from a “big-picture” point of view.
With that as our backdrop, let’s dive right in and discuss three of the most important charts and/or themes from this month’s call.
From the Desk of Ian Culley
I prefer to focus on price when analyzing markets.
It’s what pays us at the end of the day. And it bakes in all the news and lagging economic data I tend to ignore.
A few weeks ago, I urged investors to track trends, not inflation.
Honestly, I was only half serious. I pay attention to the Fed and CPI data – mainly to stay aware of the increased volatility accompanying important release dates.
But price is king. And when I look at my charts, the narrative of easing inflation appears suspect…
It’s the weekly currency edition of What the FICC?
Despite the overarching range-bound action and intraday indecision across the currency markets, I continue to find trade setups with well-defined risks.
Check it out!
From the desk of Steve Strazza @Sstrazza
Welcome to the 2 to 100 Club.
As many of you know, something we’ve been working on internally is using various bottom-up tools and scans to complement our top-down approach. It’s really been working for us!
One way we’re doing this is by identifying the strongest growth stocks as they climb the market-cap ladder from small- to mid- to large- and, ultimately, to mega-cap status (over $200B).
Once they graduate from small-cap to mid-cap status (over $2B), they come on our radar. Likewise, when they surpass the roughly $30B mark, they roll off our list.
But the scan doesn’t just end there.
We only want to look at the strongest growth industries in the market, as that is typically where these potential 50-baggers come from.
Some of the best performers in recent decades – stocks like Priceline, Amazon, Netflix, Salesforce, and myriad others – would have been on this list at some point during their journey to becoming the market behemoths they are today.
When you look at the stocks in our table, you’ll notice we’re only focused on Technology and Growth industry groups such as Software, Semiconductors, Online Retail, Solar, etc.
Then, like any good technician, we filter the list down to those closest to new highs.
This allows the cream of these strong groups to rise to the top and helps streamline our mission to identify technical breakouts in the top-performing stocks.
In the options market, summer flights priced in Boeing options are pretty cheap right now.
I think I’ll be looking to take a flight to a fun European destination if I can get a bullish position in Boeing to pay for it. Maybe I’ll even fly on a Boeing jet?
During our analyst meeting this morning, we kicked around a few bullish ideas, but it was this Boeing $BA chart that rose to the top:
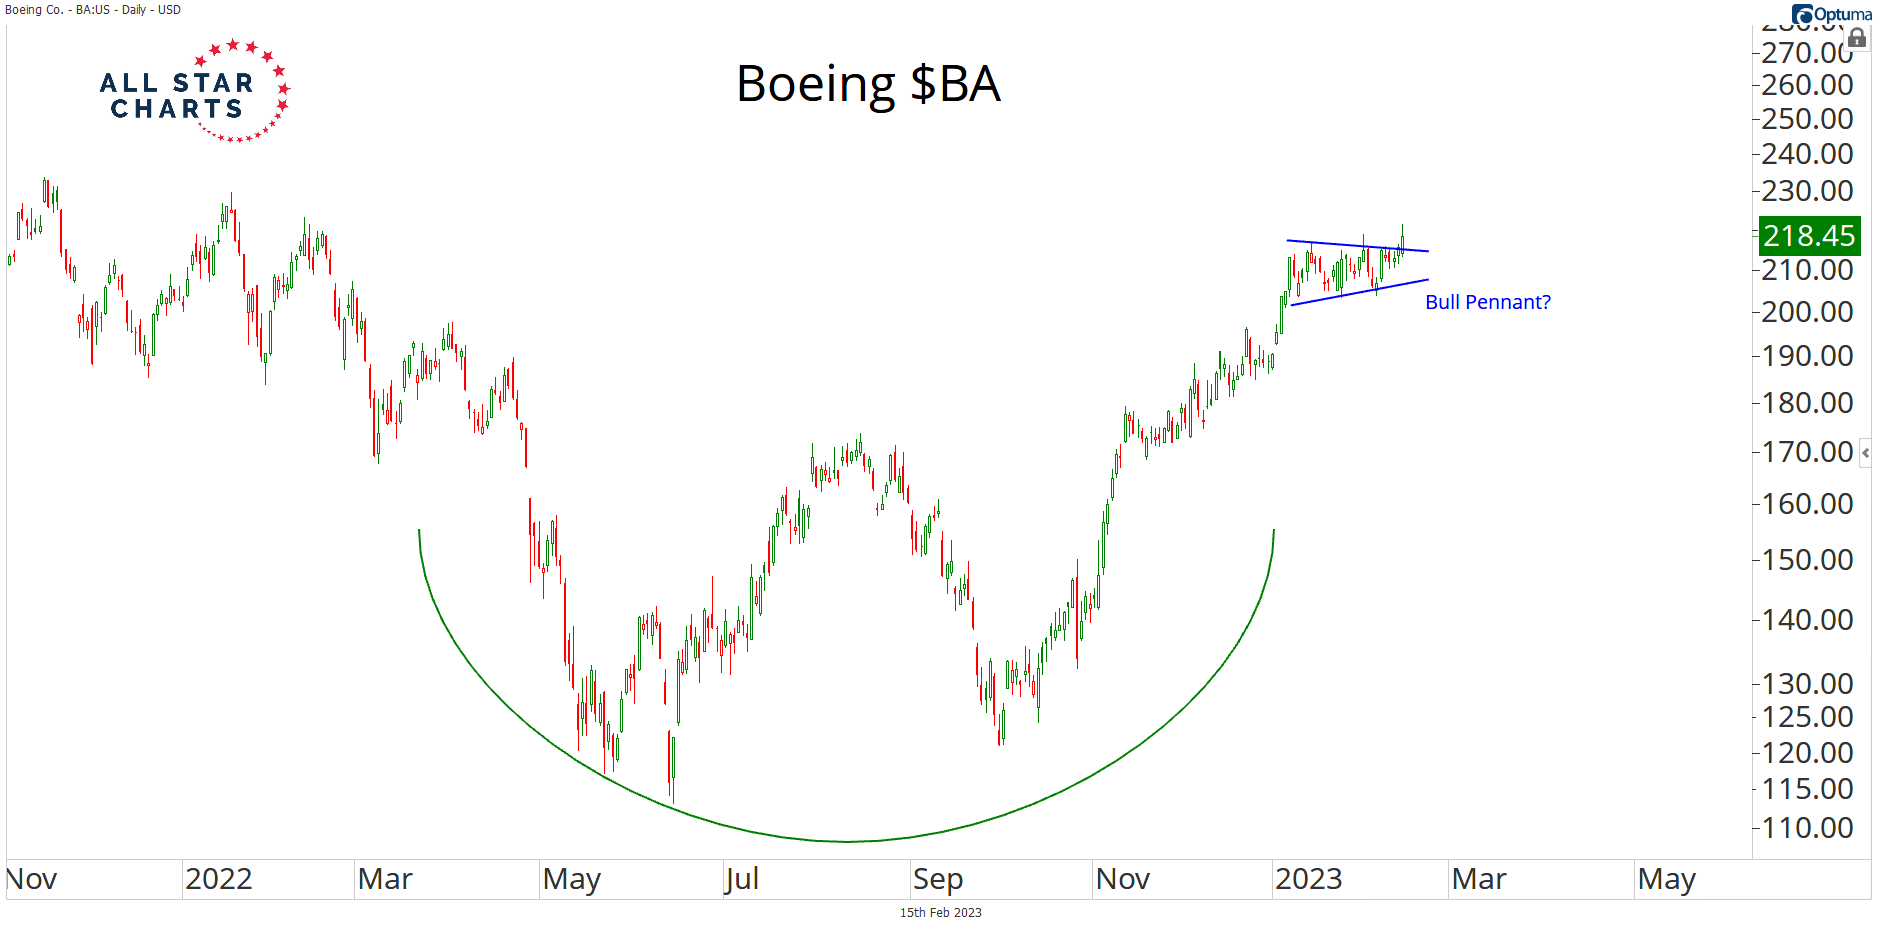
We’re going to get involved with a bullish options spread that gives us through the summer to most efficiently express this thesis.