From the desk of Willie Delwiche.
Expert technical analysis of financial markets by JC Parets
Key Takeaway:
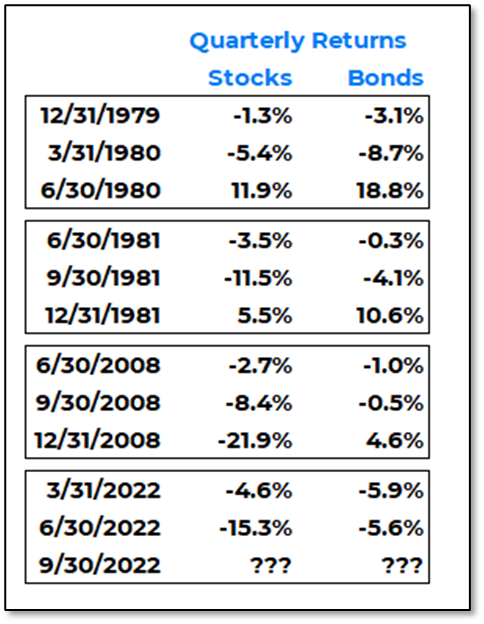
The first half of 2022 was one for the record books, but it was more dubious than distinguished. Only two years (2020 & 2009) in the past quarter century experienced more 1% moves in the first half than did 2022 and only one (2008) finished the year with a higher percentage of 1% moves than we have experienced in the first half of this year. Both stocks and bonds were down in back-to-back quarters for only the third time in the past 45 years. This contributed to the benchmark 60/40 stock/bond portfolio experiencing a first half of the year that was twice as bad as another in the past quarter century. According to data from Ned Davis Research, it was the worst first half for a balanced portfolio since the 1930’s.
There are plenty of observations about how the worst first halves are followed by strength in the second half and ample evidence that stocks tend to bottom prior to mid-term elections and then rally in their wake. Looking back through history, we anchor to the darkest days and see the daylight that follows. It is certainly true that sometimes bad periods have been followed by better periods, but other times they have been followed by worse periods. When both stocks and bonds have been down two quarters in a row in the past, the S&P 500 was all over the place in the quarter that followed: +12% in Q2 1980, +6% in Q4 1981, -22% in Q4 2008.
Because it’s been bad doesn’t mean it’s about to get good. Because the market has survived these periods of turmoil does not mean that investors have emerged unscathed, either financially or emotionally.
From the desk of Steve Strazza @Sstrazza
Check out this week’s Momentum Report, our weekly summation of all the major indexes at a Macro, International, Sector, and Industry Group level.
By analyzing the short-term data in these reports, we get a more tactical view of the current state of markets. This information then helps us put near-term developments into the big picture context and provides insights regarding the structural trends at play.
Let’s jump right into it with some of the major takeaways from this week’s report:
* ASC Plus Members can access the Momentum Report by clicking the link at the bottom of this post.
From the desk of Steve Strazza @Sstrazza
Our Top 10 Charts Report was just published.
In this weekly note, we highlight 10 of the most important charts or themes we’re currently seeing in asset classes around the world.
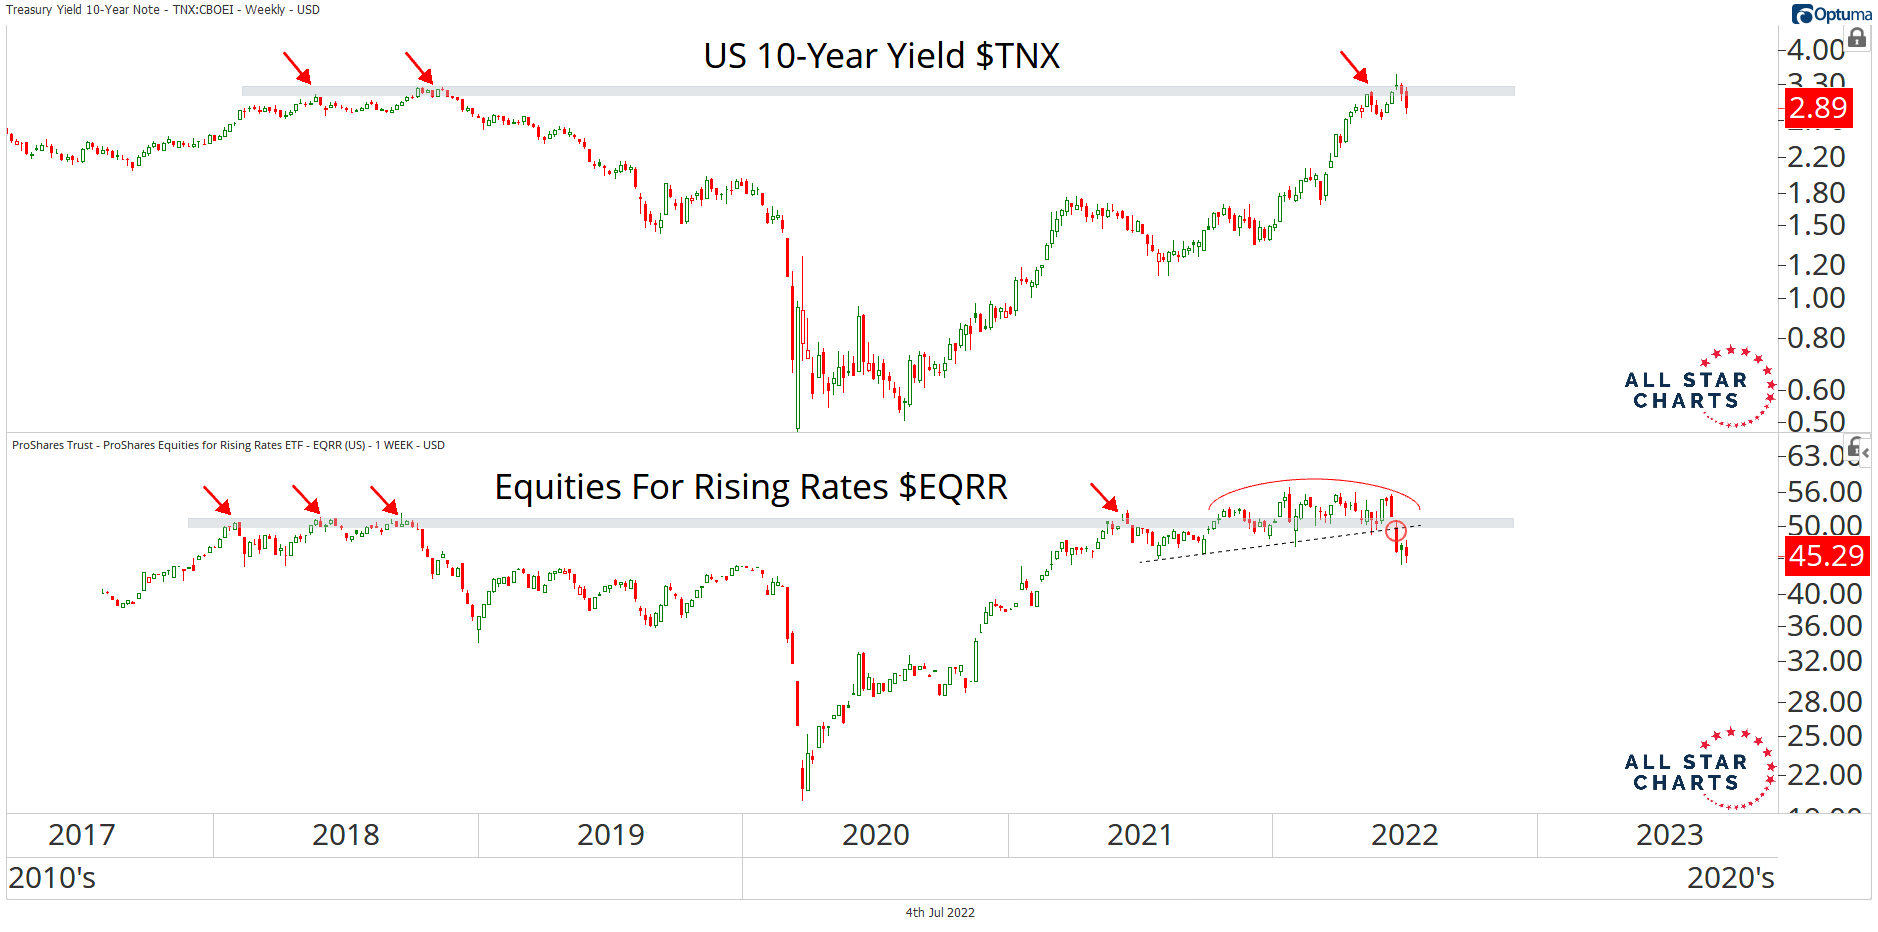
Equites Suggest Rates Roll
It’s not just commodities and the bond market that are disagreeing with the action from yields these days. We’re not getting confirmation from the stock market either. The Equities For Rising Rates ETF (EQRR) always offers excellent information to either support or contradict what we’re seeing from the bond market. When we overlay EQRR with the US 10-Year Yield (TNX), they look almost identical.
What this chart tells us is that the stocks that tend to do well in a rising rate environment could not hold their former highs and are now stuck below overhead supply. This lack of confirmation supports our outlook for a pause and some corrective action from yields in the near future.
From the desk of Willie Delwiche.
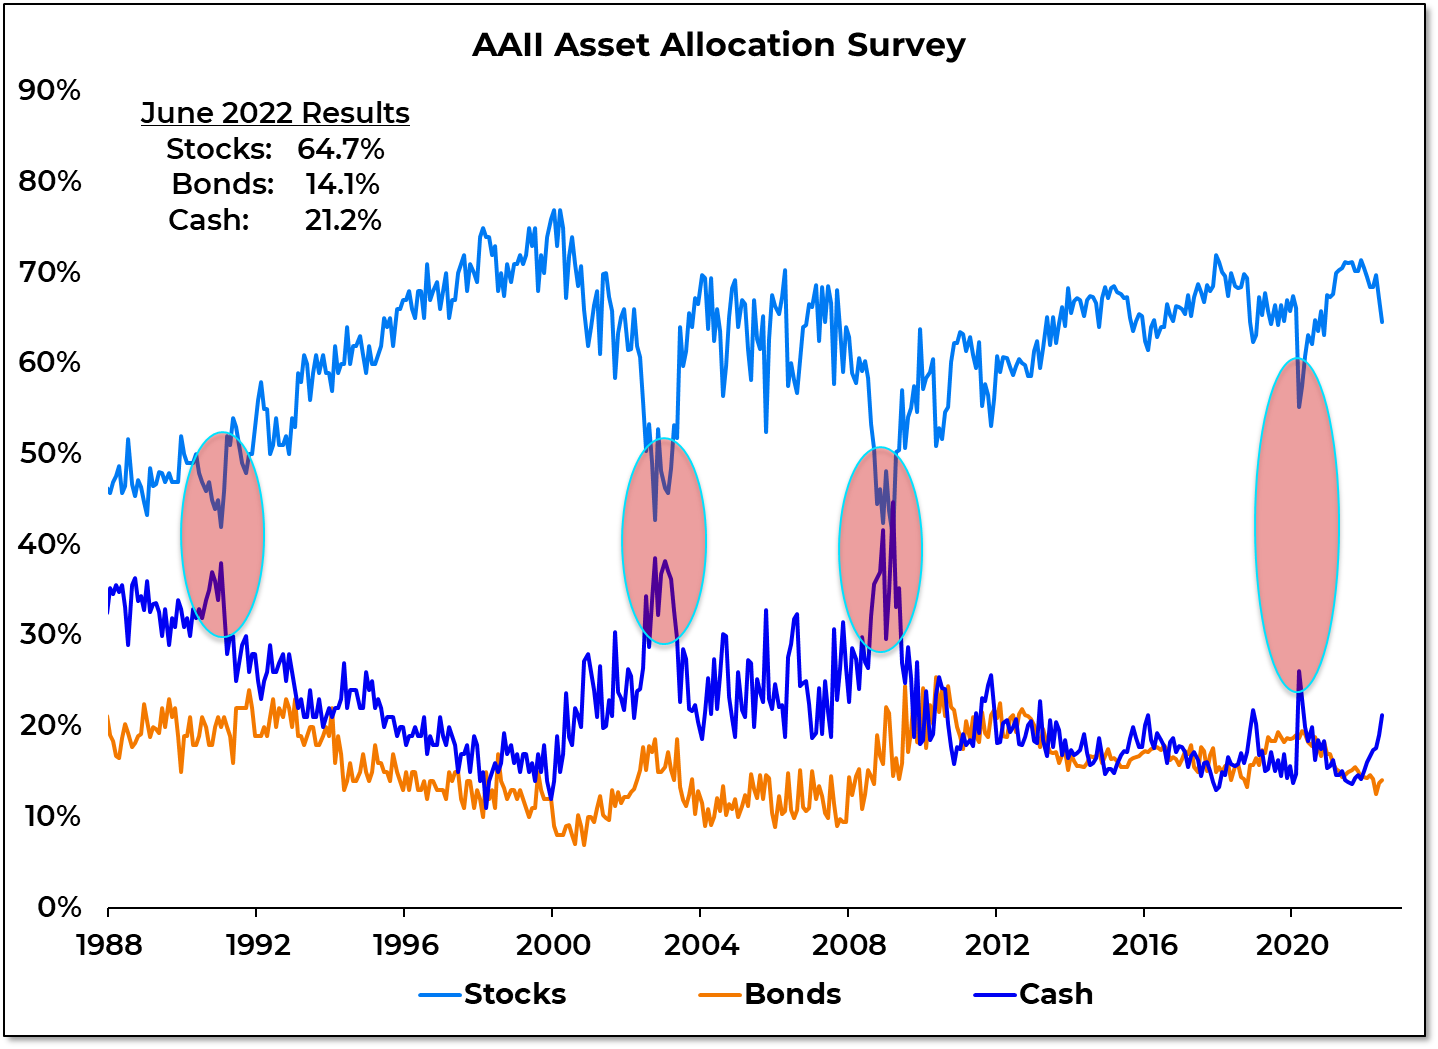
June asset allocation data from the AAII suggests that investors are beginning to act on their emotions. It’s not uncommon for sentiment to lead and positioning to lag, but the gap between the two had gotten historically wide. That is beginning to change as investors shift from equities to cash. The AAII asset allocation survey shows equity exposure dropping from 67% in May to 65% in June, while cash exposure rose from 19% to 21%. History suggests this could be the beginning of a larger unwind. When sentiment got to similar extremes in 1990, 2003 and 2008, stock exposure approached 40% from above and cash exposure approached 40% from below. By the March 2009 Financial Crisis low, cash exposure was above equity exposure. Even during the brief (though intense) COVID crash, equity exposure dipped to 55% and cash exposure jumped to 26%. If past periods are a guide, investors may only be in the early stages of adjusting equity market exposure.
This is the video recording of the June 30th Weekly Town Hall w/ Willie Delwiche.
06/30/22 2:00 PM ET [Read more…]
From the desk of Willie Delwiche.
Earlier this week, I laid out some similarities between now and 2008. From a price, liquidity, breadth and sentiment perspective, the echoes are there.
The comparisons keep popping up.
A couple of days ago, there was a chart showing that the ongoing decline in equity market value (relative to GDP) exceeds any other drawdown in the past 40 years with the exception of what was experienced during the Financial Crisis.
Today, it’s data from Gallup showing economic confidence is at levels only seen in 2008-2009.
I’m not saying that the market and the economy need to follow the course laid out in the wake of the Q4 2007 highs. But the more similarities we see, the more worthy it is of consideration. Put another way, until bulls provide proof that we are not following that path, it would be foolish (and perhaps expensive) to ignore it as a possibility. Don’t discount reality because it doesn’t fit with the narrative.
From the desk of Willie Delwiche.
Key Takeaway: With pessimism at levels that elicit comparisons to the financial crisis, conditions are set for a meaningful bounce in equities. But at this point, the similarities appear closer to what prevailed in the first half of 2008 than what was seen as stocks moved toward their final lows in March 2009. With the NYSE and NASDAQ still seeing more new lows than new highs (31 weeks and counting) and breadth thrusts conspicuously absent, the backdrop offers little about which to get excited. Recent leaders are experiencing newfound weakness and new leaders are more defensive in nature. Investors have endured a succession of failed rallies in recent months, but that patience may wear thin. The burden of proof is on the bulls. Rally attempts that increase hope but offer little strength would fit the pattern seen during the financial crisis
Sentiment Report Chart of the Week: Mixed Messages From Bonds
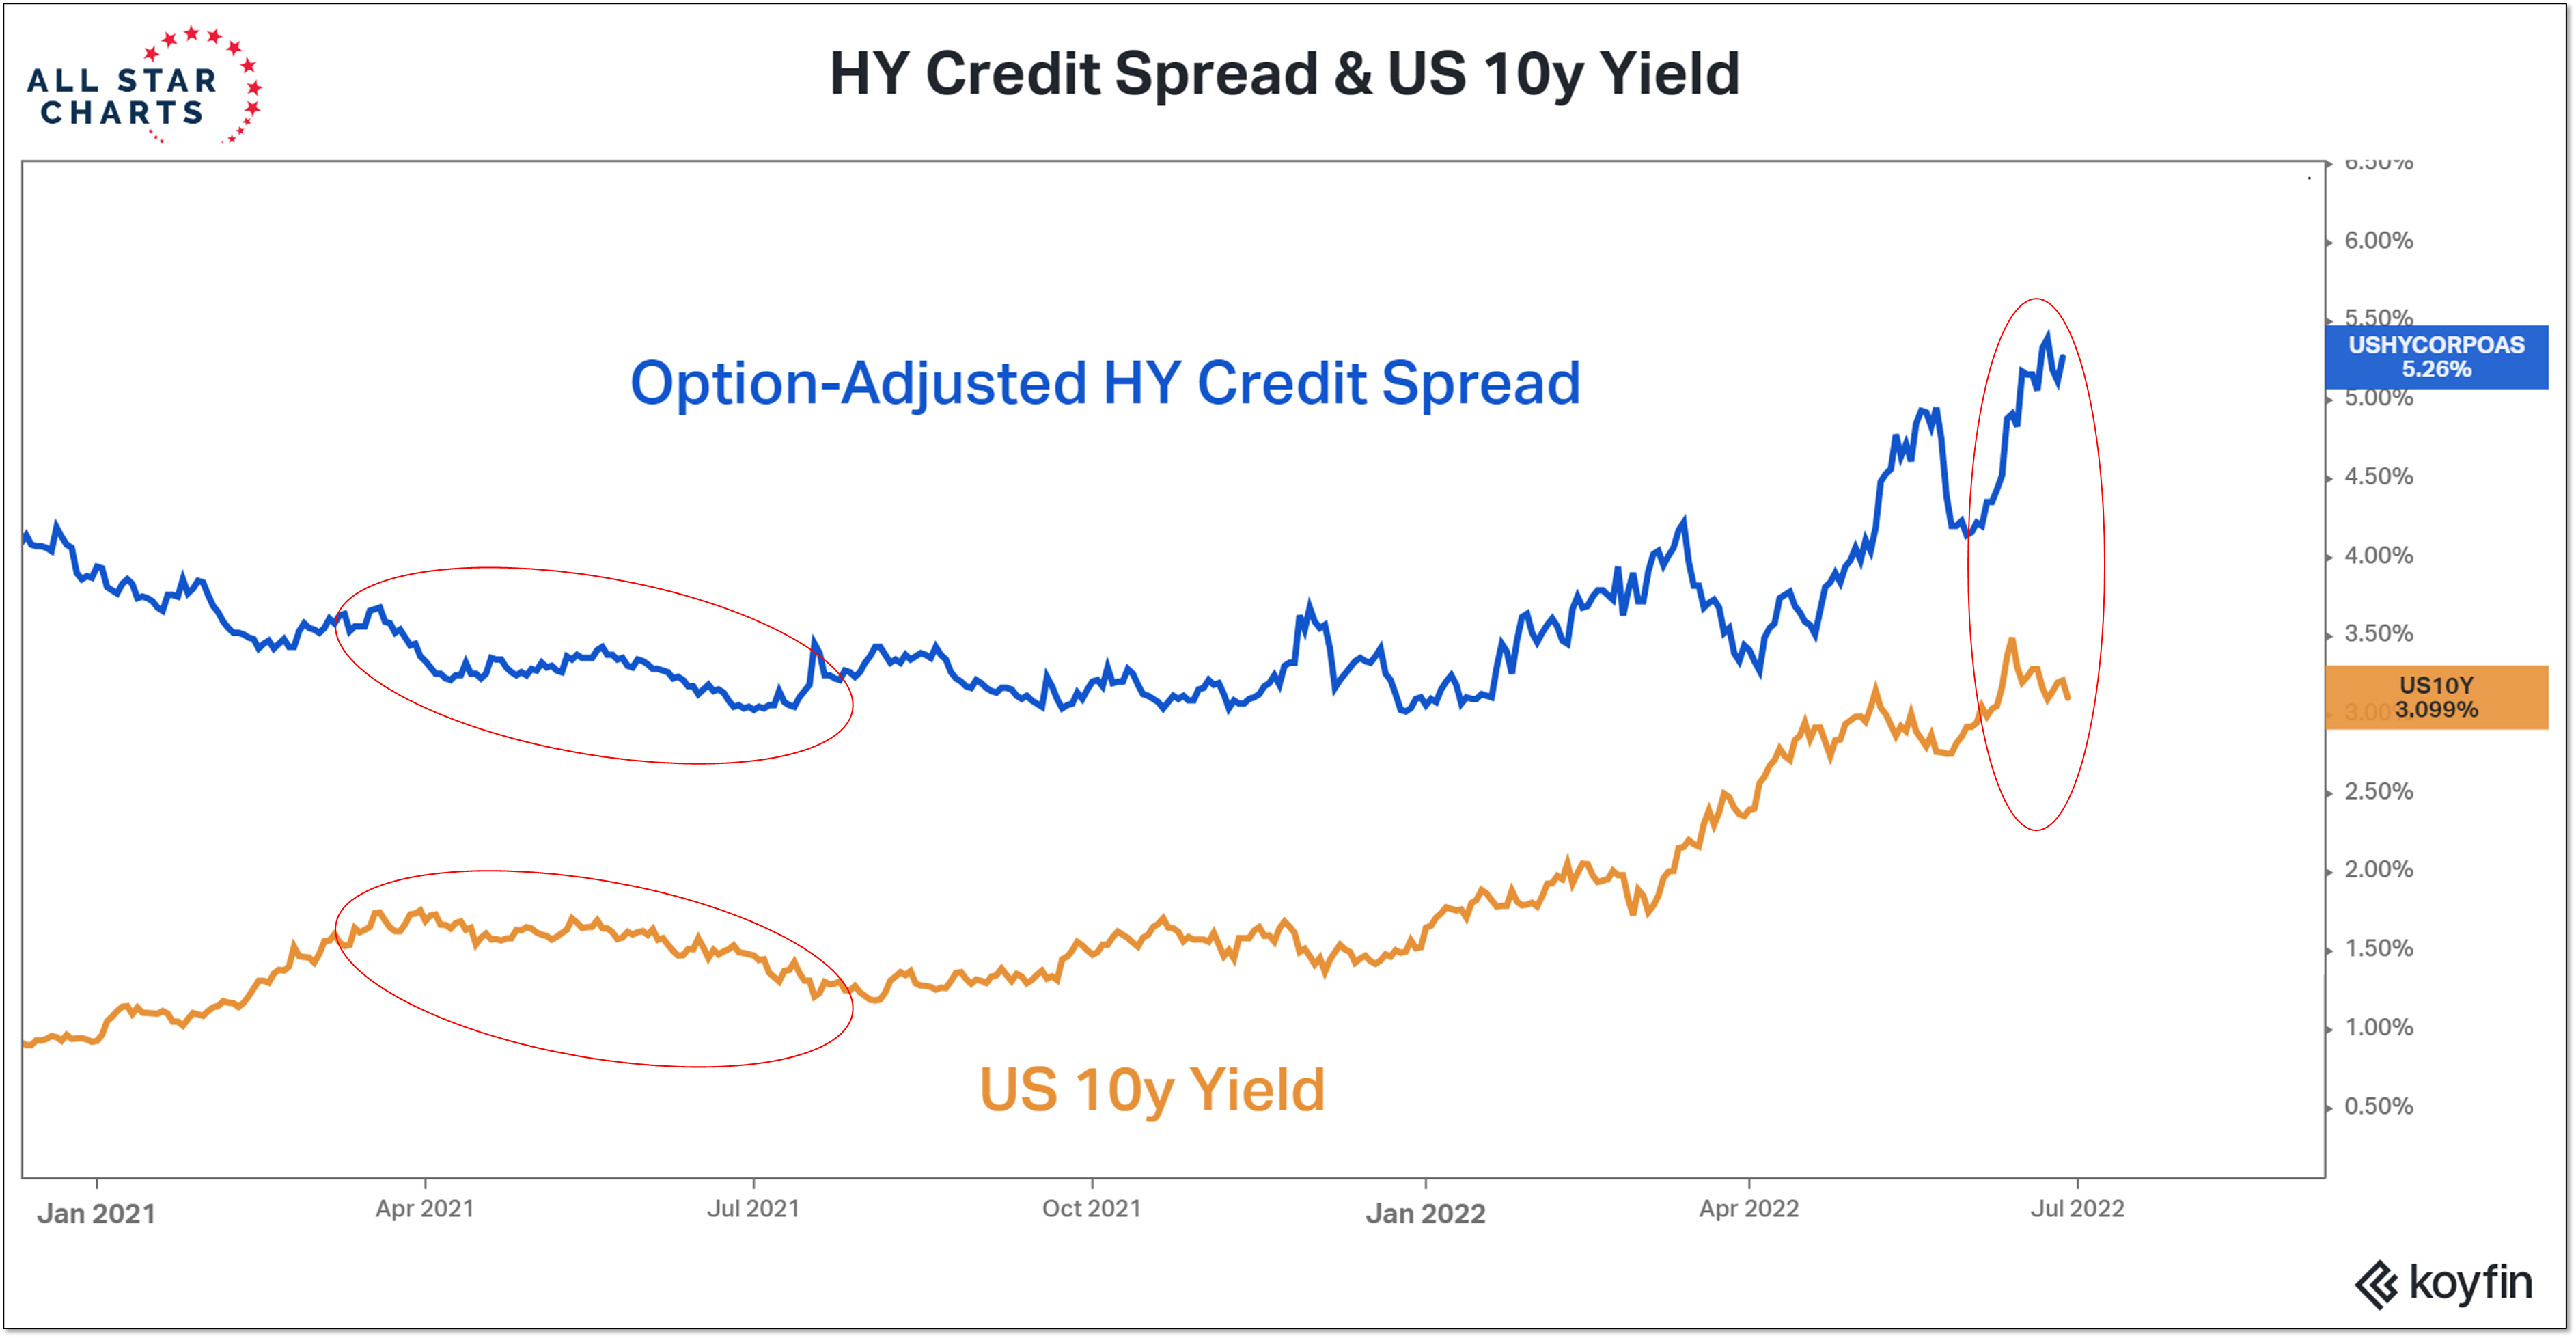
It’s been a rough first half for bonds. For now at least, Treasury yields have stopped crashing. When Treasury yields stopped rising and started to move lower in the first half of 2021, investor moods improved and risk appetites increased. Back then, however, lower Treasury yields were accompanied by narrowing credit spreads. Now, while Treasury yields have pulled back from their highest levels in over a decade, High Yield spreads are climbing to levels not seen since the COVID crisis. Junk bond ETF’s are trading at their lowest levels in more than two years. In this scenario, lower Treasury yields might not be a green light for growth areas of the market, but a move to safety that could include a re-evaluation of overall equity exposure (of which households have historically high levels) and/or an increased preference for defensive areas of the market.