This is the video recording of the September 15th, 2022, Weekly Town Hall w/ Willie Delwiche.
09/15/22 2:00 PM ET [Read more…]
Expert technical analysis of financial markets by JC Parets
This is the video recording of the September 15th, 2022, Weekly Town Hall w/ Willie Delwiche.
09/15/22 2:00 PM ET [Read more…]
From the desk of Willie Delwiche.
Something was getting into our grapes.
That much we knew. We could see the evidence in the mess under our arbor every morning. Our dog was also aware of its presence. But we didn’t know exactly what “it” was – until Friday.
Rather than waiting patiently by the back screen door, the dog was crouched as if he was in starting blocks. He was ready to launch himself onto the scene.
He sprinted to the grape arbor, and after a brief glance at the vines, he raced along the fence. Within moments, he had his prey, shook it vigorously (as he has done in the past), and dropped a limp body. I walked over to get my first glimpse of the intruder.
Laying motionless at the dog’s feet was a not insubstantial possum.
From the desk of Willie Delwiche.
Key Takeaway: The bulls have some heavy lifting as bears pack on the pounds. Yes, last week was impressive, as was the summer rally. But questions about sustainability remain. After all, in the wake of the greatest bull market rally in history in 2020/2021, it shouldn’t be surprising to get the most significant bear market rally ever in 2022. That leaves stocks with an uphill battle in the face of persistent macro headwinds (rising interest rates, dwindling growth expectations, and unrelenting US dollar strength). While pessimism has reached levels indicating opportunity and decreased risk for longs, downside risks remain. An increase in selling pressure could excite the bear camp, prompting a more complete unwind in equity exposure and accelerating interest in bonds even if yields continue to move higher.
Sentiment Report Chart of the Week: Bonds Unloved For Long Enough?
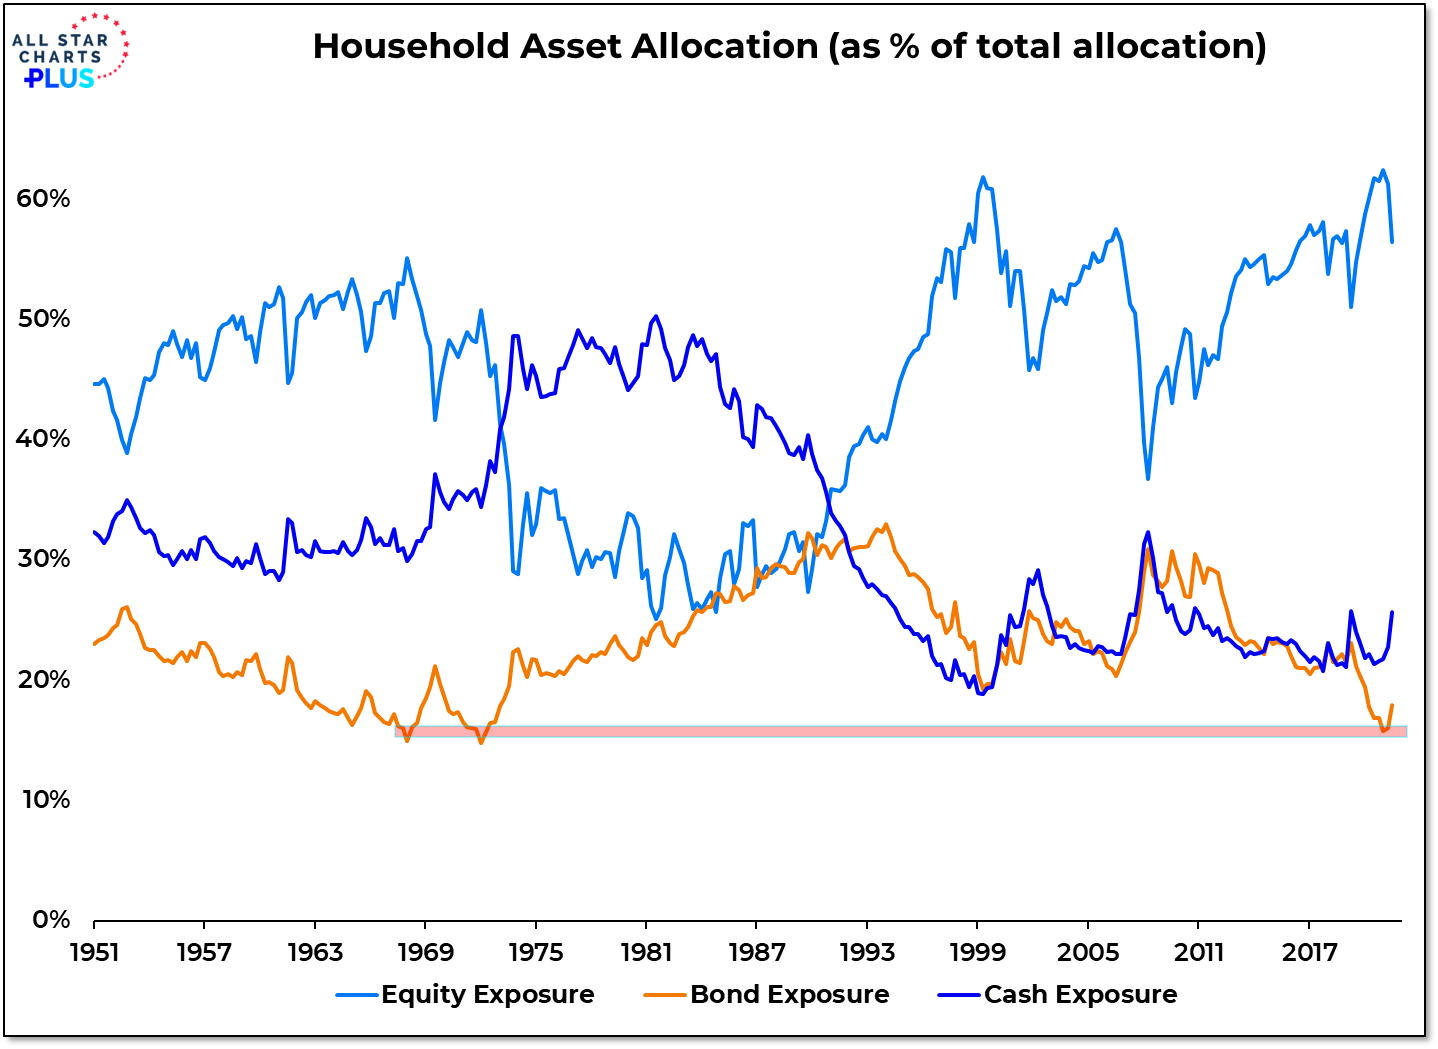
Quarterly data from the Federal Reserve shows investors are getting more interested in bonds, albeit from extremely low levels. Coming into this year, household exposure to bonds (as a percent of total allocation) was around 16%, a 50-year low. At the end of the second quarter, exposure had risen to nearly 18%. Equity exposure coming into this year was at an all-time high above 62% and has since dropped to 56%. Some of the shift in exposure this year reflects price volatility though in inflationary environments, stocks and bonds move in the same direction. What these shifts reveal is active rotation from stocks to bonds. Even after these moves, stocks are historically over-owned and bonds (and cash) are historically under-owned. With the tailwinds that fueled outsized gains in equities over the past decade fading, this could very well be the beginning of a generational shift away from equities and toward bonds.
Key Takeaways:
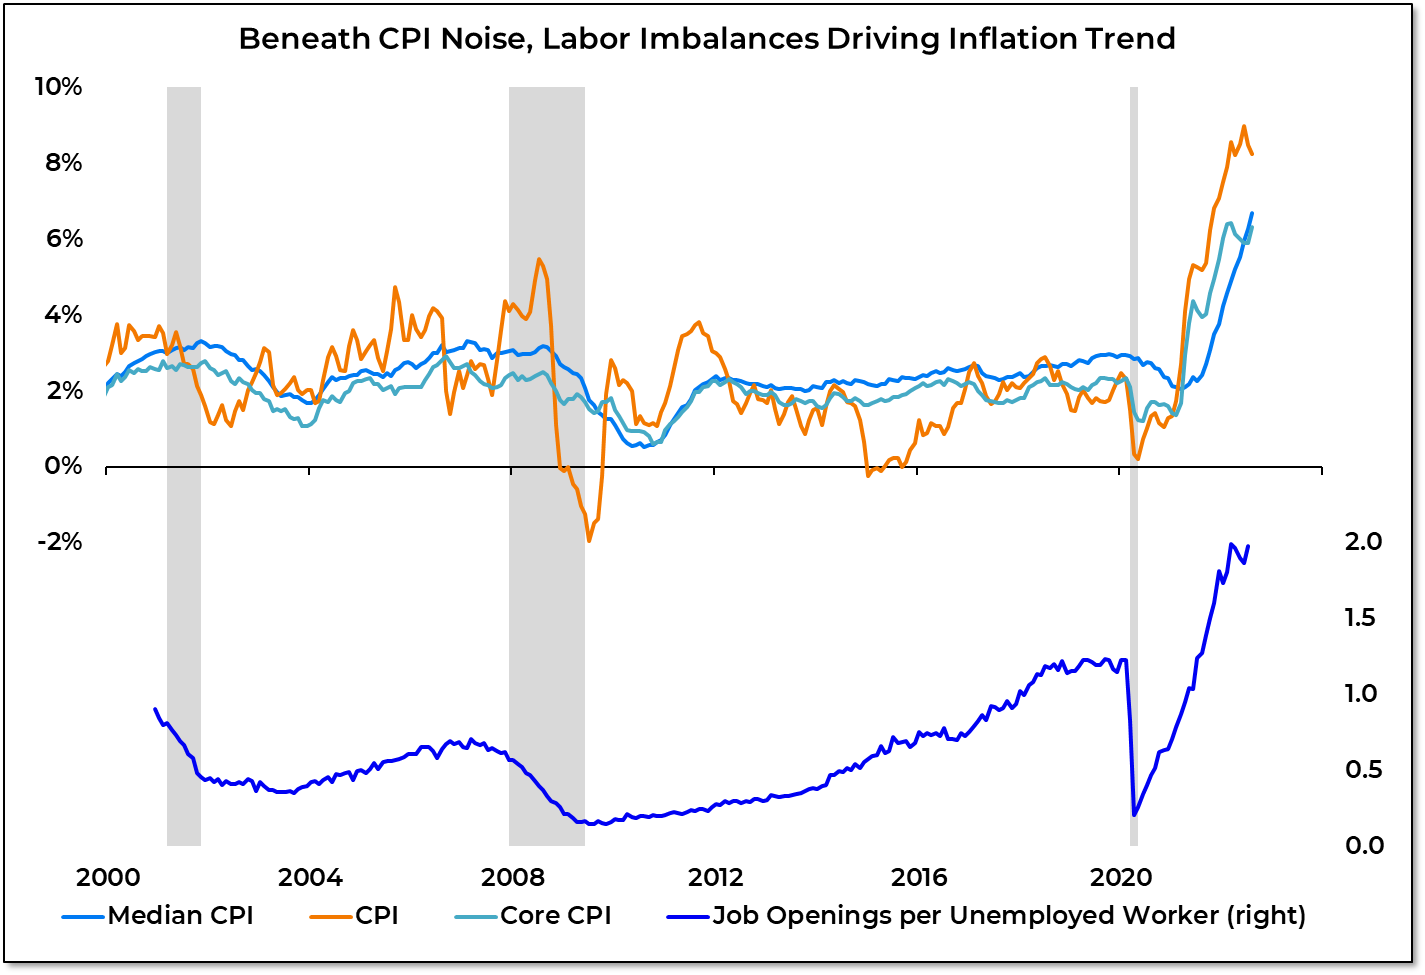
Surging inflation over the past year has always been about more than just planes, trains, and automobiles – how much they cost to purchase and how much they cost to operate. Too much of the focus has been on the inflation outliers like the spike & cooling in used car prices or the surge and collapse in gasoline prices. Those are post-COVID talking points, but not really drivers of the underlying trend in inflation. So while headline CPI and (to a lesser extent) core CPI get the headlines, median CPI continues to trend higher, as it was doing pre-COVID and as it has been doing in recent months.
Imbalances in the labor market are driving this trend – which suggests that getting inflation under control will be inconsistent with a soft-landing for the economy. This isn’t just about tolerating a recession, the Fed may need a recession to have a realistic shot at getting inflation back to more benign levels. For the financial markets, this means more tightening from the Fed and higher bonds yields than a generation of investors have ever seen. The market’s resiliency in the face of sharp and persistent increases in yields is likely to be tested.
Key Takeaway:
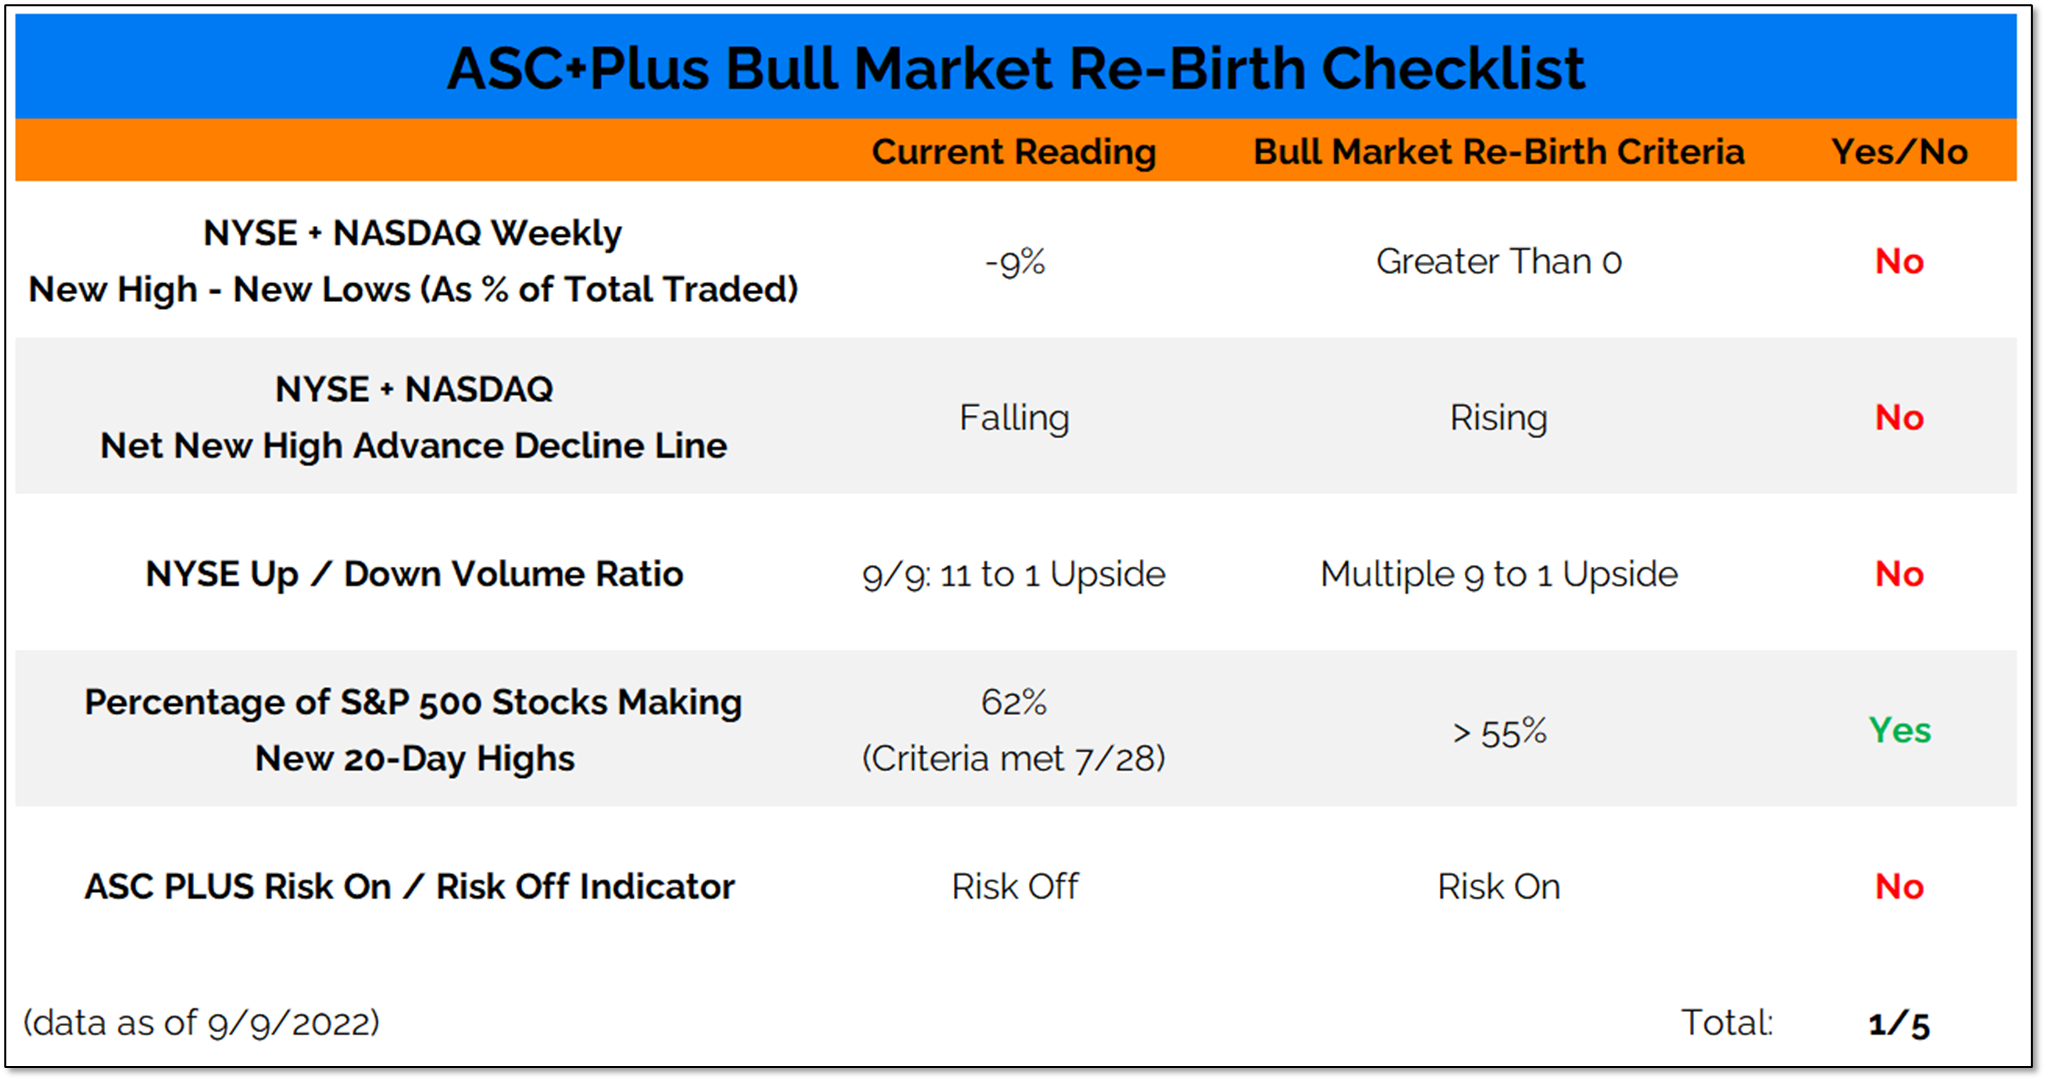
Stocks turned higher last week, and while Friday saw more new highs than news on the NYSE for the first time in two weeks, it was not enough to prevent a third consecutive week of new lows outpacing new highs (on both the NYSE and NASDAQ). Friday’s strength was sufficient to produce an encouraging up-side volume thrust and our short and intermediate-term risk indicators moved back into positive territory last week. If stocks can build on that progress, we could soon be hitting “Yes” on a number of our Bull Market Re-Birth Checklist criteria. But there is still plenty of work to be done.
From the desk of Steve Strazza @Sstrazza
Our Top 10 Charts Report was just published.
In this weekly note, we highlight 10 of the most important charts or themes we’re currently seeing in asset classes around the world.
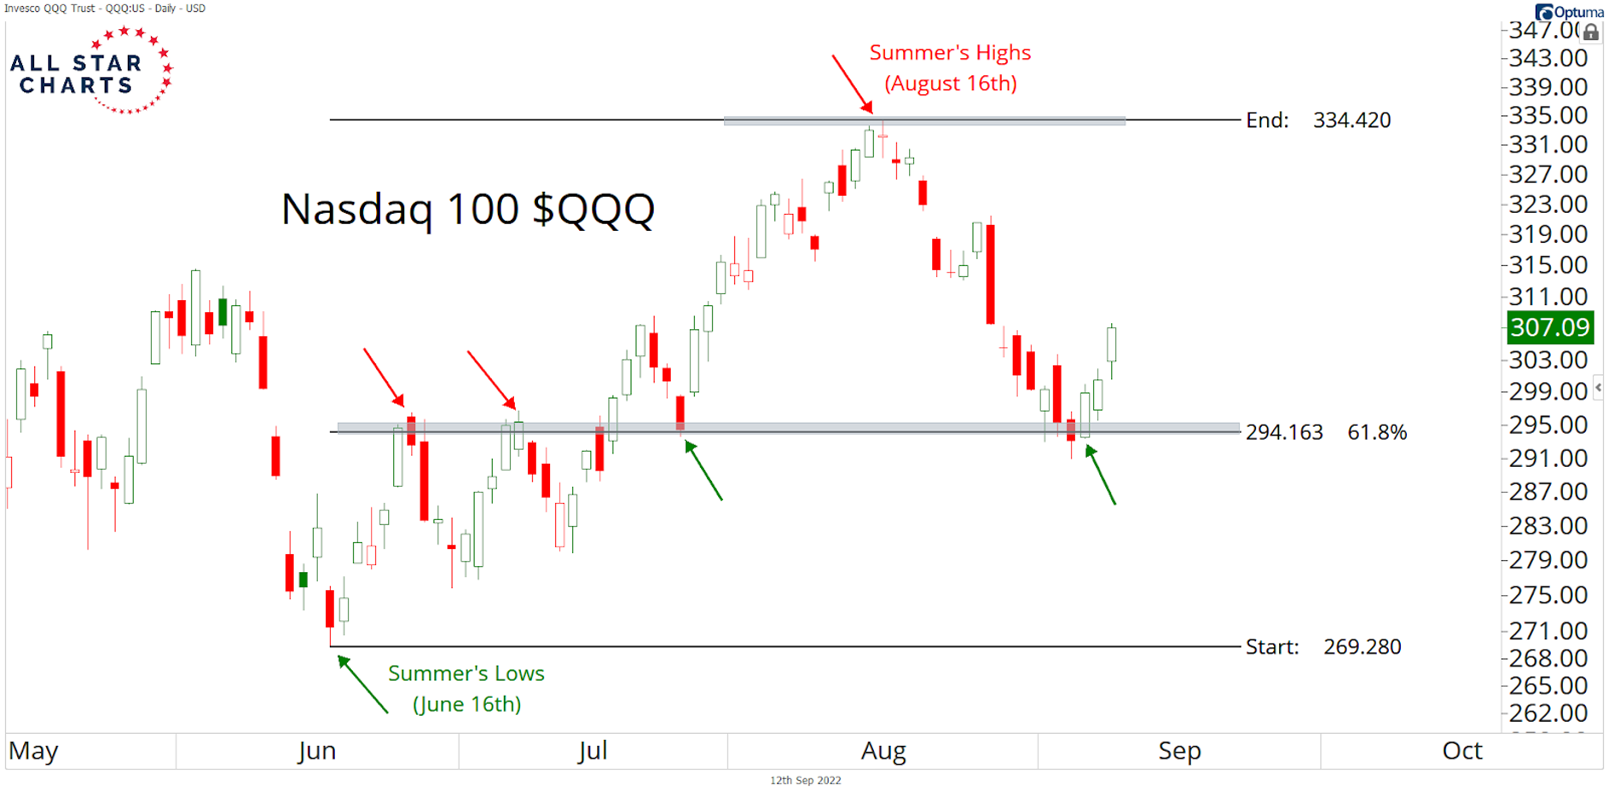
Finding Support with Fibonacci
US equities appear to be regaining ground after giving back some of their gains from this summer. Following the corrective action of the last few weeks, the Nasdaq 100 ETF has finally found support at the 61.8% Fibonacci retracement level of the June-to-August advance. These levels represent a logical place for demand to show up and halt prices from falling further. We’re watching closely to see what kind of follow-through we get in the coming days. If this was really the bottom, we should see a higher high in the near future. On the other hand, a break below 294 would signal increased downside risk and likely lead to a retest of the June lows. From a tactical standpoint, this is our line in the sand for the Nasdaq 100.
From the desk of Steve Strazza @Sstrazza
Check out this week’s Momentum Report, our weekly summation of all the major indexes at a Macro, International, Sector, and Industry Group level.
By analyzing the short-term data in these reports, we get a more tactical view of the current state of markets. This information then helps us put near-term developments into the big picture context and provides insights regarding the structural trends at play.
Let’s jump right into it with some of the major takeaways from this week’s report:
* ASC Plus Members can access the Momentum Report by clicking the link at the bottom of this post.
From the desk of Willie Delwiche.
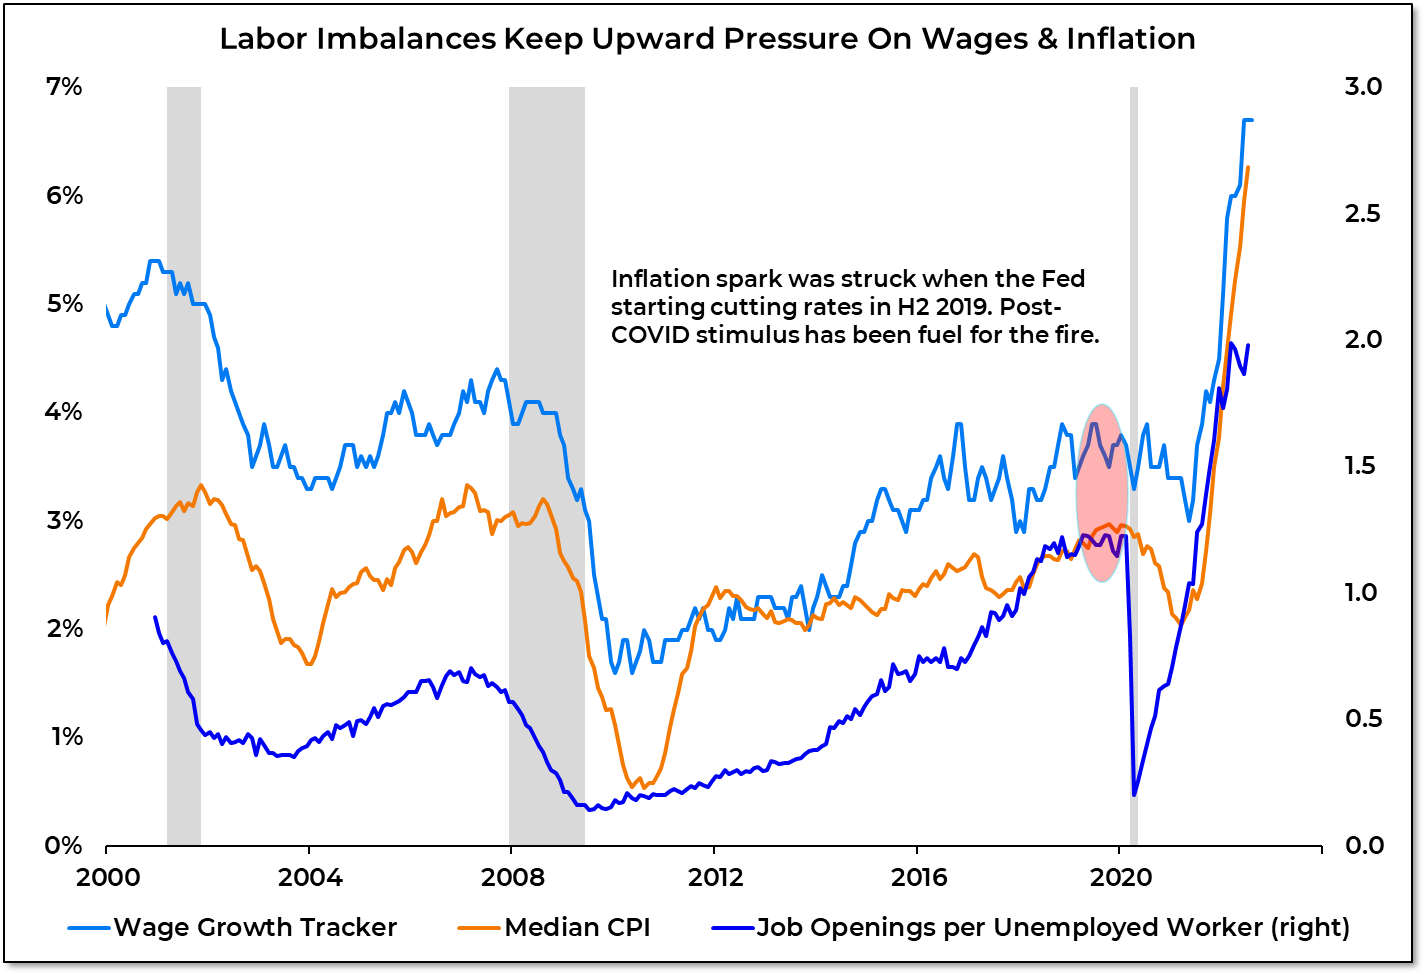
Inflation data has overtaken jobs data as the economic indicator that seems to generate the most interest every month and next week’s CPI report will be no different. But seeing inflation just from a post-COVID perspective misses the point. It’s not about prices for used cars or gasoline or shipping containers. Those might be in the headlines but they aren’t the news. The match was struck when the Fed was cutting rates in H2 2019 with wage growth and median CPI inflation at their highest levels in a decade and more job openings than unemployed workers for the first time ever. That reality got lost during the COVID shut-down & re-opening. All the stimulus that followed was fuel for the fire. The Fed made a policy error in 2019. The Fed compounded that error by mis-reading the situation and remaining complacent through 2021. All that being said, we may very well be nearing peak inflation. Inflation needs to stop going up before it can start going down. But it having stopped going up doesn’t mean that it has started going down in a meaningful way.