Fibonacci Analysis is one of the most valuable and easy to use tools that we have as market participants. I’ve studied supply and demand behavior for over a decade, and I find myself using Fibonacci tools every single day. These tools can be applied to all timeframes, not just short-term but longer-term. In fact, contrary to popular belief, technical analysis is more useful and much more reliable the longer your time horizon. Fibonacci is no different. [Read more…]
The S&P500 Runs Into Overhead Supply, Perfectly Normal
This doesn’t have to be complicated guys. Supply and Demand dynamics do not change. I keep hearing how this market is “algo driven” or whatever, but those algos are built by humans. Supply and demand is based on fear and greed in humans, whether discretionary or systematic. I think the debate about algos is a waste of time for all of us. Let the noisemakers, who aren’t trying to make money in the market, worry about that stuff. We’re here to focus on supply and demand. Period.
The S&P500 has struggled over the past week to continue this monster rally from last month’s lows. It should not be a surprise to anyone that we have struggled. Why? Because prices just ran into a ton of overhead supply. This correction is normal, and should be expected. Blame the algos if you want to sound smart in front of ignorant people at a cocktail party, but where I come from, we call this “normal”: [Read more…]
Buy Canada And Short America!
What do you guys think? Buy Canada and short America? Some of you might like the sound of that, others might hate it. Personally I don’t care either way. I treat Canada and the U.S. the same way as I would treat Indonesia, China, Peru, Soybeans, Cocoa, Japanese 10-year yields or Aussie Dollars. It’s just letters and math to me, so I don’t care if Apple doubles in price or goes to zero. The implications of market moves are nothing I can control or worry about. I’m just here to try and profit form the changes in price.
Today I want to talk about why I still think we need to be shorting America and buying Canada instead. This is one I’ve been pointing to since late January, but since then price has just confirmed everything that we were originally seeing.
Here is a 4-year chart of Canada’s TSX Composite Index vs America’s S&P500 Index. You can see this ratio trading lower within a nice clean downtrend channel for several years. More recently in the 4th quarter last year, price fell below the lower of the two parallel trendlines, only to quickly recover in late January. This also confirmed a bullish momentum divergence, as you can see plotted below:
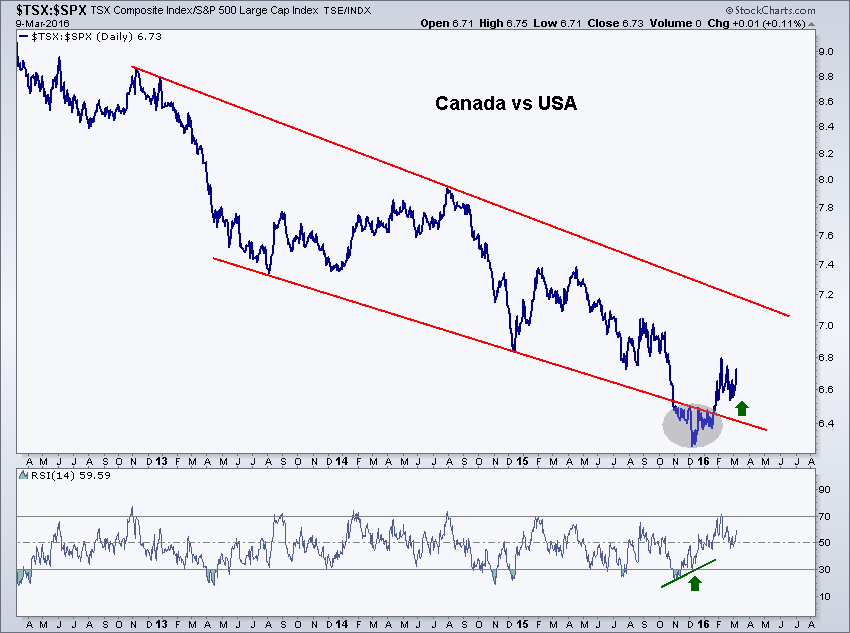
This has been trending higher over the past 6 weeks and I still believe that the failed breakdown earlier this year will be the catalyst to continue to take this higher towards the upper of these two parallel trendlines. It looks like we’re heading back above 7 where I would take tactical profits and reevaluate.
Looking bigger picture, on the other hand, we could be at the beginning of a monster breakout. Here is a longer-term chart going back 20 years. This could be a logical area for this ratio to find support, as it did in 2000 and 2001. Also, we can see that momentum is also diverging positively. Over the past year, this ratio has made 2 lower lows in price, but momentum has put in a higher low on each one of those occasions:
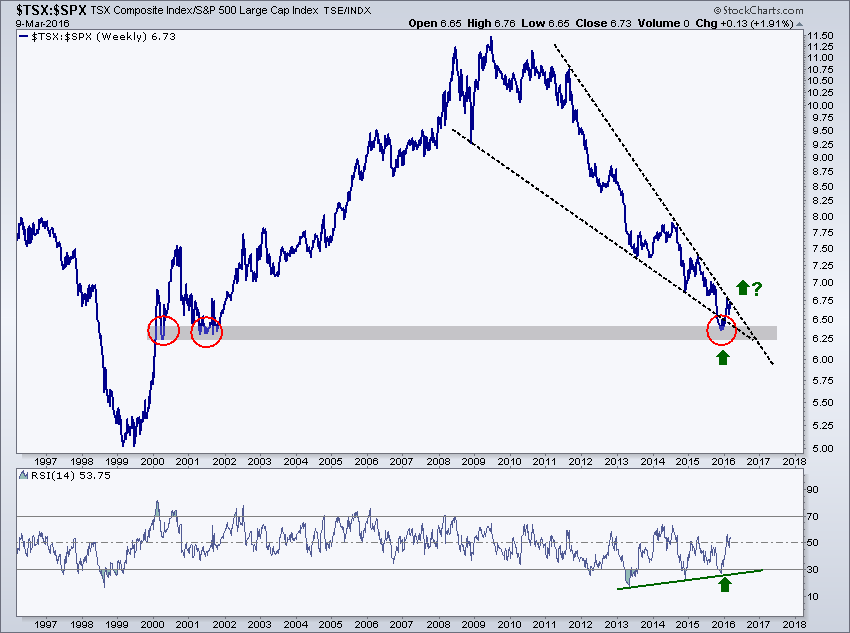
If we can take out the upper of these two converging trendlines over the past 6-7 years, I would expect a big move higher, towards at least 8:1. I would continue to buy Canada and short America with equal nominal amounts. As long as we’re above the lower of these two converging trendlines, I want in!
***
Last night, Wednesday 3/9/16, was our Monthly Members Only Conference Call. If you’ve been considering a 30-Day Risk-Free Trial, now is the time. Join today to access the video recording of last night’s call.
Click here to start your 30-Day Risk-Free Trial Today!
Tags: $EWC $TSX $SPX $SPY
[Premium] Monthly Conference Call Video Recording March 2016
Here is the video recording of the February 2016 Monthly Conference Call for Members Only
In the call we discuss:
- How much more upside is left in this global stock market rally?
- Should we expect the U.S. to continue to underperform vs. Emerging Markets?
- How Much Higher Can Crude Oil Go From Here?
- The longer-term dynamics in Gold Miners have changed. How do we profit?
- Apple has bottomed – How high can it go?
- Why We Are Finally Getting That sector rotation into Biotechnology [Read more…]
[Premium] What Intermarket Analysis Is Suggesting About The Current Market Environment
Intermarket Day is one of my favorite days. Yes I’m a huge nerd. Deal with it!
This is when I go through many markets relative to each other. These markets include individual U.S. Sectors compared with the overall U.S. Stock market. We also look at other assets against each other like Bonds, Commodities and Currencies. We price Gold in other currencies, and change around denominators for both trade idea generation and also for informational purposes.
Here are some of the things that stood out from this week’s homework:
The U.S. Stock Market Bottomed In 2008, Not March 2009
Today is the 7th anniversary of the S&P500 closing low in March 2009. This date, March 9th, has gone down as the historic low in the stock market after the financial crisis of 2008. But the truth is that the market of stocks bottomed out well before that. Let’s remember that the S&P500 is just 1 index with only 500 stocks. The majority of stocks had already bottomed by the time the S&P500 ultimately made its low towards the end of the 1st quarter of 2009. [Read more…]
[Premium] Chart Of The Year: What To Do With Gold and Silver?
Sometimes I share with you guys what I think is a really interesting chart and/or trade and call it the “Chart of the Week”. Other times I’ll put together a study to try and confirm or invalidate a prior thesis of mine and I’ll title that the “Spreadsheet of the Week”. Today, however, I think I have what could very possibly be the Chart Of The Year! [Read more…]
[Chart Of The Week] About That Bottom In Crude Oil
There are a lot of interesting things going on in the Crude Oil market these days from both a long-term and a short-term perspective. Premium Members of Allstarcharts have wanted to be long Crude Oil since mid-February when prices were able to get back above that key $29.60 level. Our short-term upside target was near $38 and this target is being hit this week. Nice little 30% rally. But moving forward, the implications of this short-term move now change the supply and demand dynamics in Crude Oil bigger picture. [Read more…]
- « Previous Page
- 1
- …
- 281
- 282
- 283
- 284
- 285
- …
- 472
- Next Page »